I. INTRODUCTION
The application of lithium-ion batteries for battery electric vehicles (BEV) requires high energy density, low cost, long life, and absolute safety. The cathode is a critical component of the battery because it is the limiting factor with respect to cell energy density and hence a major determinant of the mass, volume, and cost of the battery. Lithium-rich layered oxides Li[Lix/3Mn2x/3M1−x]O2, alternatively designated as xLi2MnO3–(1 − x)LiMO2 (M = Ni, Mn, Co) or HE-NMC, are attractive candidates as cathodes for lithium-ion batteries because they exhibit higher capacity (>250 mA h/g) and lower cost than commercially available cathode materials.Reference Manthiram, Knight, Myung, Oh and Sun1
The high capacity of HE-NMC cathode materials is attributed to oxygen anion participation in redox reactions in addition to transition metal ions.Reference Koga, Croguennec, Ménétrier, Douhil, Belin, Bourgeois, Suard, Weill and Delmas2 In spite of the high capacity of HE-NMC, there are fundamental challenges preventing its commercial application. These include voltage decay during cycling,Reference Wu, Ma, Yang, Li, Allard, Liang and Chi3 short calendar and cycle life,Reference Oh, Myeong, Cho, Lee, Ko, Jeong and Cho4 and fast resistance rise at low state of charge (SOC).Reference Li, Bettge, Polzin, Zhu, Balasubramanian and Abraham5 These challenges are closely related to the Mn-rich nature and the structural instability of these materials induced by the loss of oxygen. Considerable research has been devoted to understanding the structural evolution of HE-NMC materials. Experimental and theoretical studies of the microstructural evolution suggest the formation of tetrahedral lithium ions and transition metal migration leading to spinel-like phase transformations on the surface of the materials.Reference Zheng, Xu, Gu, Xiao, Browning, Yan, Wang and Zhang6 The cation rearrangement and surface phase transformation facilitated by oxygen removal likely lead to voltage and capacity fade in HE-NMC.Reference Qian, Xu, Chi and Meng7 Attempts to control these issues that plague lithium-rich materials include doping,Reference Qiao, Qin, Li, Wang and Gao8–Reference Yu, Wang, Liu, Zhang, Wang, Shu, Yang and Huang16 surface coatings,Reference Chen, Geng, Du, Zuo, Cheng, Ma and Yin17–Reference Zhang, Belharouak, Li, Lei, Elam, Nie, Chen, Yassar and Axelbaum20 and control of particle morphology and microscructure.Reference Yang, Wang, Yu, Bai, Shu, Ge, Guo, Wei, Liu and Wang21–Reference Verde, Liu, Carroll, Baggetto, Veith and Meng24
This investigation focuses on the source of these structural changes and seeks to mitigate them through doping. Silicon was chosen because it forms an Li2MO3 phaseReference George, Richet and Stebbins25 that is structurally compatible with HE-NMC, where the silicon is likely to occupy some of the manganese sites. Additionally, silicon has a 4+ valence state, the same valency as manganese in the pristine state, and therefore should not alter the valence of the other ions. In prior work, silicon has been successful incorporated into LiNixMnyCo(1−x−y)O2, where it increased the capacity and decreased electrochemical impedance.Reference Na, Kim and Moon26 Silicon is not lithium active, so instead of participating in the redox reactions, it may serve as a “pillar” that inhibits phase changes and helps to lock the initial structure in place.
II. EXPERIMENTAL
A. Synthesis
Li[Li0.2Mn0.54Ni0.13Co0.13]O2 powders were synthesized by a co-precipitation method. The reactant quantities were calculated to give a Li1.2Mn0.54−xNi0.13Co0.13O2 control stoichiometry, with 3% excess lithium added for lithium loss due to sublimation during heating. Dopant quantities were calculated to substitute manganese at x = 0.02 and 0.05 doping levels, yielding Li[Li0.2Mn0.52Si0.02Ni0.13Co0.13]O2 (HENMC-Si0.02) and Li[Li0.2Mn0.49Si0.05Ni0.13Co0.13]O2 (HENMC-Si0.05), respectively. Manganese sulfate tetrahydrate (Sigma-Aldrich, St. Louis, Missouri), cobalt sulfate septahydrate (Sigma-Aldrich), and nickel sulfate hexahydrate (Sigma-Aldrich) precursors were dripped into a potassium hydroxide (Baker, Radnor, Pennsylvania) solution and the precipitate was filtered, washed with deionized water, and dried in an 80 °C oven overnight. Lithium hydroxide and silicic acid (Sigma-Aldrich) were measured and ground with the dried transition metal precipitate using a mortar and pestle for 30 min. The ground powder was placed in a crucible and calcined in a furnace at 900 °C for 12 h.
B. Material characterization
The structures of the samples were determined using X-ray powder diffraction measurements made on a Bruker D8 Advance diffractometer (Bruker, Billerica, Massachusetts) with Cu Kα radiation in the 2θ range of 10°–90° at a step rate of 0.01°/s. Scanning electron microscopy (SEM) images were collected to investigate the morphology of the material. Electrode powders were attached to aluminum stubs using two-sided conductive carbon tape. A conductive gold-palladium alloy was sputter deposited onto the powders for 8 s using a Denton 11 deposition system (Denton Vacuum, Moorestown, New Jersey). Images were obtained using a Hitachi s-4800 SEM (Hitachi, Tokyo, Japan) with 5 kV accelerating voltage, 5 mm working distance, and the inlens detector. A Thermoscientific Nicolet Almega XR dispersive Raman spectrometer (Thermo Scientific, Waltham, Massachusetts) was used with a 532 nm wavelength source, 20× objective lens, and 100 μm aperture to characterize structural changes in electrodes at various points in the first cycle ex situ. Two samples per condition and two locations per sample were analyzed. To ensure that the beam was not damaging the sample and changing the signal, the same location on the same sample was collected twice and the response was unchanged.
C. Electrochemical characterization
Slurries were made with an 80:10:10 formulation of the active material to PVDF binder (Kynar, Arkema, Colombes, France) to Super P conductive carbon (Timcal, Imerys Graphite & Carbon, Bironico, Switzerland) in 1-methyl-2-pyrrolidone (Sigma-Aldrich) mixed in a Thinky planetary mixer. Electrodes were made by coating the slurry on 20 μm thick aluminum foil with a wet 10 mil drawdown bar, dried in an 80 °C oven overnight, and stored in the oven until ready for use. Electrodes were punched to a 12.7 mm diameter and had an active material loading of approximately 6.2 mg/cm2. Al-clad CR2032-type coin cells were assembled in an argon filled glovebox (Vacuum Atmospheres Co., Hawthorne, California) using the Li counter electrode, 3/4″ diameter 25 μm Celgard 2325 (PP/PE/PP), and 150 μL of 1 M LiPF6 1/1 (vol.) EC/EMC (BASF) electrolyte. Electrochemical testing was performed at 30 °C using Maccor 4000 series battery cyclers (MACCOR, Tulsa, Oklahoma). The samples were cycled with an initial C/20 rate followed two cycles at C/10, then C/3 cycling in a 2–4.6 V versus Li/Li+ voltage window, where the 1C current depends on the active material mass and averages 2 mA and corresponds to 1.6 mA/cm2 current density. Differential capacity measurements were conducted at a C/100 rate. Direct current resistance (DCR) is a useful tool to assess batteries for electric vehicle applications. In the DCR measurement, cells were discharged at C/20 to 50% SOC, allowed to rest one hour, and discharged at 1C for 30 s. AC impedance spectra were recorded with a Biologic VMP3 (Bio-Logic Science Instruments, Seyssinet-Pariset, France) in the 1 MHz–10 mHZ range with 10 points per decade. The cells were built in duplicate or triplicate to confirm consistency of electrochemical performance. The cells were disassembled and cleaned in dimethyl carbonate (BASF) before postmortem characterization.
III. RESULTS
A. Material characterization
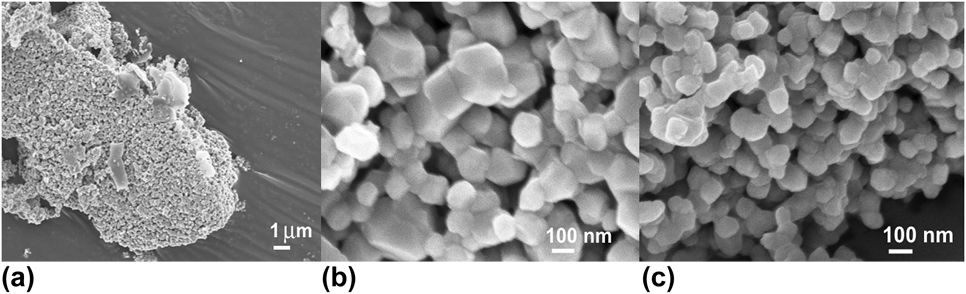
Li[Li0.2Mn0.54Ni0.13Co0.13]O2 synthesis by the co-precipitation method results in large secondary particle agglomerations as seen in Fig. 1(a), comprising primary particles that are approximately 100 nm in diameter [Fig. 1(b)]. The small primary particle size reduces the Li+ diffusion distance, facilitating lithium extraction and insertion during electrochemical cycling. The morphology and particle size did not change with Si doping [Fig. 1(c)], consistent with other reports of doped HE-NMC.Reference Qiao, Qin, Li, Wang and Gao8
SEM images of control HE-NMC at (a) 3 kX and (b) 30 kX magnifications; (c) SEM image of HENMC-Si0.05 at 30 kX.

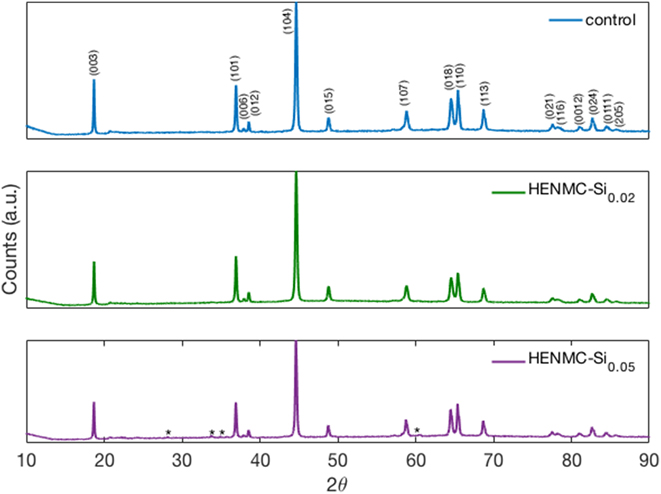
Figure 2 shows the XRD pattern of the control, HENMC-Si0.02, and HENMC-Si0.05 materials in the pristine state. All sample patterns match the α-NaFeO2 type layered structure ( $R\bar{3}m$ space group). The HENMC-Si0.05 pattern shows trace amounts of Li4SiO4, indicated with asterisks. The small reflection peaks around 2θ = 20° correspond to cation ordering in the transition metal layer in the Li2MnO3 phase, belonging to the C2/m space group.Reference Guo, Li, Zheng, Zheng, Li, Gonf and Yang27 Splitting of the (006)/(012) and (018)/(110) peaks indicate that the samples have highly ordered layered structures.Reference Santhanam, Jones, Sumana and Rambabu28,Reference Huang, Gao, Lei, Li and Su29 Table I lists the crystallographic parameters of the three HE-NMC samples obtained from Rietveld refinements of the rhombohedral phase. The a and c parameters increase by ∼0.05–0.15% as the Si doping level increases, providing larger Li+ diffusion channels and enhanced Li+ migration. This effect on lattice parameters has been reported previously in Si-doped LiNixMnyCo1−x−yO2.Reference Na, Kim and Moon26 Furthermore, the c/a ratio increases with the doping level, suggesting a more well-defined layered structure.Reference Shaju, Subba Rao and Chowdari30
XRD patterns of pristine control, 2 HENMC-Si0.02, and HENMC-Si0.05 powders, where * indicates peaks from Li4SiO4.

Crystallographic parameters of as-synthesized HE-NMC samples.

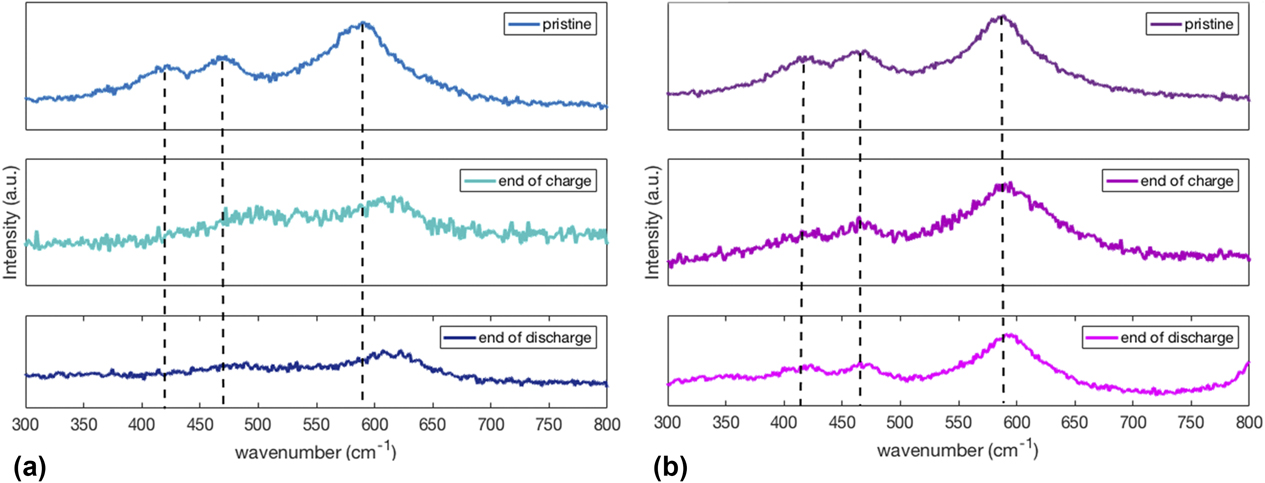
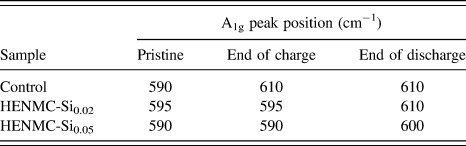
Raman spectroscopy is sensitive to small structure changes at nanoparticle surfaces, where the surface area to volume ratio is large. Figure 3(a) shows the Raman spectra of control HE-NMC in the pristine condition, at the end of the first charge, and at the end of the first discharge. The pristine sample has peaks at 420 cm−1 corresponding to Li2MnO3,Reference Julien and Massot31 470 cm−1 from Eg in plane metal–oxygen vibrations, and 590 cm−1 corresponding to the A1g transverse metal oxygen vibrations.Reference Martha, Nanda, Veith and Dudney32 By the end of the first charge, the Eg and A1g peaks have shifted to higher wavenumber and the peak from Li2MnO3 has disappeared. The shift to higher wavenumber of the metal–oxygen vibrations is indicative of spinel-like ordering.Reference Amalraj, Talianker, Markovsky, Sharon, Burlaka, Shafir, Zinigrad, Haik, Aurbach, Lampert, Schulz-Dobrick and Garsuch33 Figure 3(b) shows the Raman spectra for 5 HENMC-Si0.05 at the same three conditions. All three peak positions have been maintained throughout the first cycle. Table II includes the position of the A1g peak for samples at the three conditions. For the Si doped sample, the A1g peak position is maintained throughout the first cycle.
Raman spectra of (a) control and (b) HENMC-Si0.05 electrodes in the pristine state, after the first charge, and after the first discharge.

Raman A1g peak position evolution over the first cycle.

The changes in the Raman spectra peak positions of the pristine material are consistent with the formation of a spinel surface layer. The spectra of the Si-doped material did not change during the first cycle, indicating that it is stable. This suggests that doping suppresses the structure changes that begin during activation.
B. Electrochemical performance
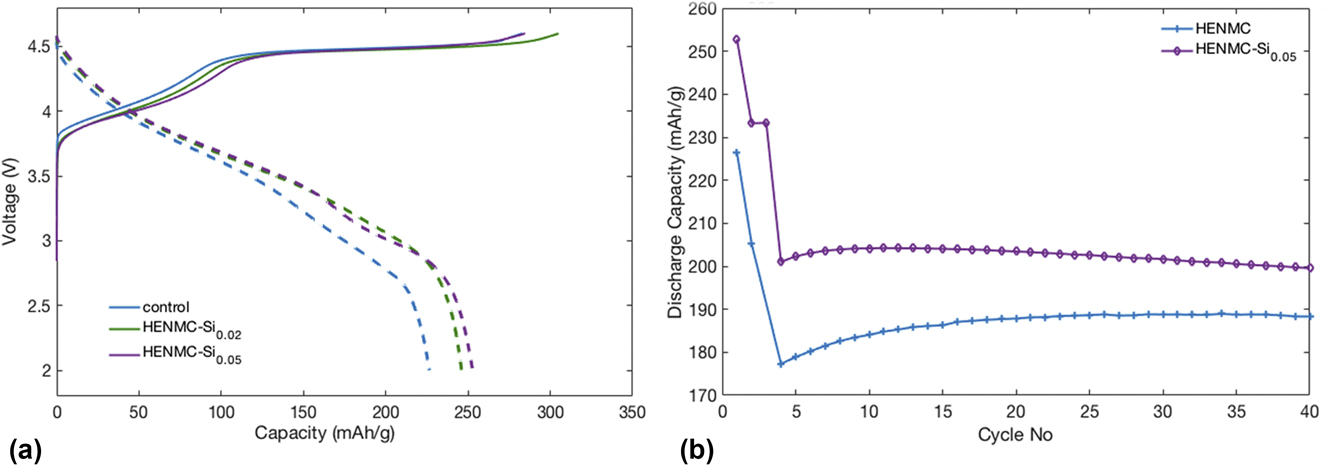
The voltage profiles from the first C/20 cycle of the control, HENMC-Si0.02, and HENMC-Si0.05 materials are presented in Fig. 4(a). The first charge profile of all samples is characterized by a large plateau around 4.5 V. The Si-doped materials have a prolonged sloping component and reach the plateau at a higher capacity than the control. The control and HENMC-Si0.05 materials have similar total first charge capacities, but with different breakdowns in the sloping and plateau regions: 101.5, 181.5 mA h/g for the control material and 116.3, 168.5 mA h/g for HENMC-Si0.05. The shorter plateau in the Si-doped material is consistent with the stability of the Raman peaks throughout the first cycle. The discharge capacity of HENMC-Si0.05 is 253 mA h/g compared to 227 mA h/g for the control. Figure 4(b) shows that the higher discharge capacity of the HENMC-Si0.05 material is maintained over 40 cycles at C/3.
(a) First cycle voltage profiles of control and Si doped HE-NMC at C/20 and (b) discharge capacity fade of control and Si doped HE-NMC.

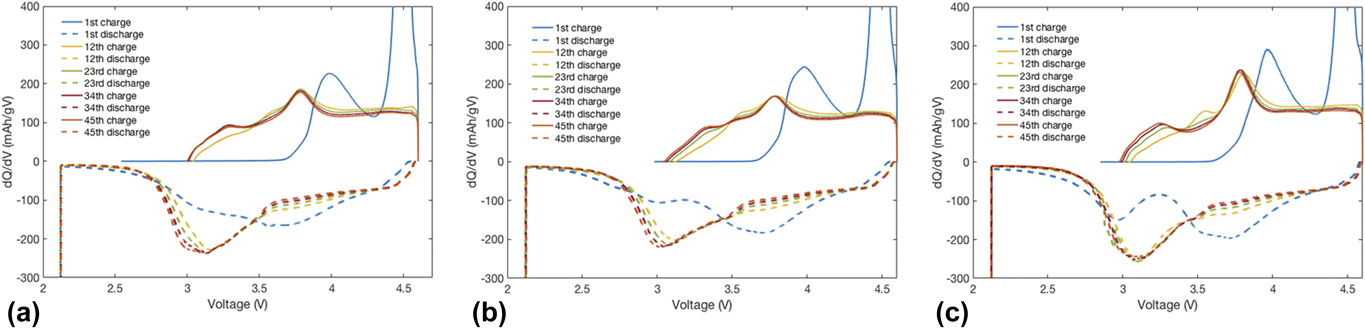
The voltage profile evolution is evident in the differential capacity plots in Fig. 5 for the 1st, 12th, 23rd, 34th, and 45th cycles. The first charge has anodic peaks from Ni2+/4+ and Co3+/4+ oxidation around 4 V and a peak at the plateau around 4.5 VReference Pham, Nam, Hwang, Kwon, Jung and Song34 due to the oxygen loss. The anodic shoulder at 3.25 V shifts to lower voltages with increasing cycle number, whereas the peaks around 3.6 V and 3.8 V shift to higher voltages with the increasing cycle number. The discharge has cathodic peaks around 3.7 V from Ni4+/2+ and Co4+/3+ reduction and a peak at 3 V from the development of a spinel-like phase.Reference Wu, Ma, Yang, Li, Allard, Liang and Chi3,Reference Pham, Nam, Hwang, Kwon, Jung and Song34 The peaks around 3.7 and 3 V shift to lower voltages, where the peak at 3 V grows with cycle number while the peak at 3.7 V shrinks. In the control material, the Mn4+/3+ reduction peaks become more intense with cycling as the Ni4+/2+ and Co4+/3+ reductions grow inactive.Reference Erickson, Schipper, Penki, Shin, Erk, Chesneau, Markovsky and Aurbach35,Reference Koga, Croguennec, Ménétrier, Mannessiez, Weill and Delmas36 The 3 V discharge peak of the Si doped HE-NMC is more stable than that of the control sample, consistent with less spinel formation.
Differential capacity plot of (a) control HENMC, (b) HENMC-Si0.02, and (c) HENMC-Si0.05 every 11th cycle.

C. Resistance measurements
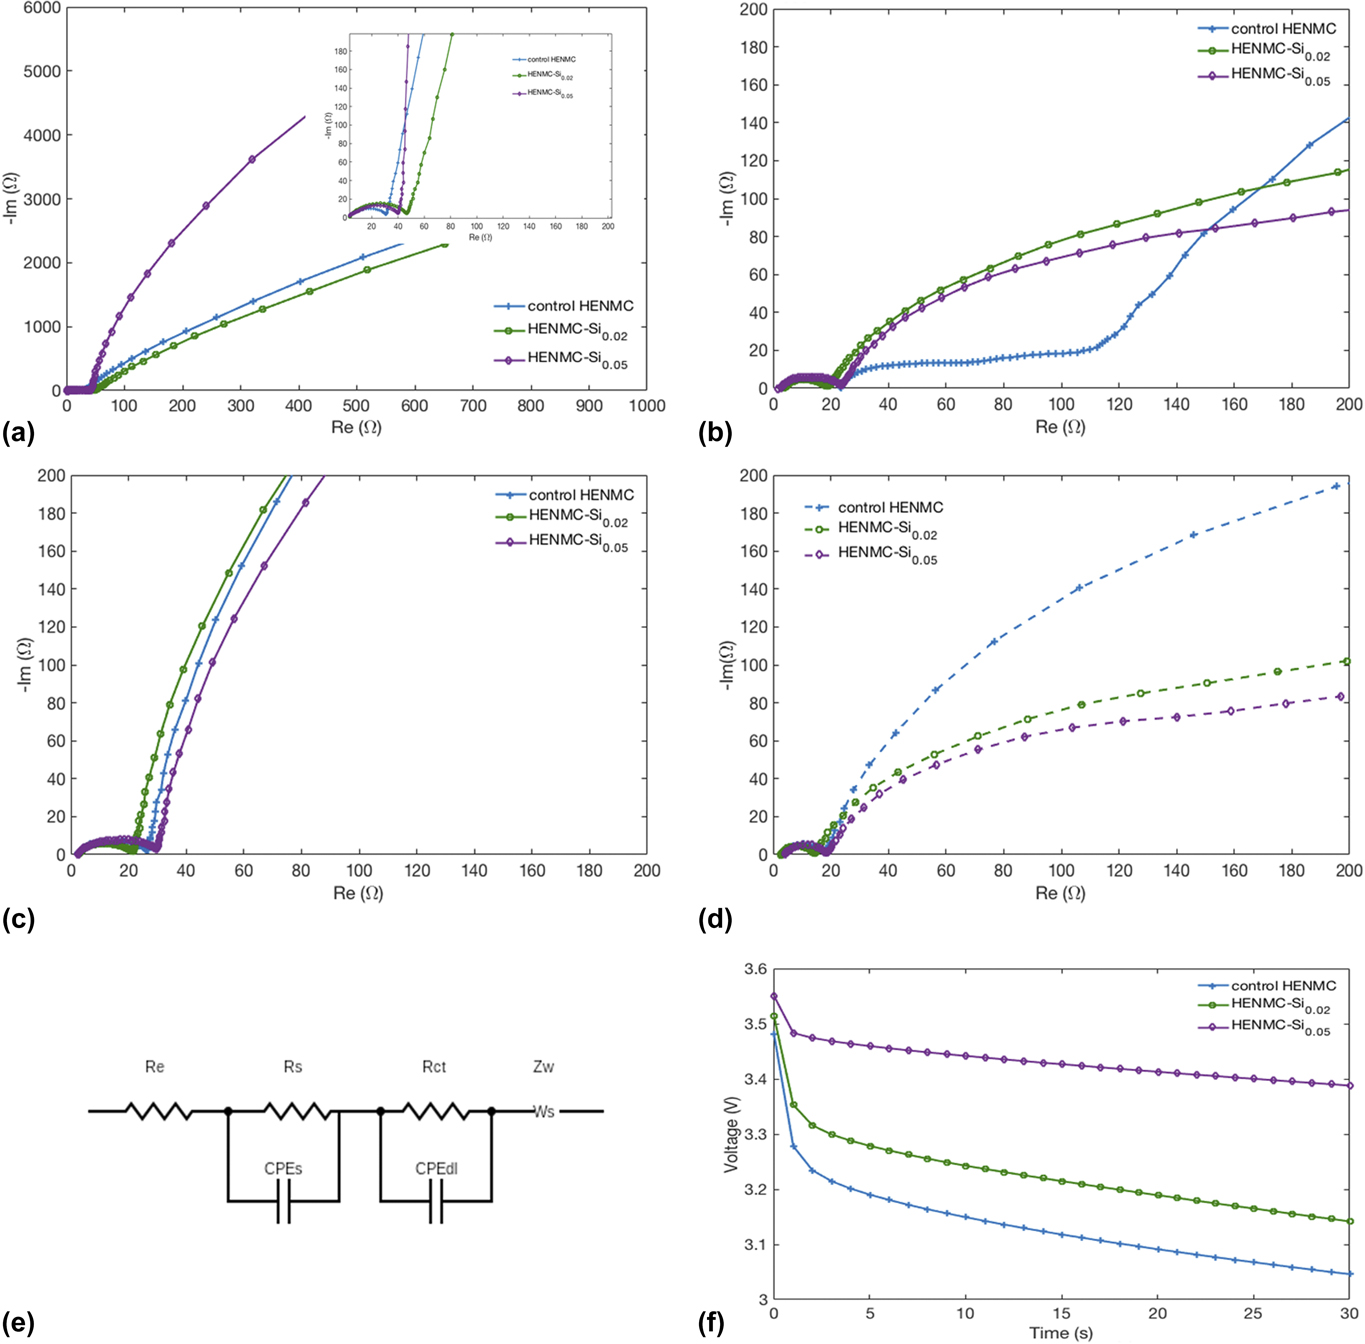
EIS measurements are used to separate contributions to the internal resistance during the cycling of lithium-rich materials. The measurements are taken at open circuit, after the first charge, and at the end of the first discharge to compare with the Raman results. Resistance measurements were repeated at the end of the second charge for cycle-to-cycle comparisons at the same SOC between the activation cycle and the subsequent cycle. Figure 6(a) shows the impedance spectra after a 12 h rest at the open circuit potential (OCP); the inset focuses on the mid and high frequency regions of interest. The high frequency x-axis intercept corresponds to the ohmic resistance. In porous battery electrodes, the high frequency arc corresponds to surface reaction contributions, and the mid frequency region is related to charge transfer resistance at the electrode–electrolyte interface. In these plots, the surface and charge transfer effects are hard to distinguish. The line in the low frequency region contains information on solid state diffusion and is referred to as the Warburg impedance. The equivalent circuit is shown in Fig. 6(e). In Fig. 6(a), the ohmic resistance is similar among all samples, and the Si containing samples have larger semicircle diameters, corresponding to higher surface and interfacial resistances. These semicircles are overlapping, thus this qualitative analysis will not attempt to separate out the contributions from surface reactions and interfacial charge transfer resistances. The impedance spectra at the end of the first charge to 4.6 V is shown in Fig. 6(b). The control sample has a significantly higher ohmic resistance relative to the Si doped samples. One possible explanation is that surface changes in the control samples lead to more oxygen release and a longer activation plateau. The released oxygen might accelerate the degradation of the electrolyte.Reference Jung, Metzger, Maglia, Stinner and Gasteiger37 Futhermore, the diameters of the semicircles are much larger for the control cells than the Si doped cells, indicating higher surface and charge transfer resistances in the control. This indicates that changes that occur during the first charge alter the surface of the control material, increasing the resistance and limiting Li+ conductivity. The lower resistance observed in the doped materials supports the Raman results which indicate that Si suppresses changes that occur near the surface. Although the A1g Raman peak of the HENMC-Si0.02 material shifts to higher wavenumber by the end of the first cycle, it is more stable than the control material at the end of the first charge, when the resistances measured by EIS increase dramatically. The reduced impedances in doped materials may derive from inhibited phase transformation, enhanced point defects and mobility, or altered SEI formation. In particular, a limited phase transformation in the doped material during the first charge is consistent with the voltage profile and Raman results. Also, HE-NMC is known to have high resistance at low states of charge,Reference Gowda, Dees, Jansen and Gallagher38,Reference Mao, Ai, Dai, Fu, Song, Lopez and Battaglia39 which is problematic for applications requiring pulse power capability. The findings in Fig. 6 suggest that Si doping lowers this resistance. In Fig. 6(c), the impedance spectra after the first discharge are similar for all samples, and this holds through the second charge [Fig. 6(d)]. This suggests that the effect of irreversible oxygen release and electrolyte degradation on the impedance is transient as it is only apparent during the first charge.
Nyquist plot of control and Si doped HE-NMC at (a) OCP, (b) the end of the first charge, (c) the end of the first discharge, and (d) the end of the second charge; (e) the equivalent circuit; (f) DCR measurement during a 30 s 1C discharge pulse at 50% SOC for control and Si doped HE-NMC.

Unlike the impedance measurements that were collected at the end of charge and discharge cycles, DCR was collected using 1C pulses at 50% SOC during the first discharge to provide information for automotive applications. Figure 6(f) shows the voltage response during the 30 s pulse for the control HENMC, HENMC-Si0.02, and HENMC-Si0.05 samples. The voltage drop has two regimes; the first regime is the ohmic drop and occurs in the first second of the pulse step. The second regime corresponds to diffusion resistance.Reference Hoon Kim, Jun Lee, Moon Lee and Hyung Cho40 The ohmic drop decreases with increased doping levels, which is consistent with the EIS findings.
IV. ANALYSIS AND DISCUSSION
The experiments demonstrate that Si doping alters the electrochemical performance of HE-NMC electrode materials. To obtain basic insight into the impact of Si doping on these materials, the Li-excess Li2MnO3 phase is further studied as a model system since this component of the HE-NMC is likely be related to the increased capacity observed in the experiments. Plane wave density functional theory (DFT) calculations were performed with similar settings in our previous studies.Reference James, Wu, Sheldon and Qi41 A 2 × 1 × 2 supercell (96 atoms for perfect Li2MnO3) was used to ensure dilute concentrations of the dopant or oxygen vacancy. All cell parameters were fully relaxed to keep the stress below 100 MPa.
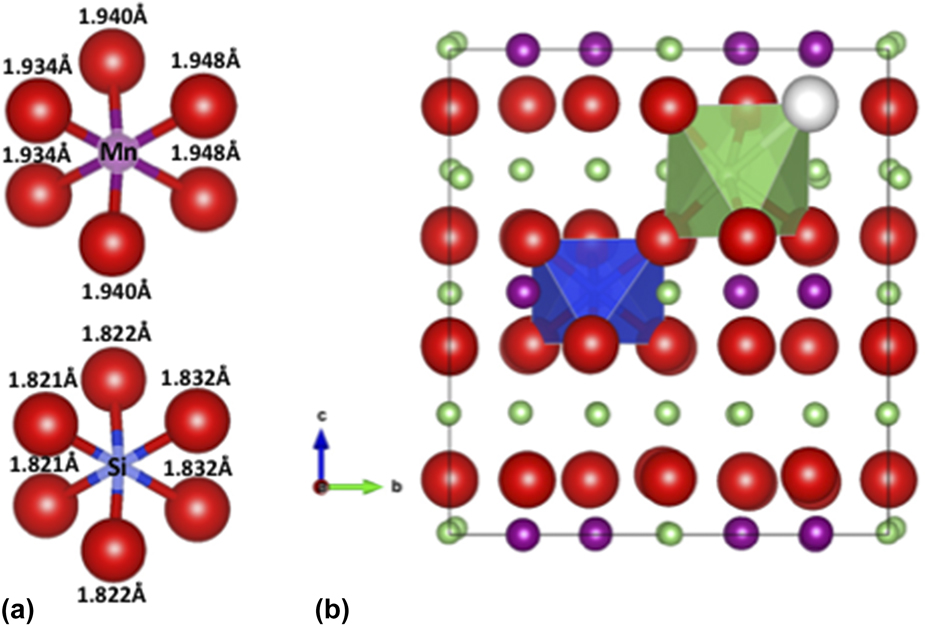
With one Si substituted for Mn, the concentration is Li2Mn0.94Si0.06O3. In a perfect Li2MnO3 lattice, the Mn is in the center of an oxygen-octahedral site. However, Si generally prefers tetrahedral coordination (e.g., in SiO2 and Li4SiO4), therefore its energy at a tetrahedral site is also computed. This tetrahedral site substitution quickly relaxed back to the octahedral site, which confirms that this substitution is preferred. Figure 7(a) shows the relaxed Si–O octahedron in comparison with the Mn–O octahedron in perfect Li2MnO3. The Si–O bonds are shorter than the Mn–O bonds, which is consistent with the smaller Si ionic radii. The lattice parameters (listed in Table I) are therefore reduced compared to the undoped structure. This seems to contradict the increased lattice parameters observed with Si doping. However, Si incorporation can also impact lithium and oxygen vacancy generation, due to defect coupling.
(a) The Mn–O and Si–O bond lengths in the Mn–O and Si–O octahedra and (b) the fully relaxed structure of Si-doped Li2MnO3. The green is Li, red is O, blue is Si, magenta is Mn, and white is the oxygen vacancy.

Oxygen vacancies are widely believed to play a role in HE-NMC activation. Thus, the impact of Si doping on all possible oxygen vacancy sites was evaluated. The calculations show that the lowest energy oxygen vacancy site is in another layer, connecting to the Si via Si–O–Li–O bonding, as shown in Fig. 7(b). In this environment, the oxygen vacancy formation energy is sensitive to the dopant and the strain in the lattice. For example, with a constant volume approach, the oxygen vacancy formation energy is reduced from 2.09 to 2.04 eV (i.e., by 0.05 eV due to Si doping). Without the Si dopant, just expanding the volume by 0.1% reduces the vacancy formation energy from 2.09 to 2.03 eV. Similar trends have been seen in Li2MnO3Reference James, Wu, Sheldon and Qi42 and other oxidesReference Das, Nicholas, Sheldon and Qi43 due to the volume expansion induced by oxygen vacancy generation. The super cell with one Si dopant and one oxygen vacancy (Li2Mn0.94Si0.06O3−0.06) has a larger volume than the perfect Li2MnO3, as shown in Table I. Based on this result, an increased oxygen vacancy concentration in the Si-doped HE-NMC is a likely cause of the increased lattice parameter observed in the experiments.
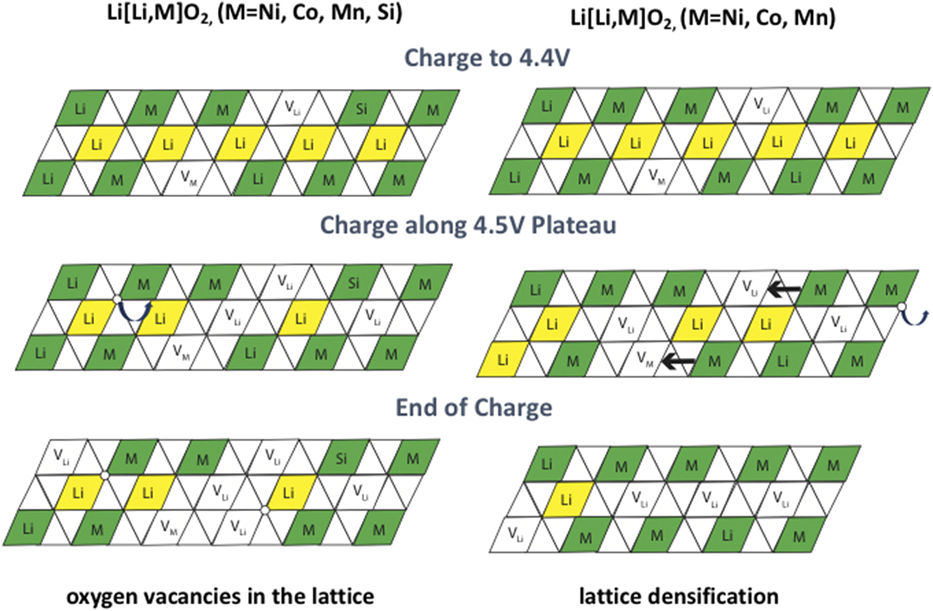
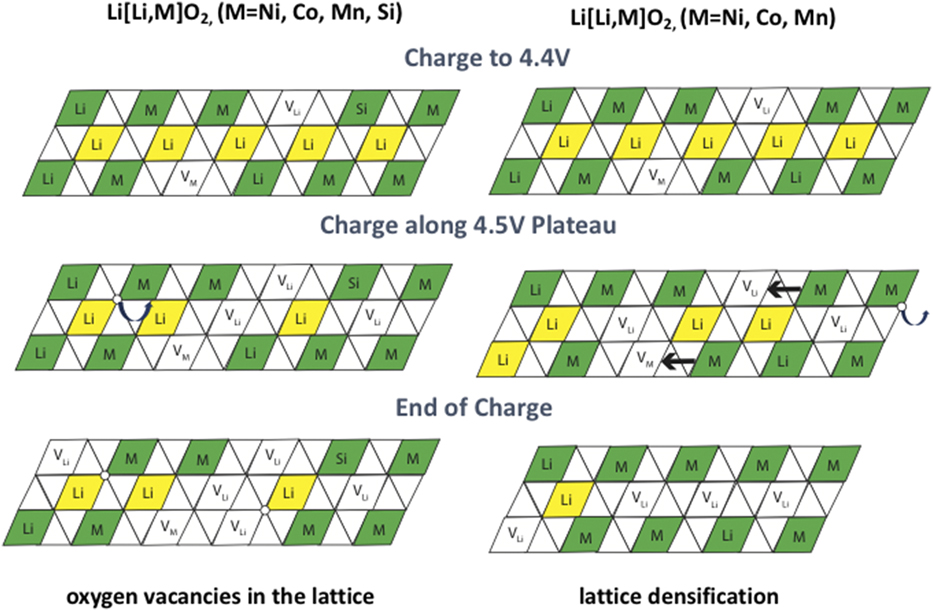
Oxygen vacancies will also reduce the lithium vacancy formation energy. This should then increase the Li storage capacity at a given cutoff voltage, which provides a possible explanation for the observed impact of Si doping on HE-NMC capacity. In Fig. 4(a), to obtain the amount of charge capacity, the Si-doped samples require less activation energy, as the length of the activation plateau is 13 mA h/g shorter; in the following discharge cycle, the Si-doped samples show ∼10% increased capacity. Figure 8 shows a model for a possible explanation of the increased capacity of Si doped HE-NMC. In both materials, initial charging to 4.4 V oxidizes the transition metal ions and creates lithium and transition metal vacancies in the material. Along the first charge plateau, lithium is extracted by creating oxygen vacancies. At this point, the materials behave differently, as silicon affects the oxygen vacancy behavior. In the Si-doped material (left), the oxygen vacancies hop around according to diffusion effects but stay in the bulk. In the control material (right), the oxygen vacancies created at the surface are removed from the structure and the transition metal ions migrate to the bulk. By the end of the charge, the Si-doped material has oxygen vacancies embedded within the lattice leading to the increased discharge capacity in the doped sample. At the end of the first charge in the control material, the migration of the transition metals and removal of oxygen vacancies from the surface lead to lattice densification.
Model of first charge mechanisms for Si-doped (left) and control (right) HE-NMC.
While the DFT calculations above describe expected changes to the bulk HE-NMC material, the Raman spectra also suggest that Si additions alter changes that occur near surfaces. These results suggest doping may suppress the formation of a surface damage layer (SDL). The initial DFT calculations above do not address this directly. However, the SDL formation could be related to the changes in Li and O vacancy concentrations that are predicted with DFT. It is possible that because of the initial oxygen vacancies introduced by Si-doping, the material is exposed to higher voltages for a shorter time, as shown in Fig. 4(a). This may limit the extent of degradation mechanisms such as transition metal diffusion into the Li-layer, phase transformation, and electrolyte degradation. It is also possible that local strain effects due to doping can alter the phase transformation energetics. Additional experiments and modeling are needed to investigate these possibilities.
V. CONCLUSIONS
HE-NMC can be successfully doped with Si using a co-precipitation synthesis method. At x = 0.05 Si, trace amounts of a second phase were visible in XRD, whereas at lower doping levels, the material appeared single phase. Because Si is generally not lithium active, a lower initial capacity of the doped material was expected. However, the Si doped material showed increased capacity, with HENMC-Si0.05 exhibiting a 10% higher discharge capacity relative to the control. Raman spectroscopy indicates that Si doping mitigates structural changes during the first cycle. EIS measurements agree that the impedance is significantly lower in the Si doped samples after activation. This suggests that the impedance rise stems from structural rearrangements that occur with oxygen evolution, as the control material undergoes more oxygen loss. The DCR measurements at 50% SOC support this finding. The lower resistance of Si doped materials is also consistent with the lower overpotential in the first charge voltage profile, where the control sample has the highest resistance and reaches the activation plateau first.
The larger lattice parameters and lower electrochemical impedance associated with Si doping may have contributed to the increased capacity through easier lithium extraction. Si doping is also likely to change the site energy to suppress Mn–O octahedral collapse and lead to less local structural change during activation. In summary, this work shows Si doping increases the capacity of HE-NMC. While significant capacity fade still occurs, the unexpected benefits of Si incorporation highlight the fact that chemical modifications can be used to help achieve the potential of this high energy cathode material.
ACKNOWLEDGMENTS
We gratefully acknowledge support from National Science Foundation under Grant Nos. DMR-1410850 and 1410946 for the collaborative GOALI research. We also thank Tengjiao Qi, Michael Balogh, and Nicholas Pieczonka for their assistance with the experiments and Jung-Hyun Kim for helpful discussions.