INTRODUCTION
Cetaceans, including bottlenose dolphins (Tursiops truncatus), live in complex habitats with a dynamic regime of physical and chemical properties (Bräger et al., Reference Bräger, Harraway and Manly2003). The relationship between coastal bottlenose dolphins and their habitat differs largely among regions. Some coastal populations were shown to perform seasonal movements from deeper channels to shallow waters (e.g. Waples, Reference Waples1995), whereas others indicated preferences for estuarine habitats (e.g. Shane, Reference Shane, Leatherwood and Reevers1990; Ballance, Reference Ballance1992; Hanson & Defran, Reference Hanson and Defran1993; Scott et al., Reference Scott, Wells and Irvine1996). Other studies indicated a high correlation between dolphin occurrence and water depth, often with a preference for shallow waters (e.g. Cañadas et al., Reference Cañadas, Sagarminaga and García-Tiscar2002; Bearzi, Reference Bearzi2005; Blasi & Boitani, Reference Blasi and Boitani2012). An increased use of steep slopes has also been documented, suggested to facilitate the dolphins’ feeding activities (Ingram & Rogan, Reference Ingram and Rogan2002; Cañadas et al., Reference Cañadas, Sagarminaga, de Stephanis, Urquiola and Hammond2005). Overall, most studies indicated habitat use of bottlenose dolphins is mainly driven by prey distribution and abundance, sometimes in combination with predation risk (e.g. Shane, Reference Shane, Leatherwood and Reevers1990; Ballance, Reference Ballance1992; Hanson & Defran, Reference Hanson and Defran1993; Waples, Reference Waples1995; Scott et al., Reference Scott, Wells and Irvine1996).
To date, only one study has assessed bottlenose dolphin habitat use in Argentina (Würsig & Würsig, Reference Würsig and Würsig1979). According to the authors, bottlenose dolphin movements in Golfo San José were related to the tide. Dolphins seemed to stay in shallower water as the tide retreated, until they needed to go to deeper waters when the tide was too low. Another community of bottlenose dolphins is known to range further up north, with a core area in Bahía San Antonio (BSA) (Vermeulen & Cammareri, Reference Vermeulen and Cammareri2009; Vermeulen et al., Reference Vermeulen, Balbiano, Beleguer, Colombil, Failla, Intrieri and Bräger2016). This population was reported to be small and declining (Vermeulen & Bräger, Reference Vermeulen and Bräger2015).
In general, BSA is of great ecological value due to its high biodiversity, not only harbouring a community of resident bottlenose dolphins (Vermeulen et al., Reference Vermeulen, Balbiano, Beleguer, Colombil, Failla, Intrieri and Bräger2016) but also being an important spawning and nursing area for many fish species (Perier, Reference Perier1994), and one of the most important resting and feeding sites of the South-western Atlantic Ocean for several migratory bird species (González et al., Reference González, Piersma and Verkuil1996). However, although the area was declared a ‘Natural Reserve’ in Argentina by provincial law 2670 of June 1993, the area is still designated for ‘multiple use’ and includes one of the largest ports of Argentina, a chemical plant producing sodium carbonate, as well as artisanal and recreational fishing activities, and whale- and dolphin-watching activities (Giaccardi & Reyes, Reference Giaccardi and Reyes2012). Additionally, BSA is the most important touristic destination along the coast of North-east Patagonia, with three expanding towns under the municipality of San Antonio: (1) San Antonio Oeste, (2) San Antonio Este and (3) Las Grutas.
In general, various authors have stated that the rapid demographic and industrial growth along the Patagonian coast is resulting in increased pressures on the natural resources (Peralta, Reference Peralta1998; Boltovskoy, Reference Boltovskoy2009; González & Benseny, Reference González, Benseny and Benseny2013). In view of this, the present study aims to investigate the habitat use patterns of the local declining bottlenose dolphin population in BSA. As the area is known for its large tidal amplitude and extended intertidal zone, special focus was placed on the dolphins’ intertidal vs subtidal habitat use. The information presented here is believed to be highly valuable for understanding the ecological needs of this population of dolphins, and essential for improved conservation management in the area in times of increased coastal urban and industrial developments.
MATERIALS AND METHODS
Study area
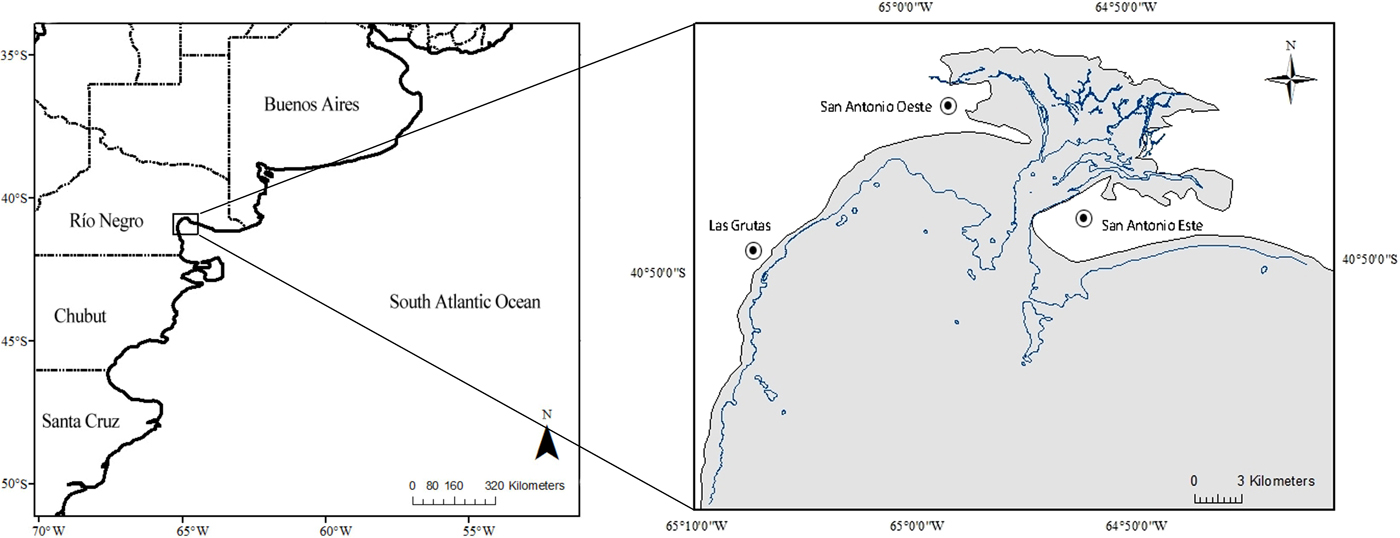
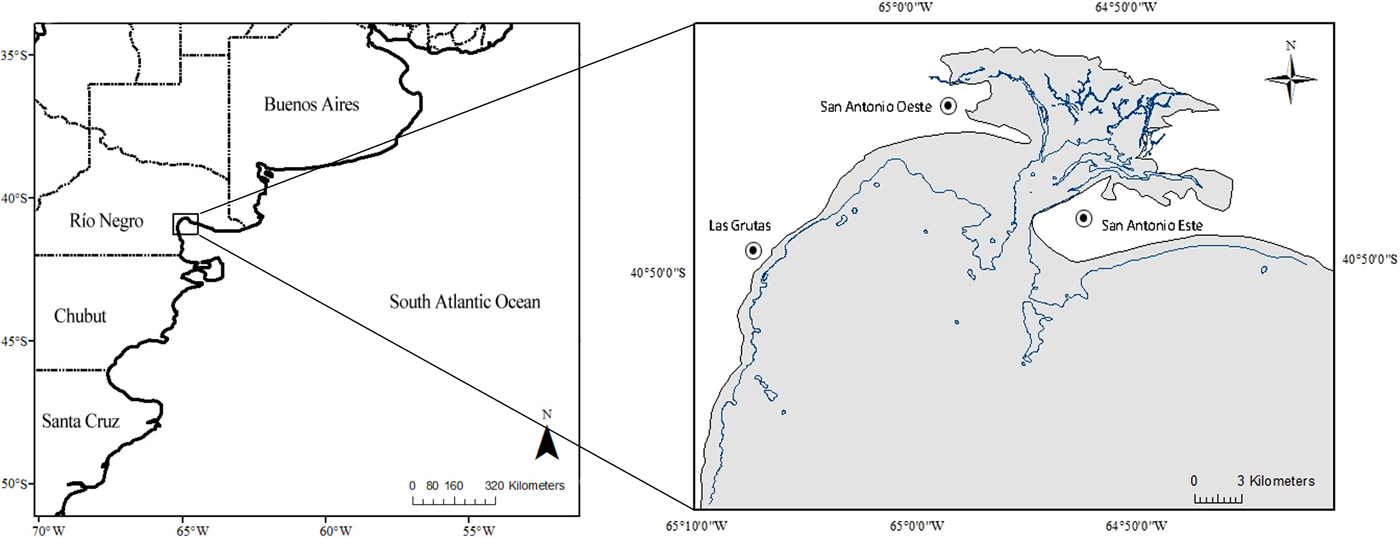
The study area, Bahía San Antonio (BSA, 40°45′S 64°54′W; Figure 1) is a shallow bay with a length of 20 km in the east–west direction, a width of 10 km north–south, an average depth of 6 m and a maximum depth not exceeding 30 m (SHN, 2000). With a surface area of ~655 km2, the bay is known for its large tidal differences (Perier, Reference Perier1994; SHN, 2000). The tidal regime is semidiurnal and the tidal amplitude varies between 6.5 m at neap and 9.3 m at spring tide (average ± 8.3 m), leaving up to 86% of the total surface of the bay exposed during low tide (Perier, Reference Perier1994; SHN, 2000). The region is characterized by different types of intertidal habitat, with sandy beaches and rocky flats (up to 800 m wide) covering the majority of the area (González et al., Reference González, Piersma and Verkuil1996).
Left: Map of Argentina indicating the location of the study area, Bahía San Antonio (BSA). Provinces are also indicated. Right: Map of BSA indicating the three urbanized areas. Contour line of the bay indicates the shoreline at high tide, the isobath indicates the shoreline at low tide.
Fieldwork
Between August 2008 and December 2011, boat-based surveys were conducted from a small outboard-powered inflatable boat. All survey effort was restricted to calm seas of Beaufort state ≤3, periods of no precipitation and good visibility. During each survey, the boat was maintained at a steady speed of 4–5 knots. This slow speed was possible due to the environmental conditions in the area (lack of a large swell, often flat sea conditions) and the relatively small size of the study area; i.e. it improved the chances to spot dolphins while having enough time to sample large portions of the study area. During the surveys, the same 2–3 observers maintained a continuous visual search for dolphins. Due to logistical limitations, the course of the survey could not be standardized; the area was surveyed non-systematically until a dolphin group was found. Effort was logged using the automatic tracking system of a hand-held Geographical Positioning System (GPS) Garmin Etrex and GPSmap 62s.
Once a bottlenose dolphin group was encountered, the speed of the vessel was changed to match the pace of the group. A bottlenose dolphin group was defined as a collection of dolphins within a 100 m radius of each other that operated in a coordinated way (Lusseau et al., Reference Lusseau, Schneider, Boisseau, Haase, Slooten and Dawson2003), interacting or engaged in similar activities (Irvine et al., Reference Irvine, Scott, Wells and Kaufmann1981; Wells et al., Reference Wells, Scott, Irvine and Genoways1987; Wilson, Reference Wilson1995; Connor et al., Reference Connor, Wells, Mann, Read, Mann, Connor, Tyack and Whitehead2000; Lusseau et al., Reference Lusseau, Slooten and Currey2006). Once a bottlenose dolphin group was encountered, group composition was determined; groups were classified as either ‘groups with calves’ or ‘groups without calves’. Calves were defined as being up to 2/3 the length of an adult, with or without foetal folds (Mann & Smuts, Reference Mann and Smuts1999) and commonly swimming in close association with an adult (Shane, Reference Shane, Leatherwood and Reevers1990). A dolphin group was followed until it was out of sight. When a dolphin group split up, a sub-group was arbitrarily chosen and followed based on a variety of factors such as e.g. direction of travel, weather conditions, presence of interesting individuals (e.g. a newborn calf), etc.
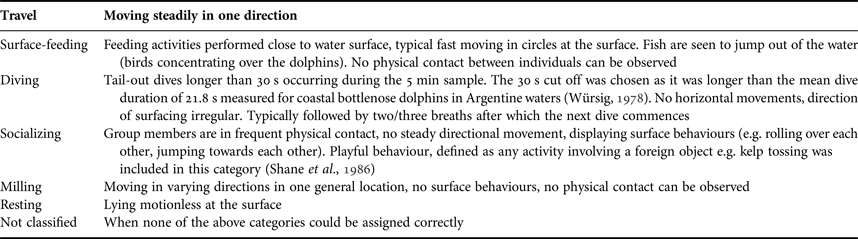
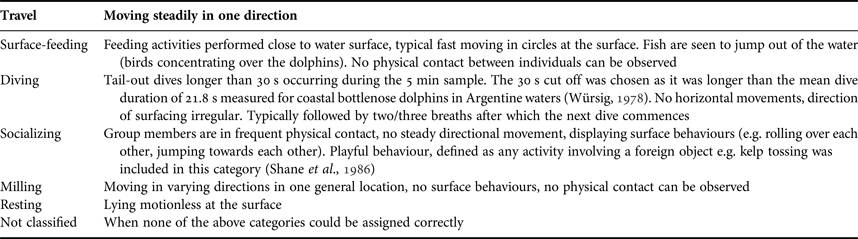
Data on the behaviour of dolphin groups were gathered using a focal group 5-min point sampling mode (Altmann, Reference Altmann1974; Mann, Reference Mann1999). For each sample, the predominant activity of the majority of the group (>50%) was recorded. The behavioural categories used are summarized in Table 1. Along with behavioural data, in situ GPS positions and depths (when an echo-sounder was available) were recorded every 5 min in the presence of dolphins using a hand-held GPS Garmin Etrex and GPSmap 62s, and the vessel's echo-sounder respectively.
Definitions of behavioural categories used in this study (adapted from Shane, Reference Shane, Leatherwood and Reevers1990; Bearzi et al., Reference Bearzi, Politi and Notarbartolo di Sciara1999; Bearzi, Reference Bearzi2005).
Analyses
ESRI ArcGIS version 10.1 was used to subdivide the study area into grid cells of 1 km2 (1 km × 1 km). Due to the relative homogeneity in the area this was believed to give sufficient detail for this study. Cells with a total survey effort lower than a cell's diagonal (1414 m) were excluded from analysis. WGS 1984 UTM zone 20S was used as the projected coordinate system.
Subsequently, each cell was attributed a value of three environmental variables: depth, slope and substrate. The mean depth (hereafter MD) and substrate type were extracted from an electronic bathymetric chart obtained from the Naval Hydrographical Service of Argentina.
(1) Depth: The MD value for each cell was obtained by averaging the MD values marked on the chart within each cell (Cañadas et al., Reference Cañadas, Sagarminaga and García-Tiscar2002). The MD value reflects a depth range ±4.15 m depending on tide (considering the mean tidal amplitude of 8.3 m in the study area). Therefore, the intertidal zone was defined as all cells with a MD < 4 m, whereas cells with MD ≥ 4 m were defined as the subtidal zone. Additionally, exact depth measurements recorded in the field were analysed to assess exact depths at which dolphins were encountered. Due to logistical limitations this could only be done for 41 dolphin groups. In order to check for the reliability of MD data, a Pearson's correlation coefficient was calculated between MD and the measured depth values in the corresponding grid cells.
(2) Slope: Slope, expressed in degrees, was calculated as (D max − D min)/DI where D max is the maximum depth of the cell, D min is the minimum depth of the cell and DI the distance between the points of maximum and minimum depth of the cell (Cañadas et al., Reference Cañadas, Sagarminaga and García-Tiscar2002; Garaffo et al., Reference Garaffo, Dans, Pedraza, Crespo and Degrati2007).
(3) Substrate: Substrate type (sand, rocky flats, gravel or shells) was attributed to each cell according to the substrate most commonly found in each cell.
To test whether variables in the cells were spatially auto-correlated, and thus not independent, Moran's I index was calculated for the encounter rate of dolphin groups using the Spatial Statistics Tool in ArcGIS. To correct for the potential bias of non-systematic surveys, an encounter rate of dolphin groups was calculated as n/L where n is the number of dolphin groups encountered in each grid cell (i.e. first sighting of each dolphin group) and L the total number of kilometres spent on effort in each cell (Bearzi, Reference Bearzi2005; Bearzi et al., Reference Bearzi, Azzellino, Politi, Costa and Bastianini2008). To investigate any temporal variation in the encounter rate, Kruskal–Wallis and Mann–Whitney U tests were used to test for differences between survey years, seasons and tidal state. For analysis, each survey year was divided into four seasons: summer (January–March), autumn (April–June), winter (July–September), spring (October–December). High tide was defined as a 3 h period including the hour of high tide plus the hour prior and subsequent to it. Accordingly the other tidal phases were defined as follows: low tide is the hour of low tide and the hour prior and subsequent, ebb tide is a 3 h time period between high and low tide and flood tide is a 3 h time period between low and high tide.
The influence of the environmental variables MD, slope and substrate on the encounter rate of dolphin groups was investigated using a Generalized Linear Model (GLM) in the program R (R core team, 2016). The number of dolphin groups encountered in each grid cell was set as the response variable with effort in each grid cell (number of km surveyed) as an offset. Given the characteristics of the response variable (counts of dolphin groups), the Poisson distribution and the log-link function were used. Stepwise model selection was performed and the AIC (Akaike Information Criterion) was used as a selection criterion for the best model. A quasi-Poisson GLM model was used to check for over-dispersion of the data (dispersion parameter ϕ > 1), whereas model validation was achieved by examining the plotted scaled Pearson residuals, and examining the mean-variance relationship and (non-)independence of model residuals.
Considering the large tidal amplitude in the study area, a second GLM was used to investigate the influence of the environmental variables MD, slope and substrate on the encounter rate of dolphin groups only during high tide (as it was the only time when both intertidal and subtidal zones were simultaneously available). For this, the number of dolphin groups encountered during high tide was set as the response variable with effort during high tide (number of km surveyed during high tide) as an offset. Model construction, selection and validation was done in the same way as described above.
Further analysis was conducted to verify if the environmental variables (MD, slope and substrate) varied with group composition (groups with calves vs groups without calves) and behaviour. To account for non-independence of 5-min behavioural samples, only the first behavioural sample of each group was used in analysis. Kruskal–Wallis and Mann–Whitney U tests were employed to assess whether different group compositions and behaviours were observed in areas with different MD and slopes. A χ2 of independence was used to test whether different group compositions and behaviours were observed in areas with different types of substrate. In order to investigate the difference in behaviour observed in the intertidal vs subtidal zone, a contingency table was created for the initial behaviour observed for each dolphin group, considering only those groups observed during high tide (when both intertidal and subtidal areas were available simultaneously). A Pearson's χ2 test was then used as the test statistic.
RESULTS
Effort
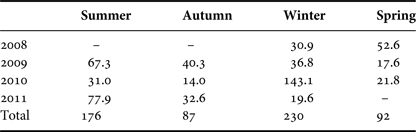
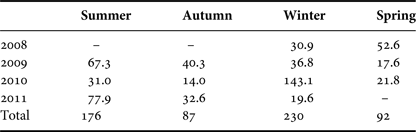
A total of 129 non-systematic boat-based surveys were conducted between 2008 and 2011, resulting in 586 h of survey effort during which 155 dolphin groups (DG) were observed (Table 2).
Hours of boat-based survey effort over the different seasons.
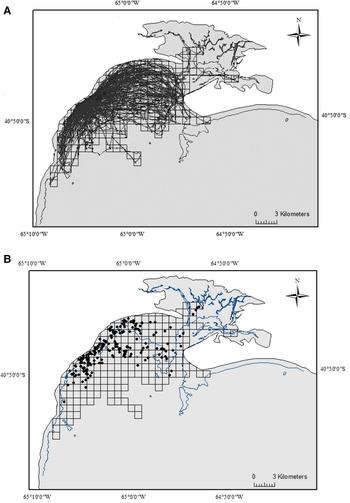
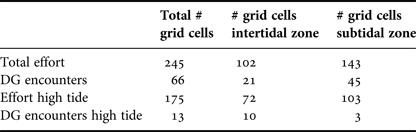
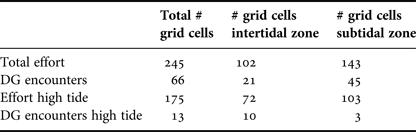
In total, 245 grid cells were used in analysis (or 233 km2 excluding surface of grids overlapping land; Figure 2A). Of these grid cells, 102 were located in the intertidal zone whereas the other 143 were located in the subtidal region. Bottlenose dolphin groups were initially sighted in 66 of these grid cells (Figure 2B) and were followed over a total of 127 grid cells or 121 km2 (51% of surveyed area). Of these 66 grid cells, 21 were in the intertidal zone whereas the other 45 were located in the subtidal zone.
(A) Survey effort tracks in Bahía San Antonio, indicating the 245 grid cells covered. (B) Geographic positions of initial sightings of 155 bottlenose dolphin groups within 66 of the surveyed grid cells. Contour line delineates the intertidal area.

Survey effort during high tide only (61 surveys) covered a total of 175 grid cells, of which 72 and 103 were located in the intertidal and subtidal zone respectively. During these surveys, 28 dolphin groups were encountered in 13 grid cells, of which 10 were located in the intertidal zone and 3 in the subtidal region. Table 3 provides an overview.
The number of grid cells covered by the survey effort and dolphin groups (DG) encounters.
Encounter rate
The median encounter rate was 0.02 or two dolphin groups encountered every 100 km surveyed (average = 0.01; quantile values Q1 = 1.3; Q3 = 2.8). Moran's I index calculated for the encounter rates was not significantly different from zero (z = 0.12; P > 0.05) indicating that cells were not spatially auto-correlated. No significant variations in encounter rate were found across the different study years (H = 3.2, P = 0.36), seasons (H = 4.13; P = 0.24) or tidal states (H = 0.46, P = 0.93).
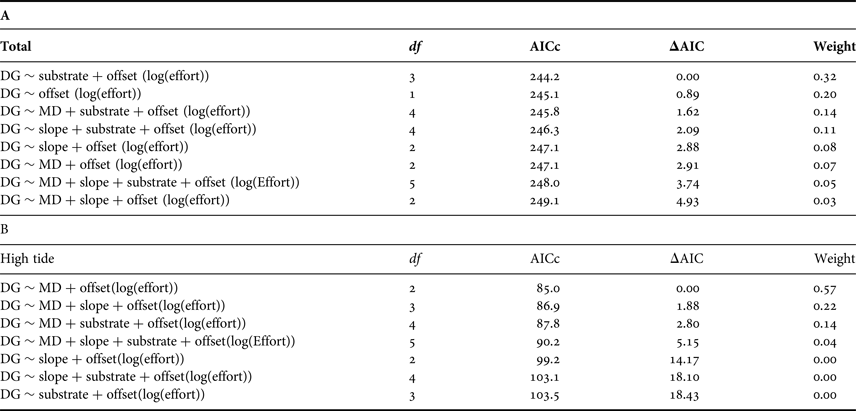
Data were not over-dispersed (dispersion parameter ϕ = 0.54). The best fitting model of the Poisson GLM analysis indicated an importance of the variable substrate on the overall dolphin encounter rate (Table 4A). As such, dolphins were encountered more often over sandy substrates. However, AIC values did not differ greatly when removing all variables from the model, suggesting a relatively low influence of any environmental variable on the overall dolphin encounter rate. On the other hand, the GLM analysis of the data collected during high tide showed an importance of MD on the dolphin encounter rate (Table 4B). As such, models excluding MD had substantially larger AIC values. Model validation was performed in both GLM analyses and indicated the models were deemed appropriate.
Ranked Generalized Linear Models assessing the relationship between the environmental variables MD, slope and substrate on the encounter rate of dolphin groups (DG)
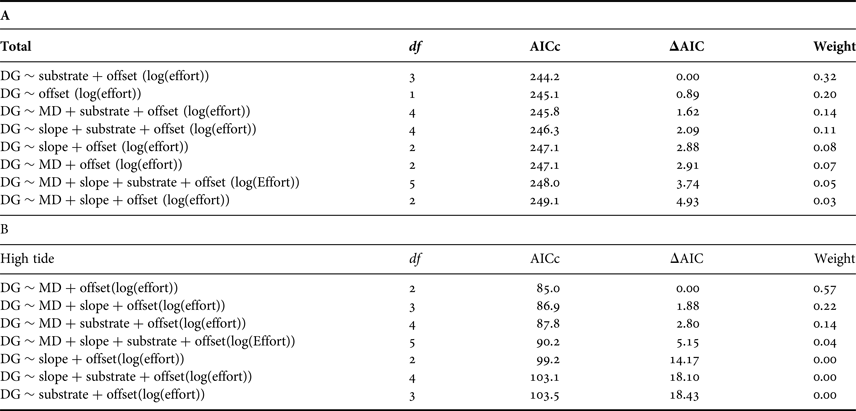
Parameters include: degrees of freedom (df), Akaike Information Criterion (AIC), delta Akaike Information Criterion (ΔAIC) and Weight.
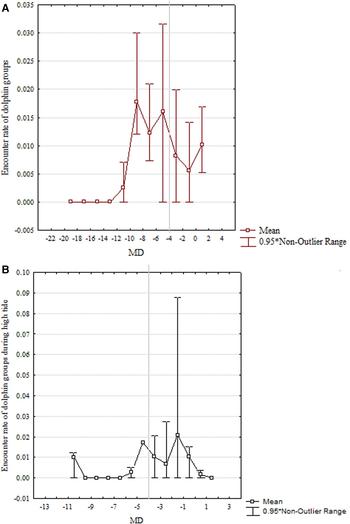
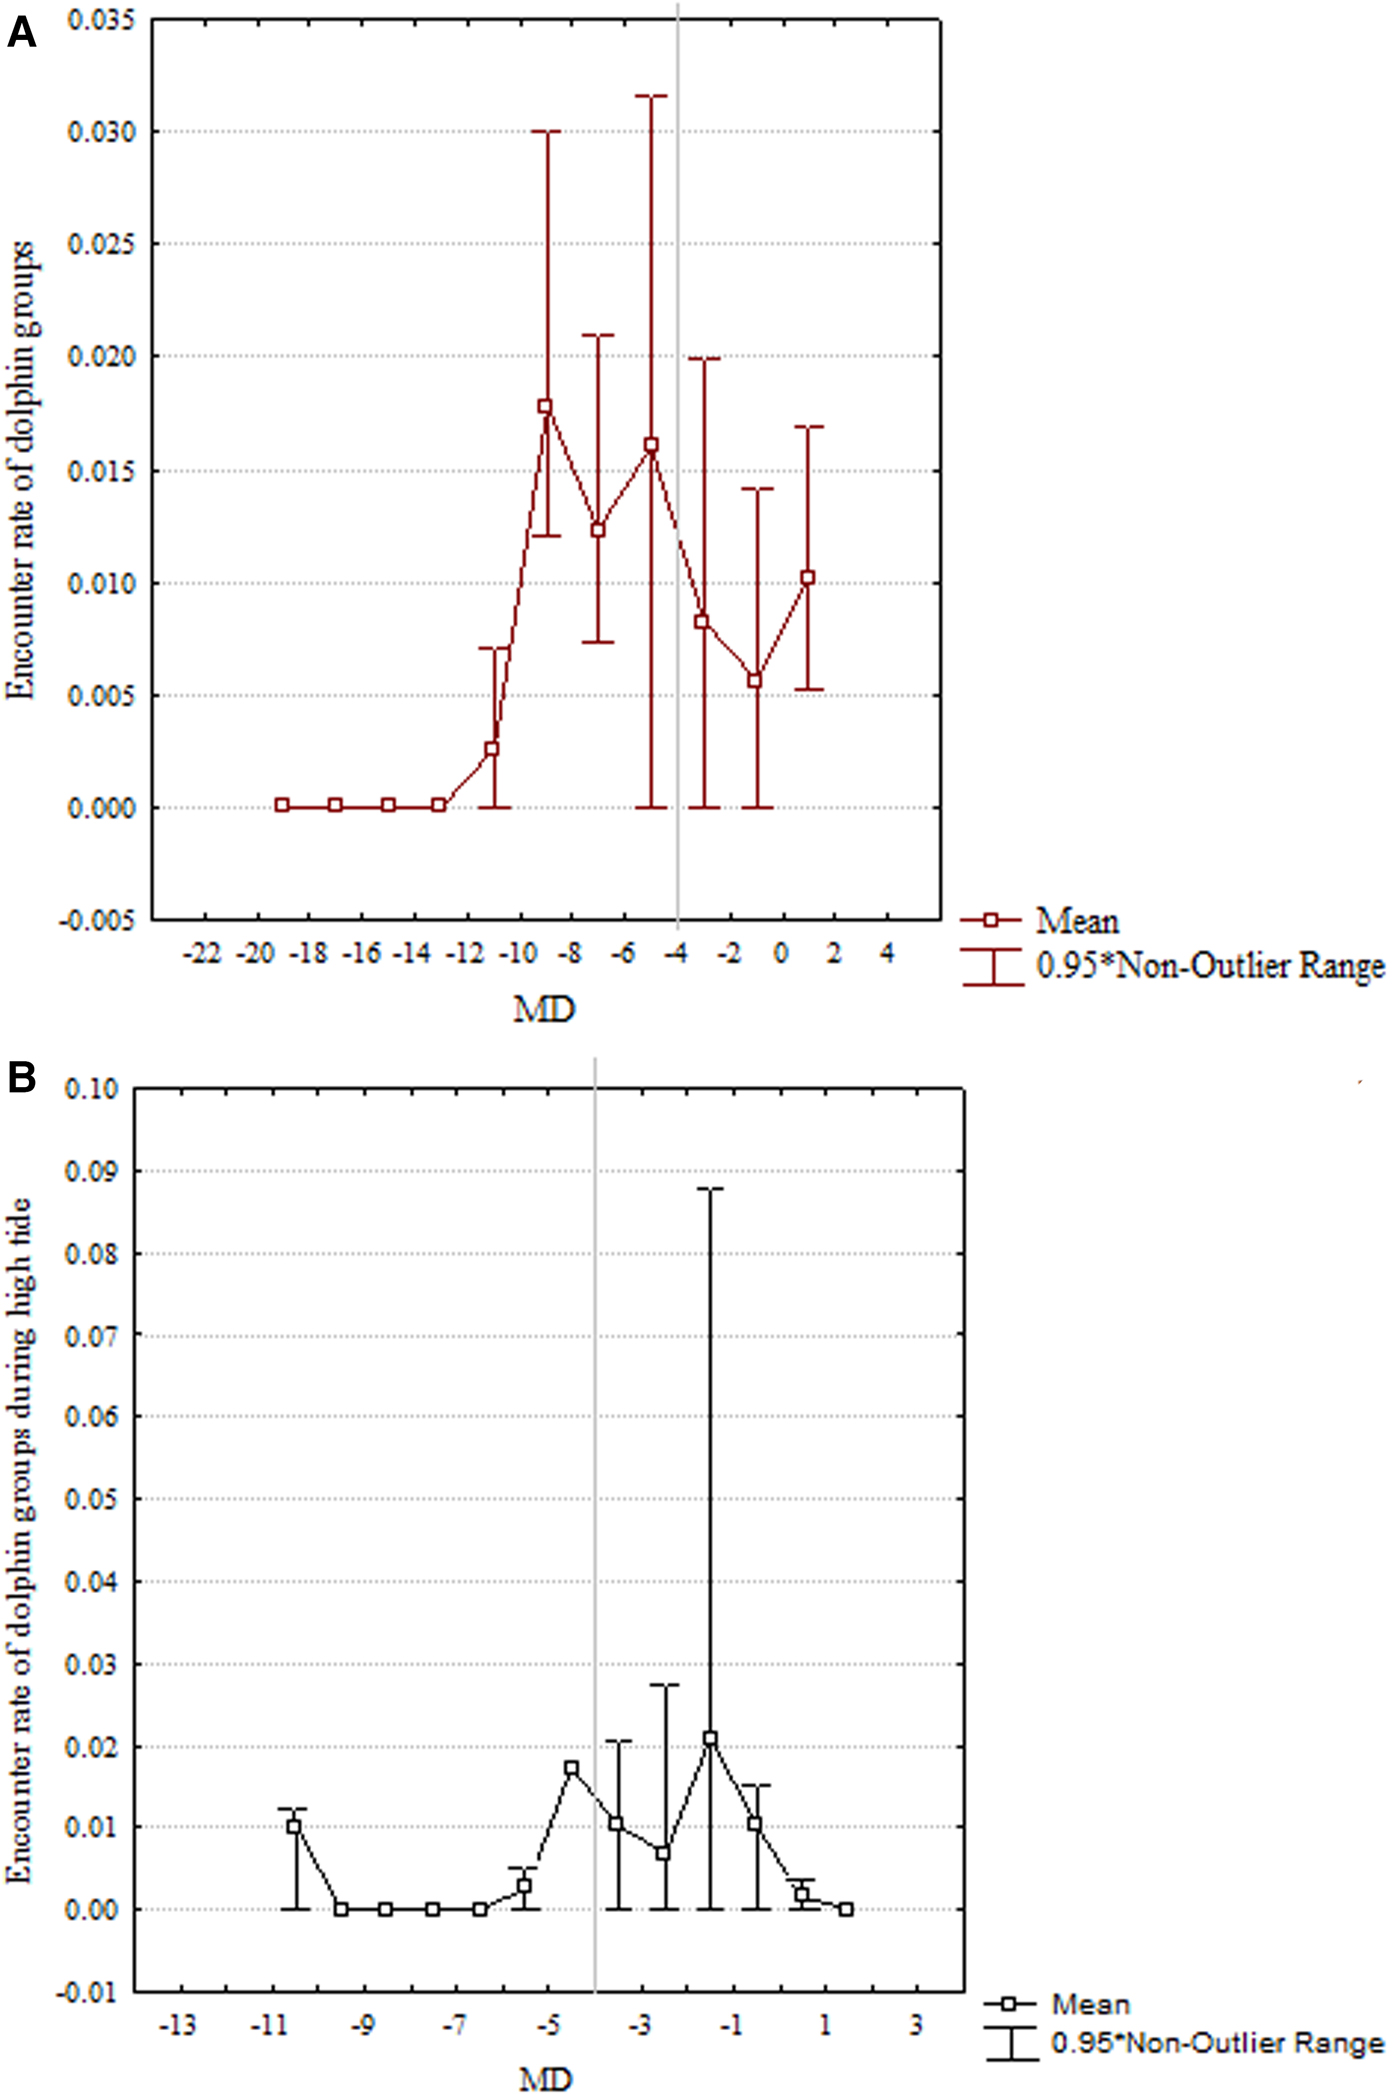
Investigating further the relation between encounter rates and the MD, it was notable that overall encounter rates dropped substantially at MD > 9 m deep, equalling 0 at MD ≥ 13 m deep (Figure 3A). During high tide, encounter rate were significantly higher in the intertidal zone (MD < 4 m deep) than in the subtidal region (MD ≥ 4 m deep; Figure 3B; U = 1548, P < 0.01). Accordingly, specific depth values measured in the field in the presence of dolphins (N = 41 groups) never exceeded 10 m (median depth = 5.8 m; quantile values Q1 = 4.1 m; Q3 = 7.2 m; range: 0.8 to 10 m). These measured depth values were positively correlated to the MD of the corresponding grid cells (r 2 = 0.51, P < 0.01) indicating the reliability of MD values. Slope and MD were weakly correlated in the grid cells (r 2 = 0.25, P < 0.05).
Variation in encounter rate of dolphin groups according to the MD of surveyed cells. The line indicates the transition from intertidal to subtidal zone. (A) In general, (B) During high tide.
Group composition and behaviour
In total, 61% of the encountered groups contained calves (N = 95 groups). No significant variation could be found in the environmental variables of where these groups were encountered, when compared with groups without calves (MD U = 3800, P = 0.73; slope U = 3622, P = 0.44; substrate χ2 = 0.28, P = 0.96). Similarly, depth values measured in the field did not vary between groups with calves (N = 27) and groups without calves (N = 14; U = 1.31, P = 0.19).
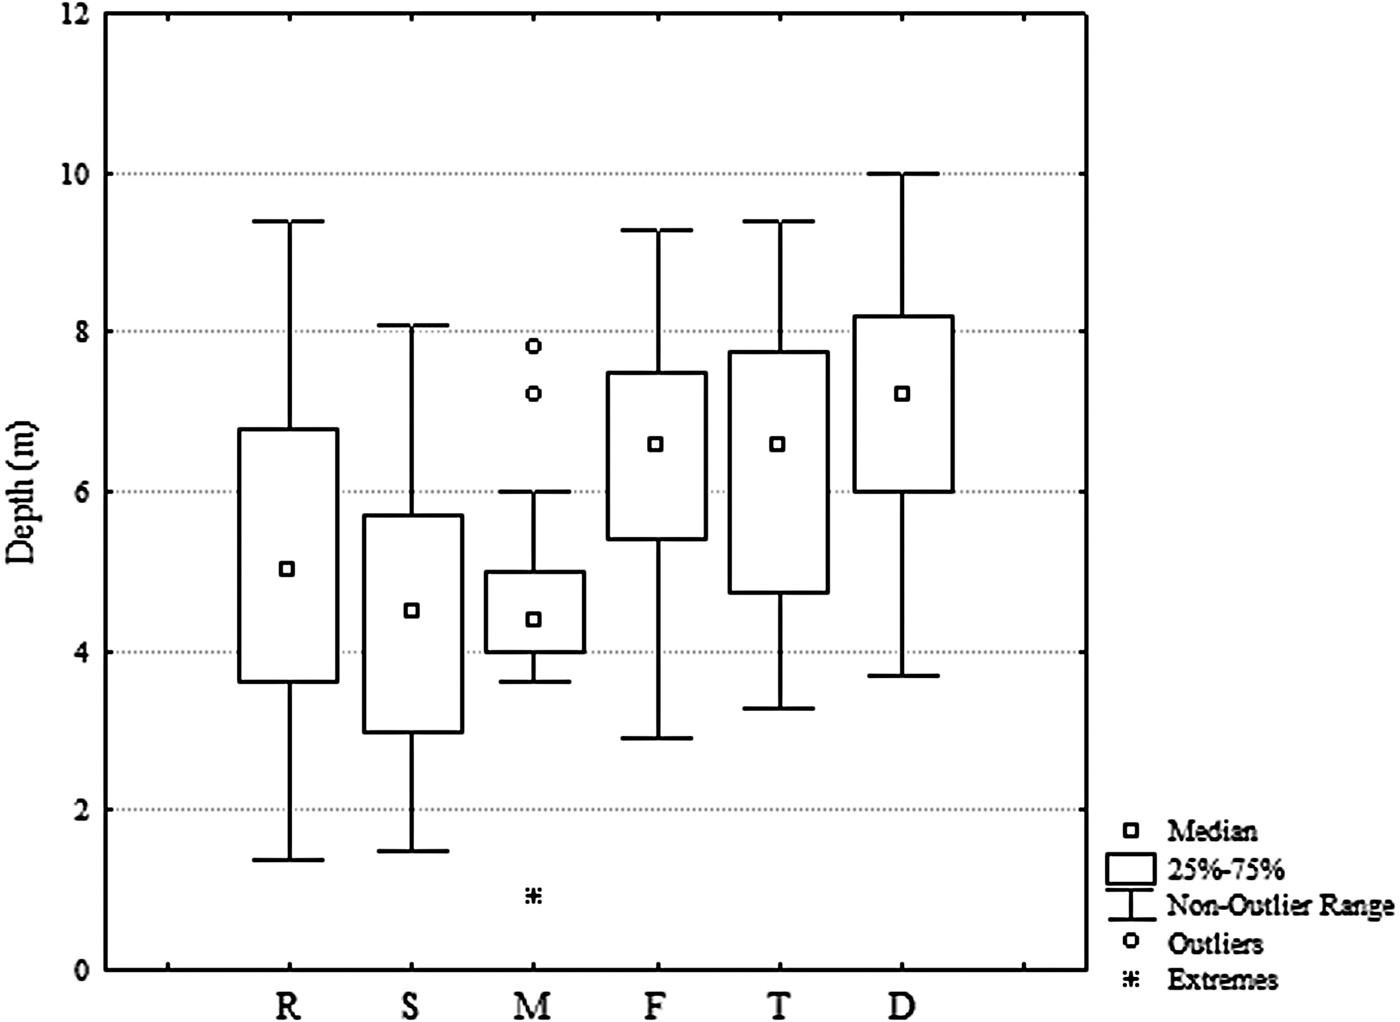
However, depth changed significantly with the behaviour of dolphins (MD: H = 26.3, P < 0.01; measured depths: H = 61.9, P < 0.01; Figure 4). Additional Mann–Whitney U tests showed that diving, feeding and travelling behaviour occurred in deeper areas, whereas resting, milling and socializing were observed in significantly shallower regions.
Depth values measured in the field (N = 41 dolphin groups) for different behavioural states: R, resting; S, socializing; M, milling; F, surface feeding; T, travel; D, diving.

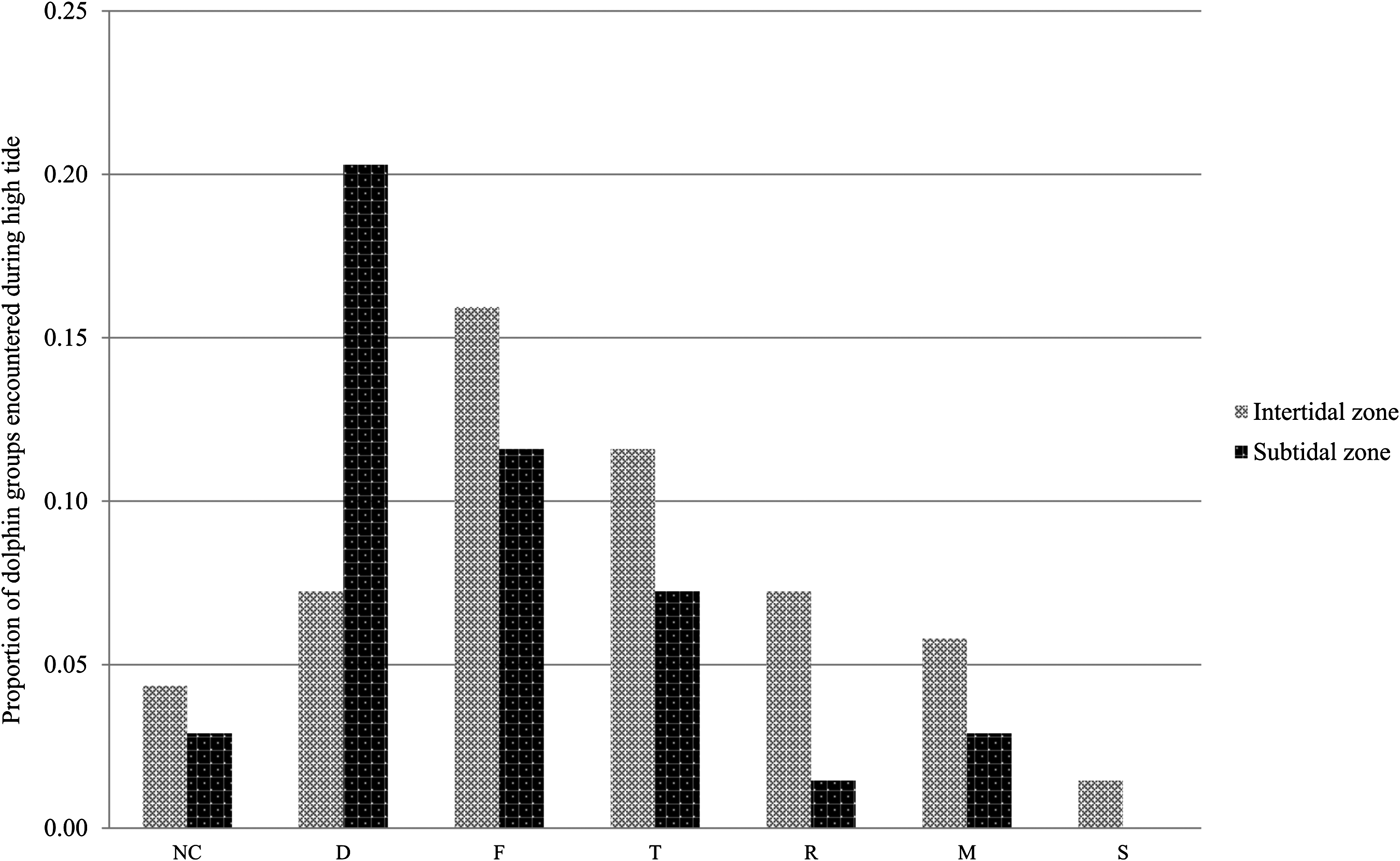
Diving occurred over steeper slopes than all other behaviours (H = 17.6, P < 0.01). There was no significant variation in substrate for the different behaviours (χ2 = 17.3, P = 0.50). During high tide, most dolphins groups encountered in the intertidal zone were surface feeding, whereas in the subtidal region most were diving (χ2 = 14.4, P < 0.05; Figure 5).
Proportion of dolphin groups encountered during high tide and their respective behaviours in the intertidal vs subtidal zone: NC, not classified; D, diving; F, surface feeding; T, travelling; R, resting; M, milling; S, socializing.

DISCUSSION
Due to the large tidal amplitude and the extended intertidal habitat in the study area, the region offers an ideal scenario to study the use of intertidal habitat by bottlenose dolphins. However, although data were carefully selected to account for possible bias, data were collected during a photo-identification study and therefore may have limitations. Results should therefore be interpreted with care.
Overall, bottlenose dolphins were observed in only half of the surveyed area, and remained in relatively shallow waters. During high tide, depth appeared to be an important factor affecting the dolphins’ habitat use patterns. As such, when the intertidal zone was immersed during high tide, dolphins clearly moved to this area. The only other study conducted in Argentina on the topic indicated similar movements of bottlenose dolphins related to the tide (Würsig & Würsig, Reference Würsig and Würsig1979). In general, tidal flow is known to affect short-term movement in coastal bottlenose dolphins (e.g. Irvine & Wells, Reference Irvine and Wells1972; Shane et al., Reference Shane, Wells and Würsig1986; Shane, Reference Shane, Leatherwood and Reevers1990; Acevedo, Reference Acevedo1991; Hanson & Defran, Reference Hanson and Defran1993; Chilvers et al., Reference Chilvers, Corkeron and Puotinen2003). As such, the species is commonly present in very shallow waters (e.g. Würsig & Würsig, Reference Würsig and Würsig1979; Leatherwood & Reeves, Reference Leatherwood and Reeves1983; dos Santos & Lacerda, Reference dos Santos and Lacerda1987; Ballance, Reference Ballance1992; Wilson et al., Reference Wilson, Thompson and Hammond1997; Defran & Weller, Reference Defran and Weller1999; Ingram & Rogan, Reference Ingram and Rogan2002). This has often been related to a trade-off between food availability and predation risk (Heithaus & Dill, Reference Heithaus and Dill2002). Predation risk was reported to be low in the study area (Vermeulen & Bräger, Reference Vermeulen and Bräger2015). Therefore food availability is hypothesized to be one of the main driving factors behind the observed use of the intertidal zone, an idea supported by the large number of dolphin groups engaged in foraging activities in this part of their habitat.
Although intertidal habitats generally represent only a small proportion of the marine environment, they often sustain a high biodiversity of organisms. Due to the large extension of BSA's intertidal zone, it has already been nationally and internationally recognized for its high value as a feeding ground for migrating shore birds (e.g. González et al., Reference González, Piersma and Verkuil1996; DiGiacomo, Reference DiGiacomo and DiGiacomo2005). Similarly, Perier (Reference Perier1994) reported on the importance of BSA's intertidal zone as a foraging (and spawning) ground for multiple fish species. The presented study indicates a similar significance of this intertidal habitat for the bottlenose dolphins, suggesting they are an integral part of the intertidal food web. Indeed, it was previously reported that the many invertebrate species inhabiting an intertidal zone may serve as an important food source attracting predators up the food chain (e.g. Perier, Reference Perier1994; García et al., Reference García, Isacch, Laich, Albano, Favero, Cardoni, Luppi and Iribarne2010). Such an exploitation of resources in the intertidal zone during its immersion at high tide has also been recorded for several other coastal marine mammal species around the world, including for example Indo-Pacific humpback dolphins (Sousa chinensis, Lin et al., Reference Lin, Akamatsu and Chou2013), marine tucuxi (Sotalia fluviatilis, Gurjão et al., Reference Gurjão, Neto, Santos and Cascon2003), finless porpoises (Neophocaena phocaenoides, Singh, Reference Singh2003), marine otters (Lutra felina, Medina-Vogel et al., Reference Medina-Vogel, Rodriguez, Alvarez and Bartheld2006), dugongs (Dugong dugong) and manatees (Trichechus sp.) (Gibson et al., Reference Gibson, Barnes and Atkinson2003).
However, humans are often also highly dependent on intertidal habitats. This frequently leads to strong environmental pressures and conservation related issues (e.g. Litler, Reference Litler and Power1980; Keough et al., Reference Keough, Quinn and King1993; Brosnan & Crumrine, Reference Brosnan and Crumrine1994; Addessi, Reference Addessi1995; Thompson et al., Reference Thompson, Crowe and Hawkins2002). Specifically in BSA, continued anthropogenic activities have shown to affect the invertebrate community of the local intertidal habitat through eutrophication (García et al., Reference García, Isacch, Laich, Albano, Favero, Cardoni, Luppi and Iribarne2010), pollution (Gil et al., Reference Gil, Harvey, Commendatore, Colombo and Esteves1996, Reference Gil, Harvey and Esteves1999, Reference Gil, Torres, Harvey and Esteves2006; Bonuccelli et al., Reference Bonuccelli, Malan, Luna and Torres2004; Vázquez et al., Reference Vázquez, Gil, Esteves and Narvate2007) and habitat degradation (Gil et al., Reference Gil, Torres, Harvey and Esteves2006; Carbone et al., Reference Carbone, Piccolo and Perillo2011). How this affects predators up the food chain remains unknown. However, as large marine predators are often good indicators for ecosystem health (e.g. Agrawal, Reference Agrawal2011), understanding the ecological importance of the intertidal habitat for bottlenose dolphins is of great value for further in depth research and enhanced impact assessments. This in turn will be essential to ensure accurate conservation management in the area, not only positively affecting this vulnerable population of bottlenose dolphins but also a wide range of other marine and coastal (often less charismatic) species under its shadow. In the end, management of intertidal habitat may arguably be easier than of open sea, as access can be restricted and implementation of regulations more strictly controlled (Thompson et al., Reference Thompson, Crowe and Hawkins2002).
ACKNOWLEDGEMENTS
Special thanks go to Alejandro Cammareri and the Marybio Foundation, of which I was part during the course of the study. Also thanks to Mariela Pazos, Jorge Baraschi, Hernan David and Natalia Sarra for their help and support. Thanks to the Environmental Agency of Río Negro (Consejo de Ecología y Medio Ambiente de la Provincia Río Negro [CODEMA]) and the Wildlife Service of Río Negro (Dirección de Fauna de la Provincia Río Negro) for the field permits. Thanks to the Naval Hydrographical Service of Argentina for the detailed electronic bathymetric chart of the study area. The manuscript was improved thanks to the review of Stefan Bräger, Jonas Tundo, Pedro Fruet, Sarah Dwyer and Tilen Genov.
FINANCIAL SUPPORT
The funding received for this research was very limited as there was no PhD scholarship available for the author. Most funds came from investments of personal money. Received funds came from the following organizations: Cetacean Society International (http://www.csiwhalesalive. com): US$3000 was given for the completion of fieldwork in 2007 and 2008. No specific grant number is available. Trigon N.V. (http://www.trigon.be): This software company contributed to the project by donating portable computers and hard drives. Marybio Foundation: The Marybio foundation was the NGO the author created and directed over the course of the study period. With this NGO, the author was able to receive the above-mentioned funds, gather membership fees, and receive students who contributed to the project with work (for their dissertation research) and funds from their respective universities. The funders of this research had no role in study design, data collection and analysis, decision to publish, or preparation of the manuscript.