1 Introduction
The wakes of flows past bluff bodies have, over the past century, held a prominent place in the field of fluid mechanics, continuing to be a source of fascination, inspiring further studies aiming to unravel the complex physics behind them. The vortex shedding phenomenon and its cascade to turbulence are ubiquitous in nature, developing various forcing profiles on the solid structure from which the wake is produced depending on the incident flow, and bears continued importance from an engineering perspective. The study of the transitions in these flows and their mechanisms, while fundamental in nature, is pivotal in developing a deeper understanding in this field.
The primary instability in the wakes of cylindrical structures triggering an oscillatory flow has been extensively studied for the circular cylinder (Mathis, Provansal & Boyer Reference Mathis, Provansal and Boyer1984; Jackson Reference Jackson1987; Provansal, Mathis & Boyer Reference Provansal, Mathis and Boyer1987; Sreenivasan, Strykowski & Olinger Reference Sreenivasan, Strykowski, Olinger and Ghia1987; Monkewitz Reference Monkewitz1988) and various other cylindrical geometries (Zielinska & Wesfreid Reference Zielinska and Wesfreid1995; Yoon, Yang & Choi Reference Yoon, Yang and Choi2010, amongst others). However, it is the secondary instabilities through which the flow becomes three-dimensional that the present study will focus on. Although the spanwise waviness of the primary vortex loops and streamwise ‘finger-like’ structures that develop in the transition to turbulence have been observed and studied variously (Gerrard Reference Gerrard1978, amongst others), it was the seminal works of Williamson (Reference Williamson1988a ,Reference Williamson b , Reference Williamson1996) which elucidated the transition scenario for the circular cylinder wake to occur through two successive stages. Each stage is clearly marked by a discontinuity in the Strouhal–Reynolds number profile. Subsequent studies further showed three-dimensional computations of the flow (Thompson, Hourigan & Sheridan Reference Thompson, Hourigan and Sheridan1996) and linear stability theory applied to these wakes (Barkley & Henderson Reference Barkley and Henderson1996) yielded a remarkable agreement to the experimental results. Analysis of the spatio-temporal symmetries of two-dimensional time-periodic flows consistent with the Kármán vortex street (Blackburn, Marques & Lopez Reference Blackburn, Marques and Lopez2005) shows the capacity of these flows to become unstable through three codimension-one symmetry-breaking bifurcations: two regular modes, for which mode A preserves the half-period-flip map of the underlying base flow while mode B breaks it, and a complex pair of quasi-periodic modes (Blackburn & Lopez Reference Blackburn and Lopez2003). These results generally extend to the wakes of cylindrical geometries with reflectively symmetric cross-sections about the wake centreline. Indeed, some or all of these instability modes are observed in the wakes of square cylinders (Robichaux, Balachandar & Vanka Reference Robichaux, Balachandar and Vanka1999), tandem circular cylinders (Carmo, Meneghini & Sherwin Reference Carmo, Meneghini and Sherwin2010) and elliptical cylinders (Thompson et al. Reference Thompson, Radi, Rao, Sheridan and Hourigan2014; Leontini, Lo Jacono & Thompson Reference Leontini, Lo Jacono and Thompson2015).
In contrast, research into the wakes of non-circular cylinders at non-reflection-symmetric inclinations to the flow describes the emergence of a new path to instability through a pure subharmonic mode. The structure of this subharmonic mode possesses a wavelength of approximately twice the cylinder’s characteristic length (between those of mode A and mode B) and has a periodicity that is twice that of the period of the two-dimensional base flow. An investigation into the stability of the wakes of the inclined square cylinder by Sheard, Fitzgerald & Ryan (Reference Sheard, Fitzgerald and Ryan2009), Yoon et al. (Reference Yoon, Yang and Choi2010) and Sheard (Reference Sheard2011) demonstrated the increasing prevalence of this subharmonic mode C as the dominant instability as the square cylinder becomes increasingly asymmetric about the wake centreline. It could then be inferred that the corresponding two-dimensional base flows increasingly deviate from the half-period-flip map as the asymmetry of the cylinder is increased through its inclination. This deviation explains the observation of a similar instability mode in the wake of a circular cylinder with a trip wire in its vicinity (Zhang et al. Reference Zhang, Fey, Noack, König and Eckelmann1995; Yildirim, Rindt & van Steenhoven Reference Yildirim, Rindt and van Steenhoven2013b ) as well as for circular cylinders proximate to a moving wall (Jiang et al. Reference Jiang, Cheng, Draper and An2017), and has been elucidated through stability studies of the wakes of rings (Sheard, Thompson & Hourigan Reference Sheard, Thompson and Hourigan2003, Reference Sheard, Thompson and Hourigan2005a ; Sheard et al. Reference Sheard, Thompson, Hourigan and Leweke2005b ), staggered cylinder configurations (Carmo et al. Reference Carmo, Sherwin, Bearman and Willden2008), inclined flat plates (Yang et al. Reference Yang, Pettersen, Andersson and Narasimhamurthy2013), inclined elliptical cylinders (Rao et al. Reference Rao, Leontini, Thompson and Hourigan2017) and also in non-stationary configurations such as flows past a rotating circular cylinder (Rao et al. Reference Rao, Leontini, Thompson and Hourigan2013). Yildirim, Rindt & van Steenhoven (Reference Yildirim, Rindt and van Steenhoven2013a ) and Yildirim et al. (Reference Yildirim, Rindt and van Steenhoven2013b ) further investigated the characteristics of the mode C instability experimentally for flow past a circular cylinder with a trip wire, showing that fluctuations in the wake to develop asymmetrically about the wake centreline unlike the case without the wire, and also that every pair of consecutively shed counter-rotating vortices takes a slightly different trajectory. The study also demonstrated the non-negligible differences in the strengths of consecutive counter-rotating spanwise vortices in the wake, and also that the strengths of the streamwise vortices increases further from the cylinder.
Despite the interest in these wake flows, studies of flows past cylinders with triangular cross-sections appear to be lacking in the literature. Cylinders with such cross-sections subject flows to sharp corners, which are common features in structural design, vortex generators, heat exchangers and flow measurement devices among other applications. These sharp corners facilitate flow separation at high Reynolds numbers, fixing the separation points of the flow from the cylinder unlike those for the circular cylinder where the separation points can reposition along the smooth cylinder surface, or the inclined square cylinder where the separated flow can possibly reattach to the cylinder surface at moderate Reynolds numbers (Yoon et al.
Reference Yoon, Yang and Choi2010). The triangular cross-section cylinder also shows a stronger lack of geometric symmetry to the oncoming flow since, with the exception of the cylinder inclined with its axis perpendicular to the oncoming flow vector, the cylinder will always present an unequal number of faces to the upstream and downstream directions. The degree of geometric asymmetry about the streamwise direction, being controlled solely through the inclination of the cylinder, thus allows the effects of flow asymmetry on the stability of the wakes of the cylinder to be studied in a more controllable manner. Most studies on the equilateral triangular cylinder have focused on the two-dimensional characteristics of the flow: stability analyses by Jackson (Reference Jackson1987), Zielinska & Wesfreid (Reference Zielinska and Wesfreid1995) and De & Dalal (Reference De and Dalal2006) on the wakes of the triangular cylinder with its apex pointing upstream show the flow to become two-dimensionally unstable at a critical Reynolds number of
 $Re_{cr}\approx 40$
, and shows the scaling of the global modes to be consistent with those predicted by the Stuart–Landau equation; general structures in the wakes of these cylinders with incidence angle variation, along with measurements of their force coefficients, have also been reported by Bao, Zhou & Zhao (Reference Bao, Zhou and Zhao2010), Tu et al. (Reference Tu, Zhou, Bao, Han and Li2014) and Ng et al. (Reference Ng, Vo, Hussam and Sheard2016), noting that the cylinder inclined with its apex perpendicular to the flow yields the largest lift coefficients. Wind tunnel experiments by Iungo & Buresti (Reference Iungo and Buresti2009) measured the shedding frequencies and force coefficients for the flow at
 $Re\approx 1.2\times 10^{5}$
, showing that the largest lift coefficients occur at similar angles to those predicted by the two-dimensional flow studies, despite the significantly higher Reynolds number. Experiments by Luo & Eng (Reference Luo and Eng2010) on the stability of the wakes of an isosceles triangular cylinder with its apex pointing in the downstream direction report the flow to become unstable through mode A, with the transition predicted to be subcritical and to occur at
 $Re_{A}=164$
, without a subsequent transition to mode B detected. To the best of the authors’ knowledge, the stability of the wakes of cylinders with an equilateral triangular cross-section and its variation with different flow incidence angles have never been reported prior to this paper.
The structure of this paper is as follows. Section 2 introduces the system under investigation, the solver and stability analysis techniques used. Results from mesh resolution and domain-dependence studies are also described. The stability of the periodic flow is discussed in § 3.1 describing the dependence of the Floquet exponent on the wavenumber, trends in the growth rates of the various instabilities described in § 3.2 and the structure of the instabilities in § 3.3. Motivated by the results of the stability analysis, an attempt at quantifying the deviations of the two-dimensional time-periodic base flow from the ideal half-period-flip map is presented in § 3.4. Nonlinear aspects of this transition are then discussed in § 3.5, and conclusions are drawn in § 4.
2 Methodology
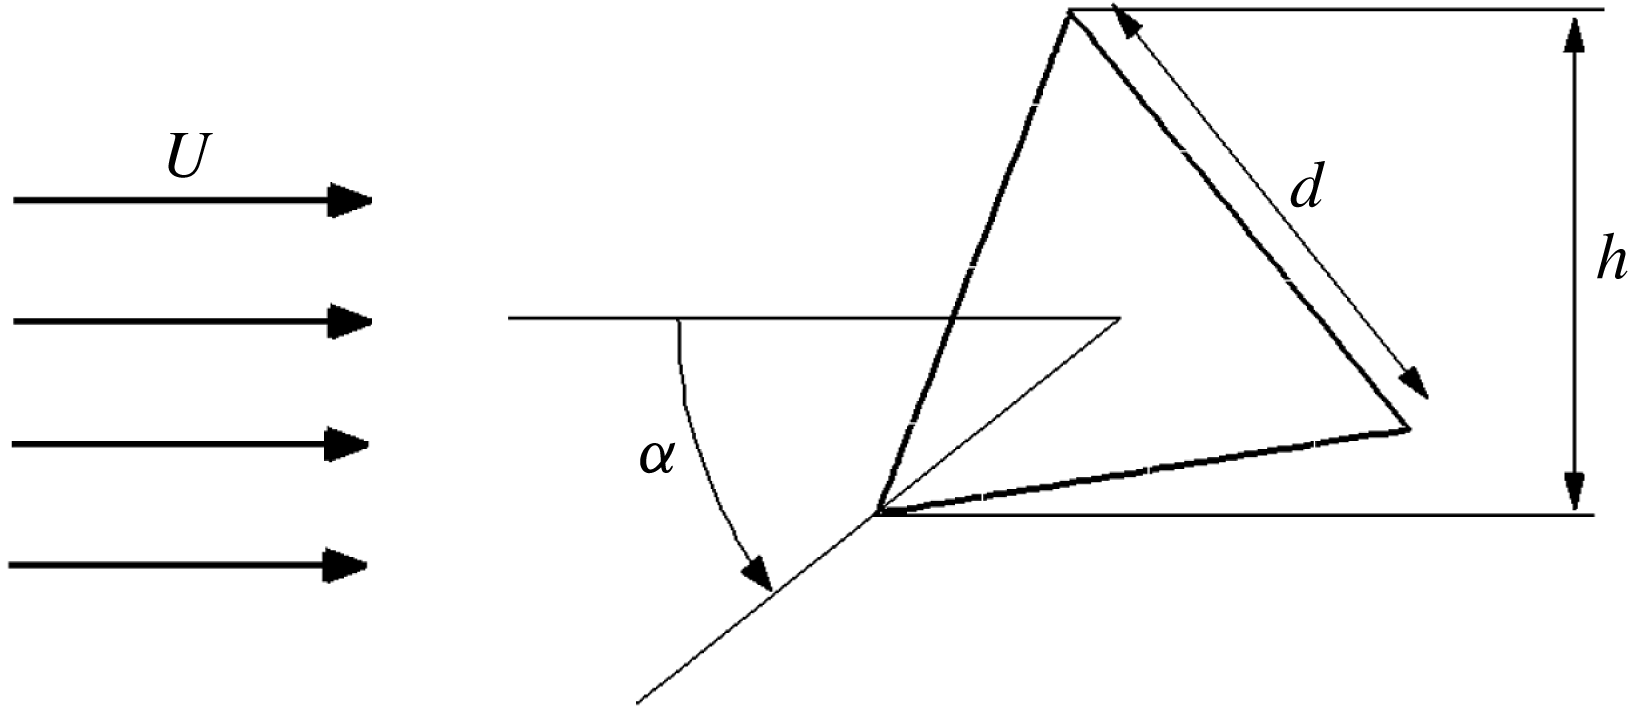
The system under investigation in this study comprises a cylinder with an equilateral triangular cross-section (hereafter referred to as ‘cylinder’ for brevity) immersed in a uniform flow with velocity
 $U$
, producing a wake region whose stability characteristics are sought. A schematic diagram of this system is provided in figure 1. The cylinder inclination is gradually varied between
 $0^{\circ }\leqslant \unicode[STIX]{x1D6FC}\leqslant 60^{\circ }$
(increasing in the counter-clockwise direction), generally at an increment of
 $\unicode[STIX]{x1D6FC}=6^{\circ }$
, with all inclinations outside this range being either reflection symmetric about the horizontal centreline, or identical to the geometries contained within the initial range. Specifically,
 $\unicode[STIX]{x1D6FC}=0^{\circ }$
corresponds to the case with the triangle cross-section pointing directly upstream,
 $\unicode[STIX]{x1D6FC}=30^{\circ }$
corresponds to the case where the triangle is pointing vertically upwards,
 $\unicode[STIX]{x1D6FC}=60^{\circ }$
describes the triangle pointing directly downstream and
 $\unicode[STIX]{x1D6FC}=90^{\circ }$
, which is outside the computed range of angles, is simply the cylinder at
 $\unicode[STIX]{x1D6FC}=30^{\circ }$
reflected about the horizontal centreplane. The height projected by the cylinder on the flow (
 $h$
) is then a function of the cylinder side length (
 $d$
) and the inclination angle (
 $\unicode[STIX]{x1D6FC}$
) through
 $$\begin{eqnarray}\frac{h}{d}(\unicode[STIX]{x1D6FC})=\sin (60^{\circ }-|\unicode[STIX]{x1D6FC}-30^{\circ }|)+\sin (|\unicode[STIX]{x1D6FC}-30^{\circ }|).\end{eqnarray}$$
Choosing
 $h$
as the characteristic length scale and
 $U$
as the velocity scale, the Reynolds number for this study is defined as
 $Re=Uh/\unicode[STIX]{x1D708}$
, where
 $\unicode[STIX]{x1D708}$
is the fluid kinematic viscosity. The Reynolds number scaled by the cylinder side length
 $d$
(
 $Re_{d}$
) can be recovered by dividing
 $Re$
by the
 $h/d$
relation in (2.1).
Schematic diagram of the flow system.

2.1 Numerical scheme
The flow in this system is governed by the time-dependent incompressible Navier–Stokes equations, comprising mass and momentum conservation equations, which in their normalized forms are given as
 $$\begin{eqnarray}\displaystyle \unicode[STIX]{x1D735}\boldsymbol{\cdot }\boldsymbol{u} & = & \displaystyle 0,\end{eqnarray}$$
 $$\begin{eqnarray}\displaystyle \frac{\unicode[STIX]{x2202}\boldsymbol{u}}{\unicode[STIX]{x2202}t}+(\boldsymbol{u}\boldsymbol{\cdot }\unicode[STIX]{x1D735})\boldsymbol{u} & = & \displaystyle -\unicode[STIX]{x1D735}p+\frac{1}{Re}\unicode[STIX]{x1D6FB}^{2}\boldsymbol{u},\end{eqnarray}$$
 $\boldsymbol{u}(x,y,z,t)=(u,v,w)$
is the velocity scaled by
 $U$
,
 $t$
is the non-dimensional time scaled by
 $h/U$
and
 $p$
the non-dimensional pressure scaled by
 $\unicode[STIX]{x1D70C}U^{2}$
.
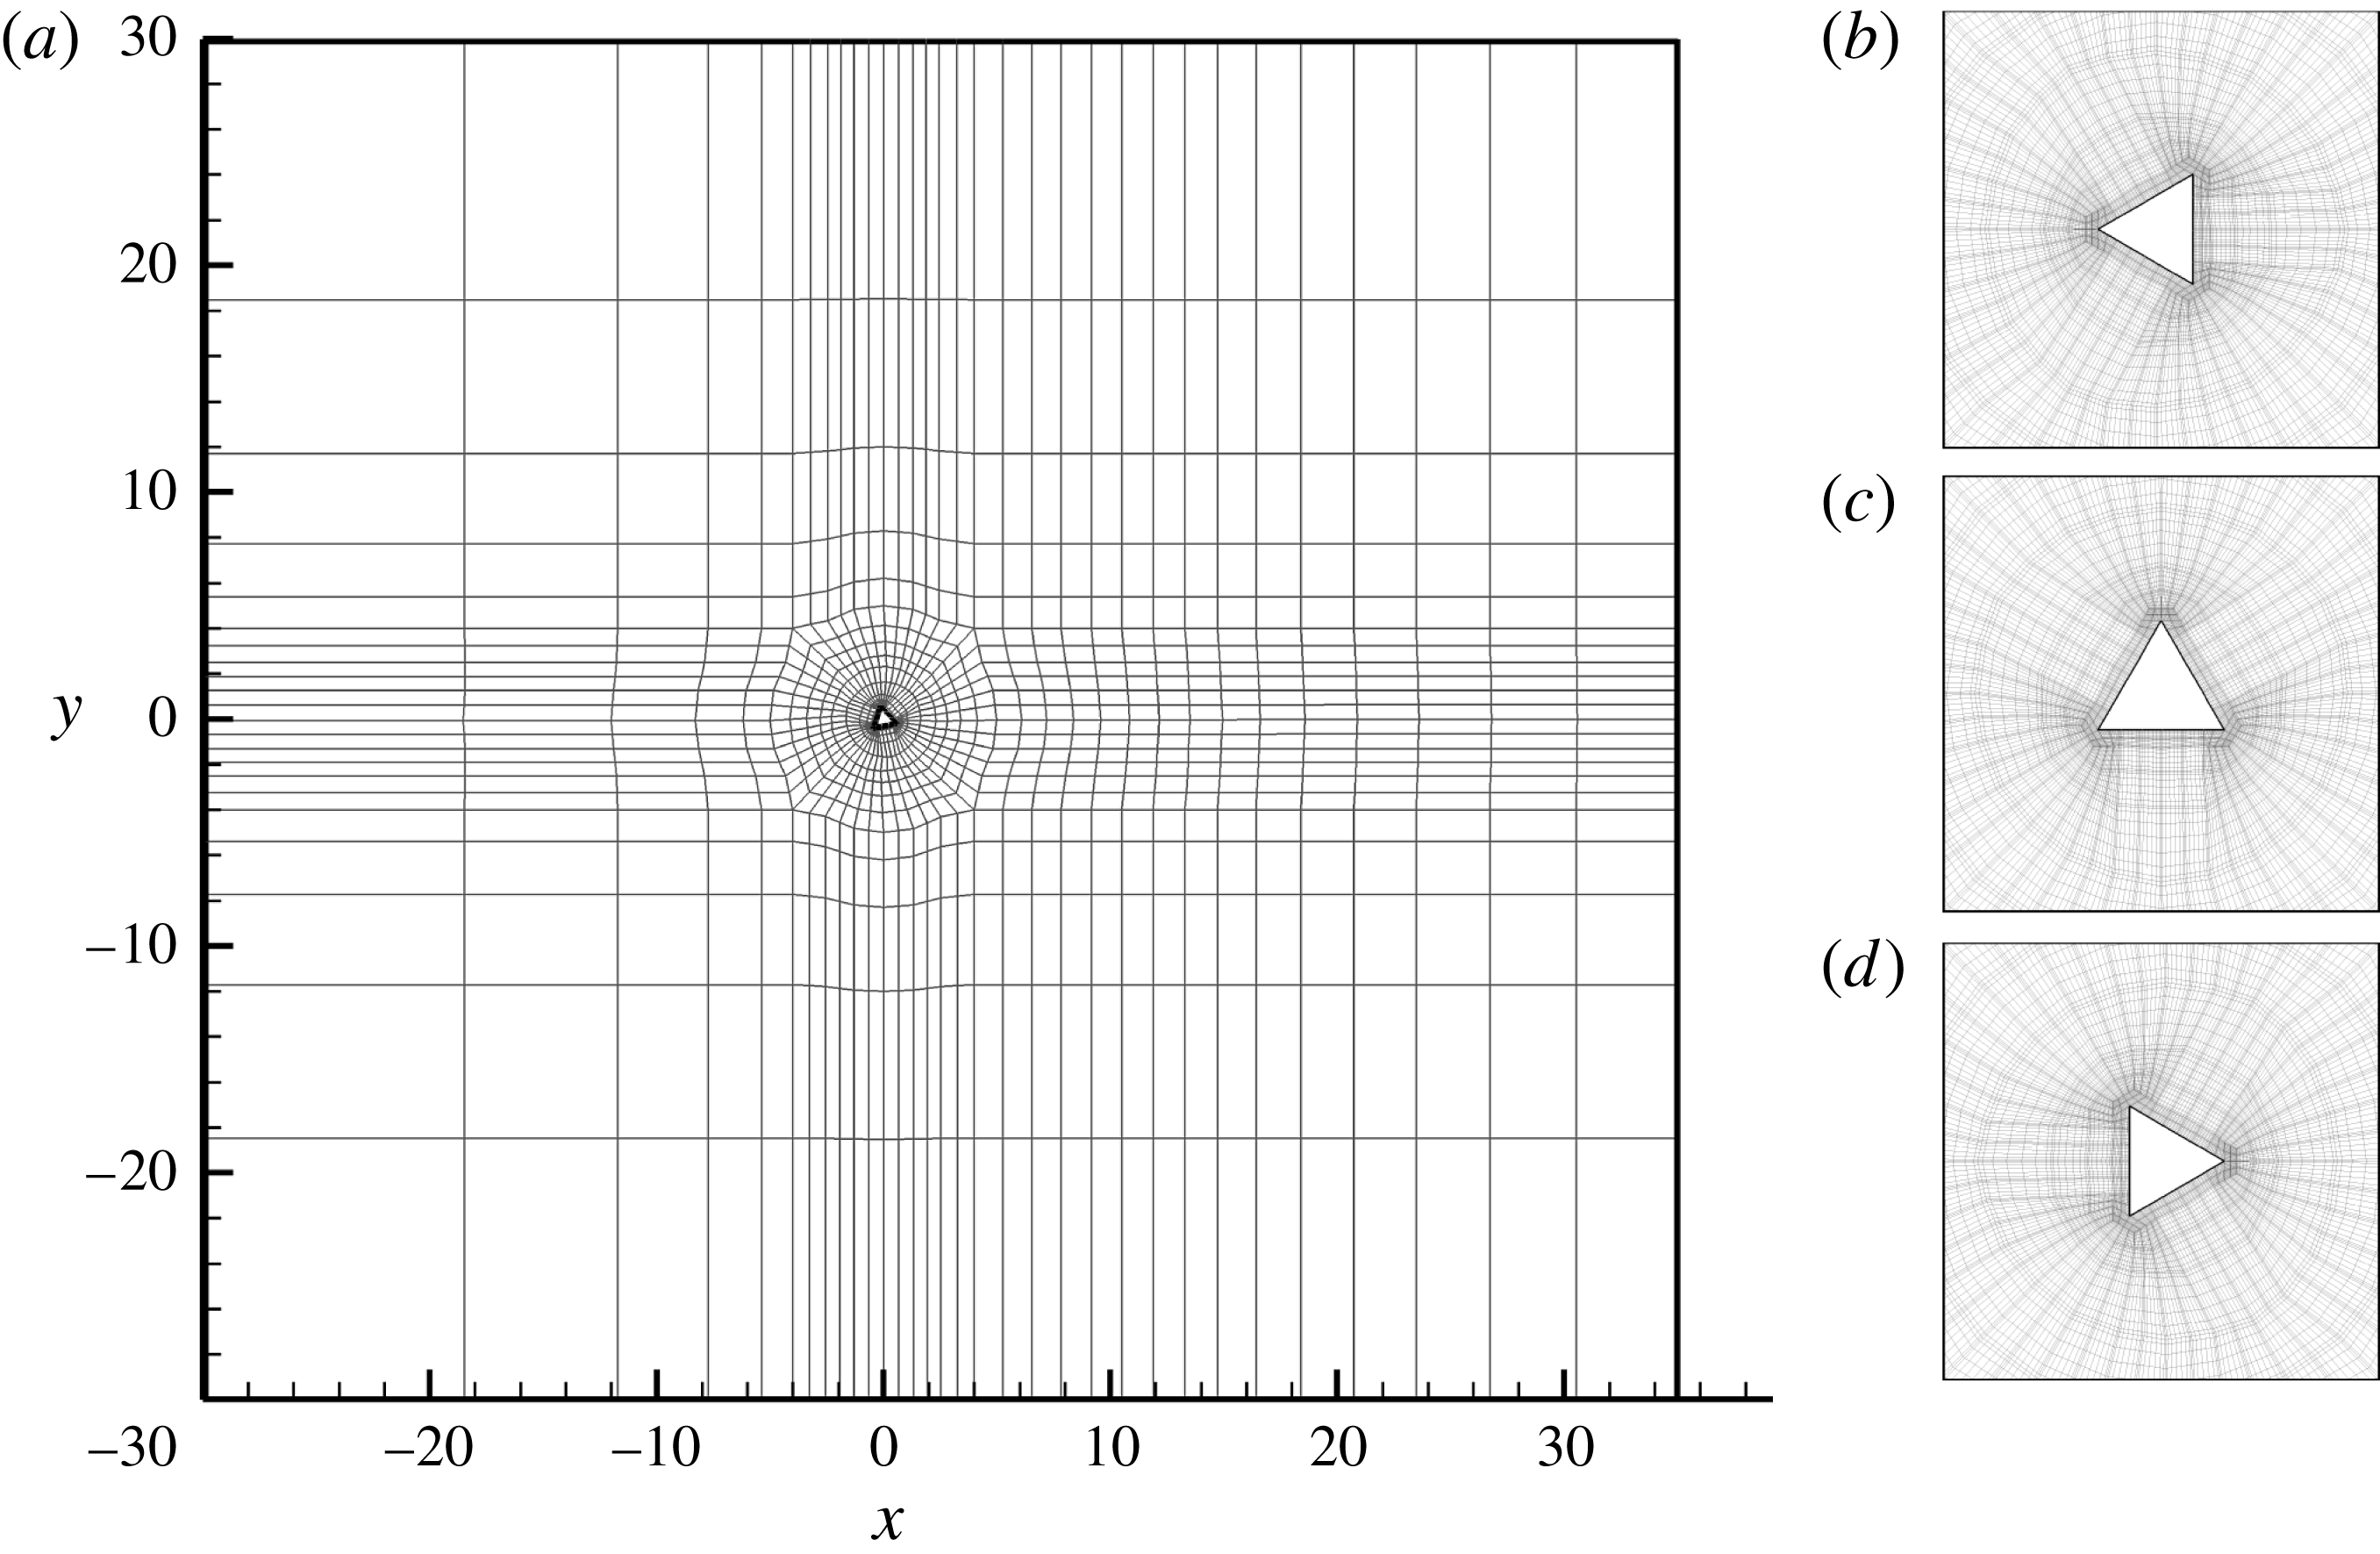
(a) The computational domain used in this study detailing the macro-element distribution. (b–d) Mesh detail in the vicinity of the cylinder for (b)
 $\unicode[STIX]{x1D6FC}=0^{\circ }$
, (c)
 $\unicode[STIX]{x1D6FC}=30^{\circ }$
and (d)
 $\unicode[STIX]{x1D6FC}=60^{\circ }$
.

For two-dimensional flow computations, the Navier–Stokes equations are solved using a spectral-element method for spatial discretization (Karniadakis & Triantafyllou Reference Karniadakis and Triantafyllou1992) and evolved in time using a third-order time-integration scheme based on backward differentiation (Karniadakis, Israeli & Orszag Reference Karniadakis, Israeli and Orszag1991; Blackburn & Sherwin Reference Blackburn and Sherwin2004). Briefly, the computational domain is first subdivided into quadrilateral macro-elements onto each of which a Lagrangian tensor-product polynomial shape function is imposed. The shape functions are then interpolated at the Gauss–Legendre–Lobatto quadrature points, enabling the use of highly efficient quadrature methods for integration. Three-dimensional flows in this study are computed using a spectral-element/Fourier-algorithm (Karniadakis & Triantafyllou Reference Karniadakis and Triantafyllou1992; Thompson et al. Reference Thompson, Hourigan and Sheridan1996; Blackburn & Sherwin Reference Blackburn and Sherwin2004) which discretizes flow variables in the spanwise direction using a Fourier series. This naturally enforces a periodic condition on the flow at the limits of the spanwise domain. The present solver has been implemented and validated previously in Sheard et al. (Reference Sheard, Leweke, Thompson and Hourigan2007), Sheard et al. (Reference Sheard, Fitzgerald and Ryan2009) and Blackburn & Sheard (Reference Blackburn and Sheard2010) for two-dimensional flow computations, and in Sheard et al. (Reference Sheard, Fitzgerald and Ryan2009) and Ryan, Butler & Sheard (Reference Ryan, Butler and Sheard2012) for three-dimensional flow computations.
The computational domain (shown in figure 2
a) is treated with the following boundary conditions: the inlet (left edge) has an imposed uniform flow in the streamwise direction (
 $u=U$
), transverse boundaries are treated with a stress-free/impermeable condition (
 $v=0$
,
 $\unicode[STIX]{x2202}u/\unicode[STIX]{x2202}y=0$
), the outlet is assigned a zero reference pressure and a zero outward normal gradient of velocity and the cylinder surface is assigned a no-slip condition. On all boundaries assigned with a Dirichlet velocity condition, a suitable Neumann boundary condition is imposed on the outward normal gradient of pressure to maintain the overall third-order accuracy of the scheme (Karniadakis et al.
Reference Karniadakis, Israeli and Orszag1991).
2.2 Linear stability analysis
Let
 $(\bar{\boldsymbol{u}},\bar{p})$
be the solution of a time-periodic two-dimensional base flow that is homogeneous in the spanwise direction. If an infinitesimal three-dimensional perturbation field
 $(\boldsymbol{u}^{\prime },p^{\prime })$
is imposed on the two-dimensional base flow such that
 $\boldsymbol{u}=\bar{\boldsymbol{u}}+\boldsymbol{u}^{\prime }$
and
 $p=\bar{p}+p^{\prime }$
, then substituting these into (2.2) and neglecting nonlinear perturbation product terms yields the base flow evolution equations as well as the perturbation evolution equations. The latter are given as
 $$\begin{eqnarray}\displaystyle \unicode[STIX]{x1D735}\boldsymbol{\cdot }\boldsymbol{u}^{\prime } & = & \displaystyle 0,\end{eqnarray}$$
 $$\begin{eqnarray}\displaystyle \frac{\unicode[STIX]{x2202}\boldsymbol{u}^{\prime }}{\unicode[STIX]{x2202}t}+(\boldsymbol{u}^{\prime }\boldsymbol{\cdot }\unicode[STIX]{x1D735})\bar{\boldsymbol{u}}+(\bar{\boldsymbol{u}}\boldsymbol{\cdot }\unicode[STIX]{x1D735})\boldsymbol{u}^{\prime } & = & \displaystyle -\unicode[STIX]{x1D735}p^{\prime }+\frac{1}{Re}\unicode[STIX]{x1D6FB}^{2}\boldsymbol{u}^{\prime }.\end{eqnarray}$$
The perturbation terms
 $(\boldsymbol{u}^{\prime },p^{\prime })$
in (2.3) can further be expressed as the sum of all Fourier modes in the spanwise direction, which reduces the problem to a set of decoupled equations allowing for the stability to be investigated independently for each different mode/wavenumber
 $m$
at a given incidence angle and Reynolds number. This stability analysis method yields the eigenmodes corresponding to the Floquet multipliers (
 $\unicode[STIX]{x1D707}$
) of the leading instability modes at a given wavenumber, which are related to the instability growth rates through
 $|\unicode[STIX]{x1D707}|=\exp (\unicode[STIX]{x1D70E}T)$
where
 $T$
is the period of the unsteady base flow. The mode is considered to be unstable when the perturbation growth rate
 $\unicode[STIX]{x1D70E}>0$
(
 $|\unicode[STIX]{x1D707}|>1$
), neutrally stable when
 $\unicode[STIX]{x1D70E}=0$
(
 $|\unicode[STIX]{x1D707}|=1$
) and stable when
 $\unicode[STIX]{x1D70E}<0$
(
 $|\unicode[STIX]{x1D707}|<1$
). It is the leading eigenmode which is of primary interest as it pertains to the fastest growing instability at a given wavenumber. The Floquet multipliers describe how the predicted instabilities interact with the underlying base flow. Positive real multipliers indicate that the instability is synchronous with the two-dimensional base flow, negative real multipliers indicate that the predicted instability mode is subharmonic to the base flow and simultaneous complex-conjugate multipliers indicate that the instability is quasiperiodic. The predicted wavelength of the instability can then be obtained through
 $\unicode[STIX]{x1D706}=2\unicode[STIX]{x03C0}/m$
.
The eigenmodes for this stability analysis are computed using an implicitly restarted Arnoldi method (Barkley & Henderson Reference Barkley and Henderson1996; Blackburn & Lopez Reference Blackburn and Lopez2003), which is implemented through the ARPACK eigenvalue solver (Lehoucq, Sorensen & Yang Reference Lehoucq, Sorensen and Yang1998). The present stability analysis code has been implemented and validated previously in Sheard et al. (Reference Sheard, Fitzgerald and Ryan2009), Blackburn & Sheard (Reference Blackburn and Sheard2010) and Sheard (Reference Sheard2011).
2.3 Grid independence and validation
Spatial resolution in the computational domain can be controlled through the degree of the polynomial shape function (
 $N_{p}$
) imposed on the macro-elements. This is known as a p-type refinement as opposed to an h-type refinement where the number of macro-elements is varied. To ensure that the dynamics of the flow is sufficiently resolved, a p-type grid-dependence study is performed for the cylinder inclined at
 $\unicode[STIX]{x1D6FC}=30^{\circ }$
as this inclination angle possesses the largest macro-elements in the vicinity of the cylinder owing to the mesh construction.
 $Re=200$
was used as this Reynolds number is anticipated to be high enough for the flow to exhibit three-dimensionality. The computational domain extends through
 $-30\leqslant x/h\leqslant 35$
and
 $-30\leqslant y/h\leqslant 30$
with the cylinder centrally placed at
 $(x,y)=(0,0)$
. The relative errors with increasing
 $N_{p}$
of the Strouhal number St, the mean drag coefficient
 $\overline{c_{D}}$
and the mean lift coefficient
 $\overline{c_{L}}$
for this case have been quantified and presented in a previous study (Ng et al.
Reference Ng, Vo, Hussam and Sheard2016), and are repeated here to include those of the root mean square (r.m.s.) of the lift coefficient
 $c_{L}^{\prime }$
, and the Floquet multiplier and wavenumber of the dominant mode (
 $|\unicode[STIX]{x1D707}|_{peak}$
and
 $m_{peak}$
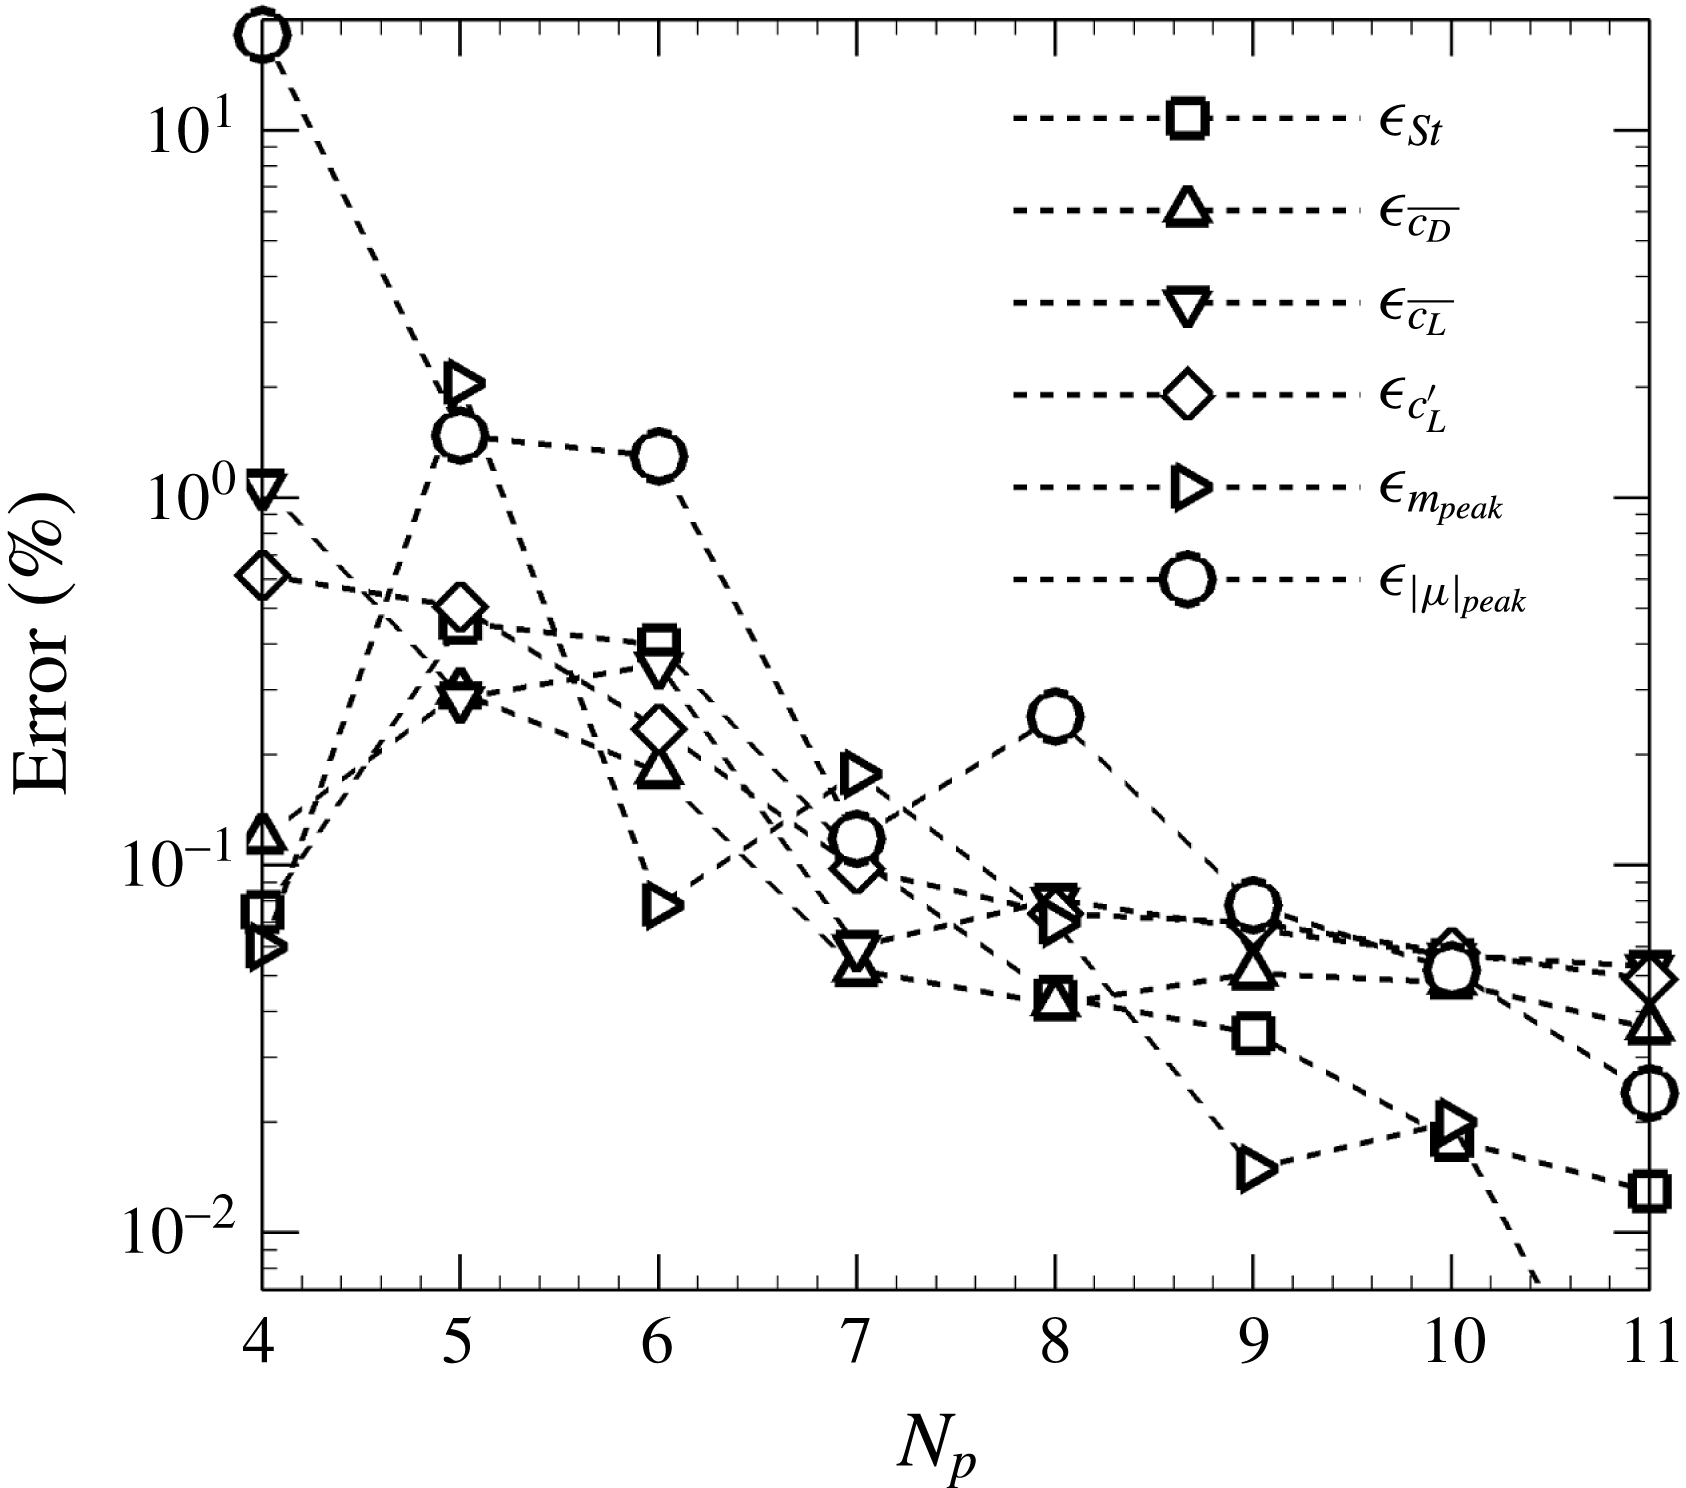
, respectively). As shown in figure 3, all parameters from the two-dimensional flow computations show a convergence to better than 0.1 % for
 $N_{p}\geqslant 8$
, which is generally smaller than most experimental uncertainty thresholds. The relative error of the Floquet multipliers, however, increases to
 ${\approx}0.26\,\%$
between
 $N_{p}=7$
and 8, but remains at approximately the same order of magnitude and subsequently decreases with increasing
 $N_{p}$
. Errors computed relative to
 $N_{p}=12$
(highest polynomial-order tested) clarify this issue by showing a monotonic decrease for
 $N_{p}\geqslant 8$
, with the largest error at
 $N_{p}=8$
being
 $\unicode[STIX]{x1D716}_{|\unicode[STIX]{x1D707}|}=0.36\,\%$
. A polynomial order of
 $N_{p}=8$
is thus applied for all computations in this study since most parameters of the flow are shown to change by less than 0.1 % with increasing polynomial order, and the larger magnitudes of
 $\unicode[STIX]{x1D716}_{|\unicode[STIX]{x1D707}|}$
are justifiable considering that the analysis deriving
 $|\unicode[STIX]{x1D707}|$
would compound the underlying resolution errors from the two-dimensional base flow.
Relative errors with increasing
 $N_{p}$
for the Strouhal number (▫), mean drag coefficient (▵), mean lift coefficient (▿), r.m.s. of the lift coefficient (♢) and the leading instability wavenumber (▹) and its corresponding multiplier (○).

Uncertainties associated with finite domain sizes have also been quantified and are reported in Ng et al. (Reference Ng, Vo, Hussam and Sheard2016). That study revealed that the two-dimensional vortex street has a tendency to undergo several topological changes, including the breakdown of the primary Kármán vortex street leading to the formation of a secondary one of a larger scale. The development of this secondary vortex street has generally been attributed to an instability of the mean flow, and its onset within the computation domain introduces incommensurate frequencies into the wake. This places a restriction on using larger domain sizes, and on the range of Reynolds numbers at which the Floquet stability analysis can be performed.
The final meshes used throughout this study possess 1016 quadrilateral macro-elements, and imposes a polynomial shape function of
 $N_{p}=8$
, examples of which are shown in figure 2.
3 Results
3.1 Floquet multiplier dependence on wavenumber and neutral stability
Prior studies on the stability of flows past cylinders of various cross-sections have associated the various predicted instability modes with the complex Floquet multiplier obtained from the stability analysis as follows: both regular modes A and B observed in the wakes of circular cylinders (Barkley & Henderson Reference Barkley and Henderson1996; Sheard et al.
Reference Sheard, Thompson and Hourigan2003), square cylinders (Robichaux et al.
Reference Robichaux, Balachandar and Vanka1999; Sheard et al.
Reference Sheard, Fitzgerald and Ryan2009) and bluff rings (Sheard et al.
Reference Sheard, Thompson and Hourigan2003) among other geometries become unstable through a positive real multiplier, with modes A or B being discernible through the structure and spatio-temporal symmetry of the resulting instability; the quasi-periodic mode (QP) becomes unstable through a complex-conjugate pair of multipliers simultaneously crossing the unit circle
 $|\unicode[STIX]{x1D707}|=1$
(Blackburn & Lopez Reference Blackburn and Lopez2003); while the subharmonic mode C becomes unstable through a negative real multiplier (Sheard et al.
Reference Sheard, Thompson and Hourigan2003, Reference Sheard, Thompson and Hourigan2005a
, Reference Sheard, Fitzgerald and Ryan2009; Carmo et al.
Reference Carmo, Sherwin, Bearman and Willden2008). Two instability modes are predicted to develop in the wakes of the cylinders in this study resembling the mode A and mode C instabilities, and will be referred to similarly as mode A and mode C with further discussion supporting this classification presented later in this paper.
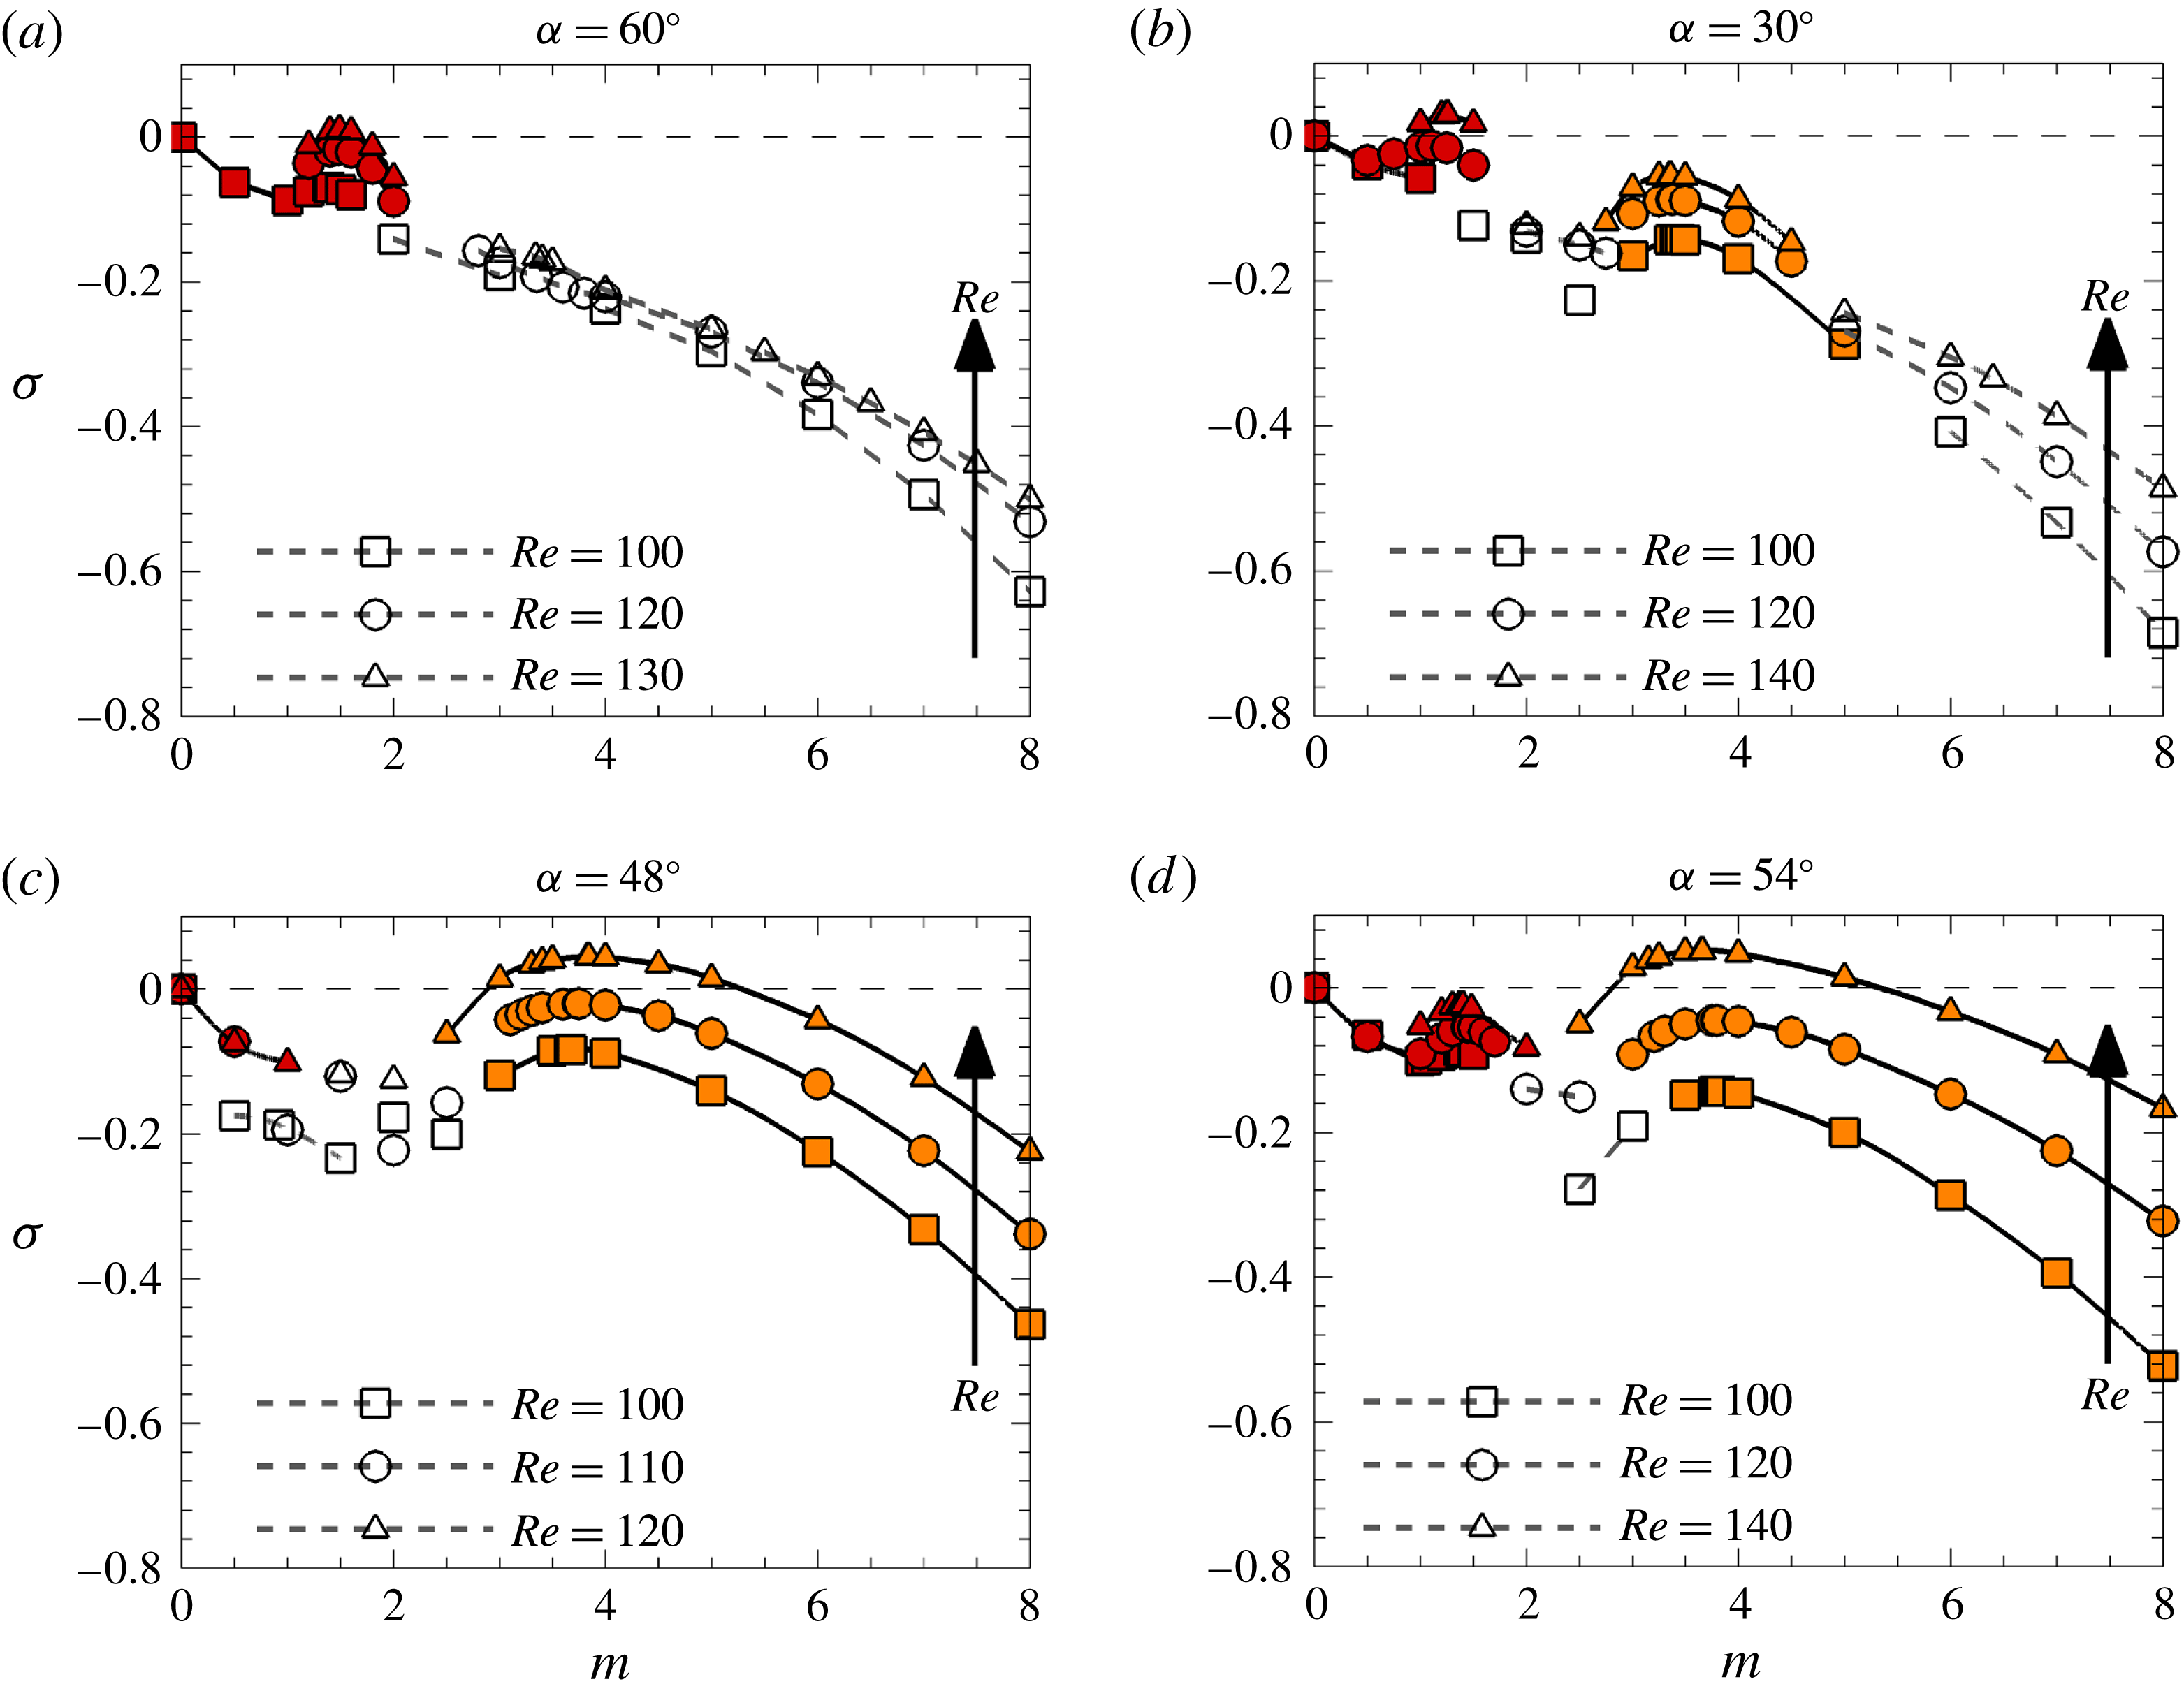
Growth rate versus wavenumber profiles for the wakes of a cylinder inclined at (a)
 $60^{\circ }$
showing the single regular peak profile, (b)
 $30^{\circ }$
showing the dual-peaked profile with the regular mode becoming unstable, (c)
 $48^{\circ }$
showing the single subharmonic peak profile, (d)
 $54^{\circ }$
showing the dual-peaked profile with the subharmonic mode becoming unstable. For all cases, the red (darker) symbols indicate a positive real multiplier (regular), orange (lighter) symbols indicate a negative real multiplier (subharmonic) and hollow symbols indicate a complex multiplier (quasi-periodic). Different symbols represent multipliers obtained at different
 $Re$
as indicated in the line legends.

Several generic profiles of the perturbation growth rate versus wavenumber develop at various ranges of cylinder inclination at Reynolds numbers below the aperiodic wake threshold. For cylinder inclinations of
 $0^{\circ }\leqslant \unicode[STIX]{x1D6FC}<24^{\circ }$
and
 $\unicode[STIX]{x1D6FC}=60^{\circ }$
(figure 4
a), a single local maximum comprising positive real Floquet multipliers in the perturbation growth rate profile was observed, having wavenumbers consistent with mode A. Negative real Floquet multipliers indicative of subharmonic modes were not obtained at these inclinations within the testable range of Reynolds numbers. At cylinder inclinations
 $18^{\circ }<\unicode[STIX]{x1D6FC}<34^{\circ }$
, the regular mode is observed to develop similarly to the lower range of inclinations, but a second local maximum composed of subharmonic eigenvalues emerges (as shown in figure 4
b). Trends of the peak growth rates versus Reynolds number for the subharmonic modes obtained within this range of inclinations describe a negative local maximum, indicating that the subharmonic mode remains stable. At higher cylinder inclinations
 $36^{\circ }<\unicode[STIX]{x1D6FC}<54^{\circ }$
, a single local maximum consisting of negative real Floquet multipliers is observed; the regular mode being almost entirely absent from the perturbation growth rate profile (figure 4
c). Figure 4(d) shows a scenario limited to cylinder inclinations
 $\unicode[STIX]{x1D6FC}\approx 36^{\circ }$
and
 $\unicode[STIX]{x1D6FC}\approx 54^{\circ }$
about which the dominant instability mode is expected to switch to (or from for the latter inclination) mode C with increasing Reynolds number. Only a small range of cylinder inclinations (
 $\unicode[STIX]{x1D6FC}\approx 34^{\circ }$
, and
 $54^{\circ }<\unicode[STIX]{x1D6FC}<60^{\circ }$
) demonstrated the potential for mode C to become unstable beyond mode A, and this exhibits a perturbation growth rate profile similar to that shown in figure 4(b), it also however exhibits a positive local maximum for the subharmonic peak. As mode C for these cases is predicted to occur beyond the point of mode A becoming unstable, the flows could be sufficiently altered by the initial transition such that the onset of mode C might be observed differently.
(a) Neutral stability map across the range of cylinder inclinations, and (b) the corresponding critical wavelength of the instability at its onset. Solid lines describe the neutral stability threshold for the regular mode A, while dash-dotted lines mark that for the subharmonic mode C. Symbols (
 $\times$
) mark cylinder inclinations where the stability analysis was performed.

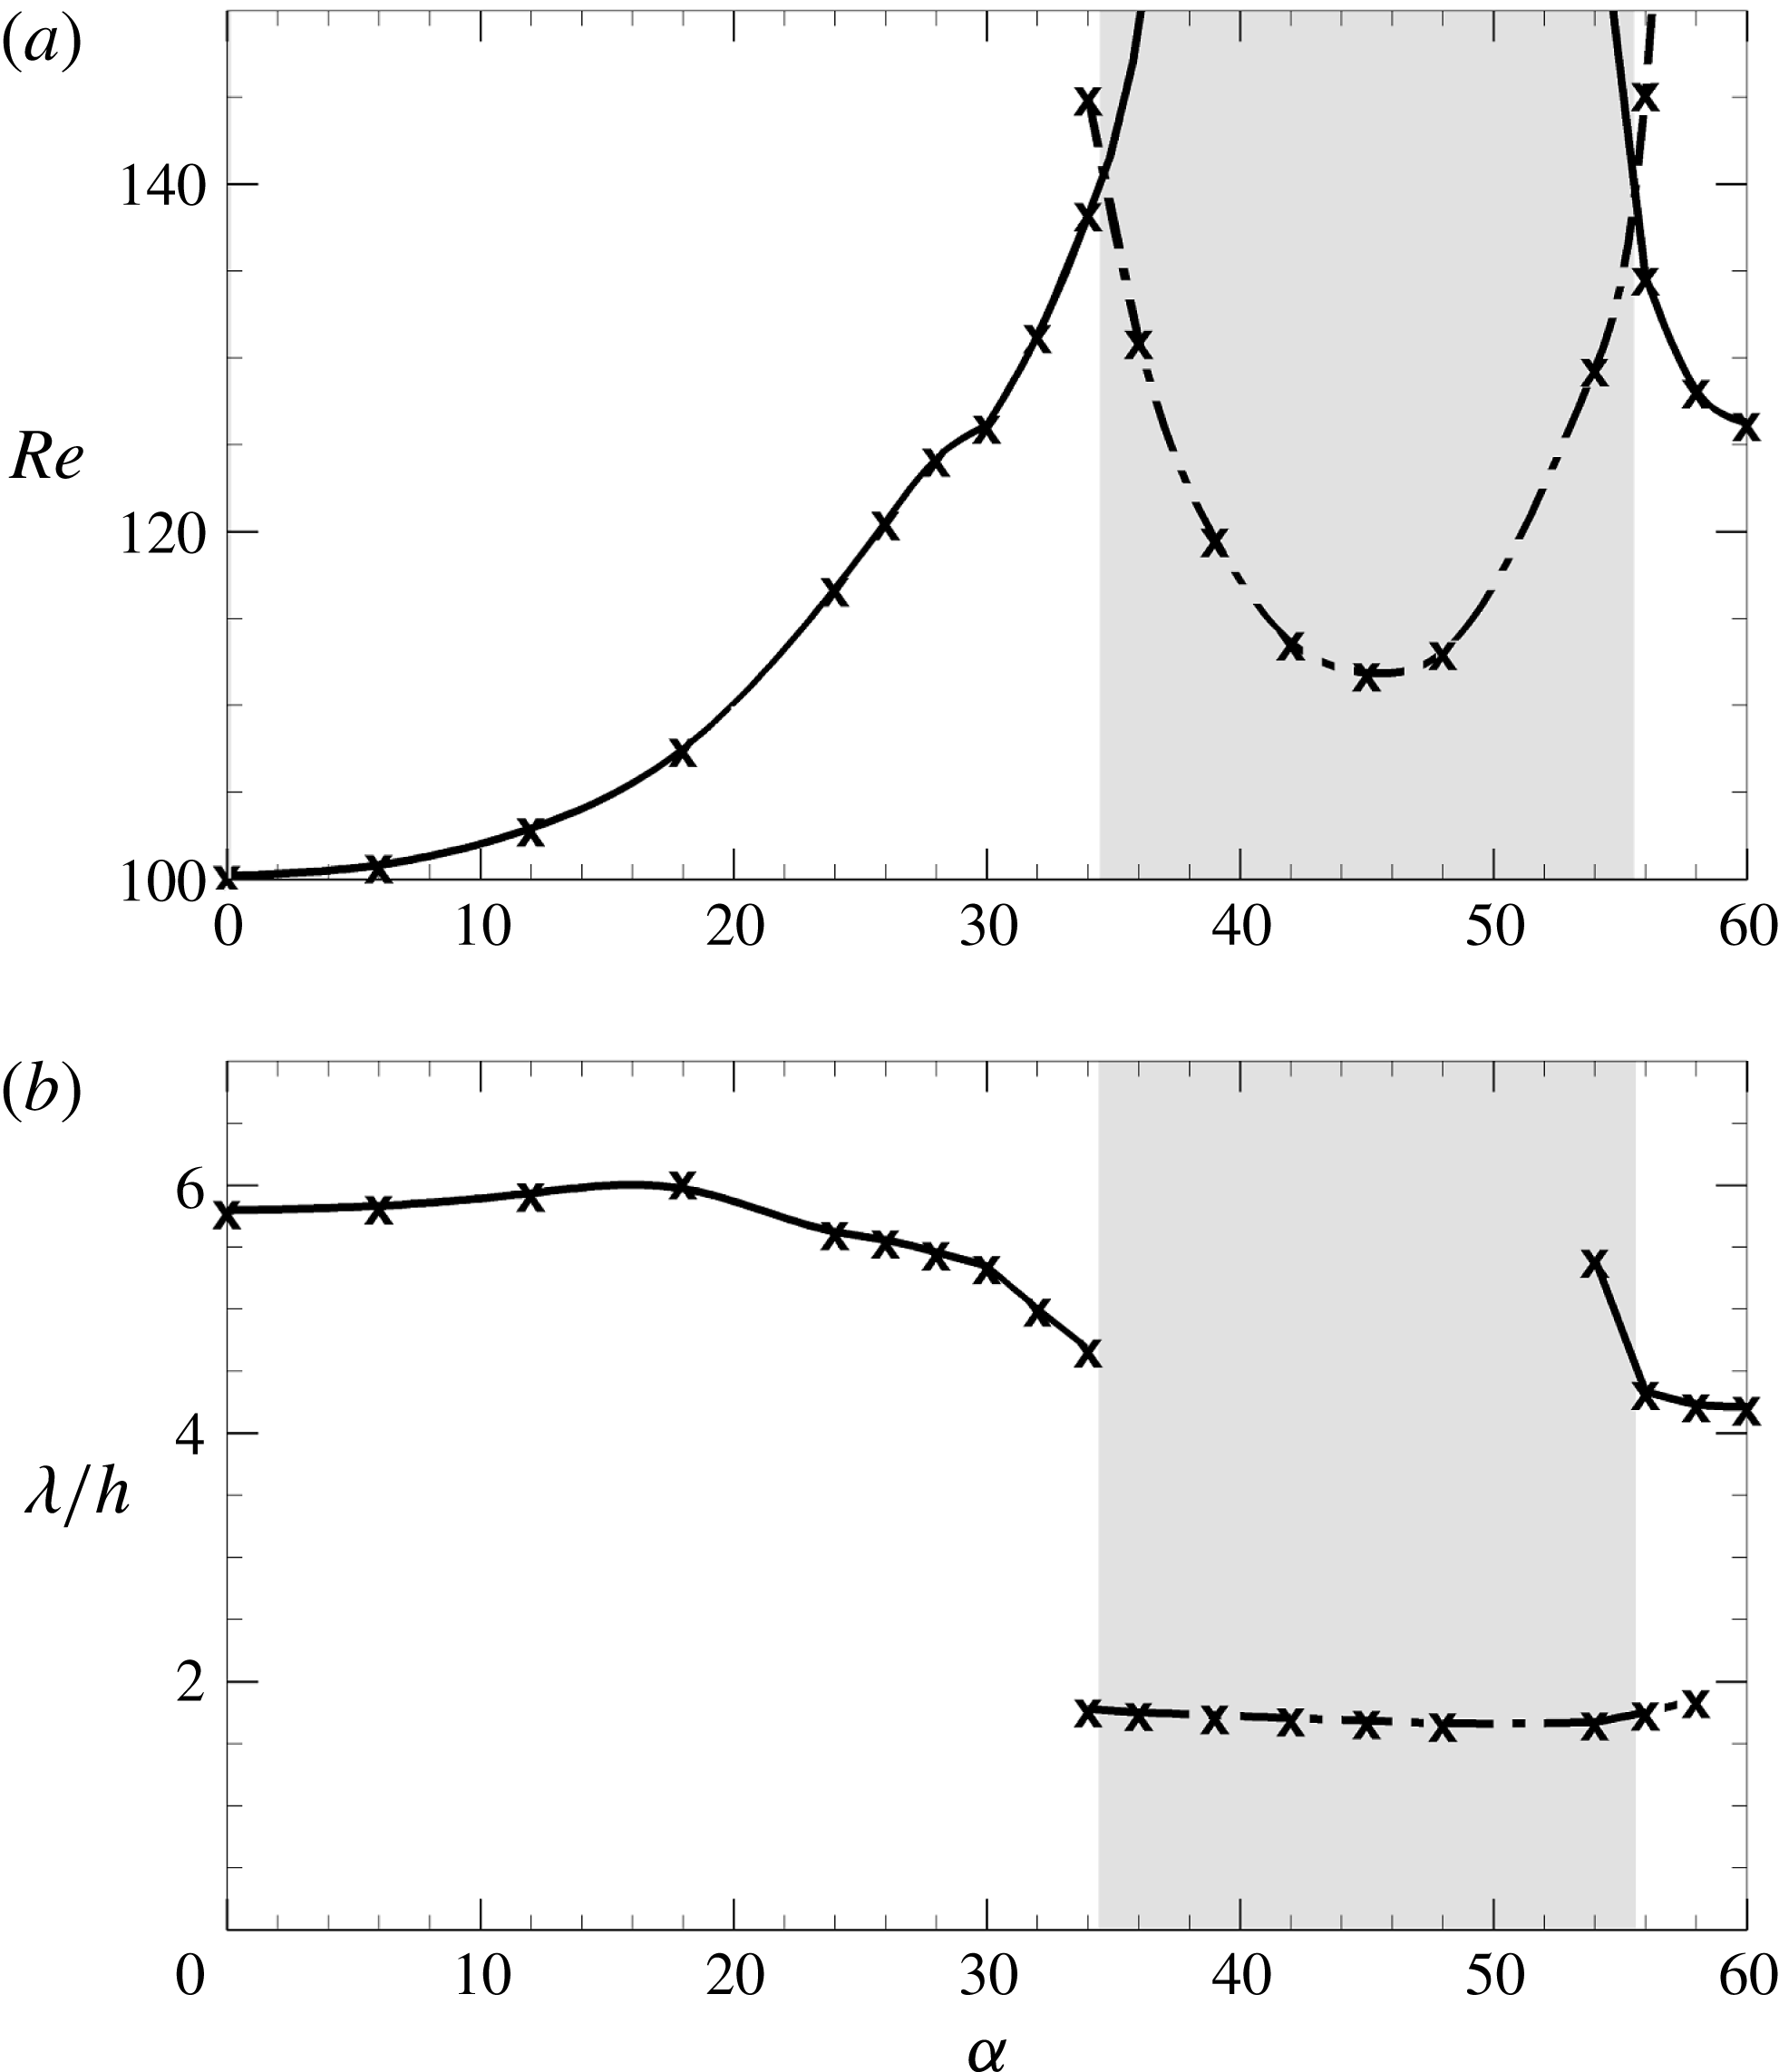
Figure 5(a) shows the neutral stability thresholds for the mode A and mode C instabilities across the range of inclination angles. Pleasingly, neutral stability always occurs where the two-dimensional flow is periodic. Across cylinder inclinations
 $0^{\circ }\leqslant \unicode[STIX]{x1D6FC}\lesssim 34.6^{\circ }$
, three-dimensional transition is predicted to occur via mode A, with its transition Reynolds number (
 $Re_{A}$
) increasing monotonically from
 $Re_{A}=100.2$
when
 $\unicode[STIX]{x1D6FC}=0^{\circ }$
, to
 $Re_{A}=126.1$
when
 $\unicode[STIX]{x1D6FC}=30^{\circ }$
, and to
 $Re_{A}=138.3$
when
 $\unicode[STIX]{x1D6FC}=34^{\circ }$
– the primary instability is predicted to switch to the subharmonic mode beyond this inclination. The rate at which
 $Re_{A}$
increases with cylinder inclination (
 $\text{d}Re_{A}/\text{d}\unicode[STIX]{x1D6FC}$
) shows a small shift at inclinations of approximately
 $\unicode[STIX]{x1D6FC}=30^{\circ }$
, which remains even after rescaling
 $Re_{A}$
by the cylinder side length
 $d$
. The stability analysis predicts that mode A resumes as the dominant instability mode for
 $\unicode[STIX]{x1D6FC}\gtrsim 55.4^{\circ }$
as the flow recovers some sense of symmetry, with
 $Re_{A}=134.7$
at
 $\unicode[STIX]{x1D6FC}=56^{\circ }$
, decreasing to
 $Re_{A}=126.3$
when
 $\unicode[STIX]{x1D6FC}=60^{\circ }$
. Within
 $34.6^{\circ }\lesssim \unicode[STIX]{x1D6FC}\lesssim 55.4^{\circ }$
, mode C is predicted to be the first-occurring three-dimensional mode. The transition Reynolds number for mode C (
 $Re_{C}$
) decreases from
 $Re_{C}=131.0$
at
 $\unicode[STIX]{x1D6FC}=36^{\circ }$
to reach a local minimum at
 $\unicode[STIX]{x1D6FC}\approx 45^{\circ }$
with
 $Re_{C}=111.9$
, and increases again to
 $Re_{C}=129.4$
when
 $\unicode[STIX]{x1D6FC}=54^{\circ }$
.
The variation in spanwise wavelengths of the predicted instability modes at transition are shown in figure 5(b). Similar to figure 5(a), two distinct branches corresponding to mode A are observed to be separated by the mode C branch, with the two distinct mode A branches exhibiting different ranges of wavelengths (the mode A being consistently two to three times larger than mode C). For brevity, we will refer to the mode A branch for inclinations within
 $0^{\circ }\leqslant \unicode[STIX]{x1D6FC}\lesssim 34.6^{\circ }$
as mode
 $\text{A}_{1}$
, and that for inclinations within
 $55.4^{\circ }\lesssim \unicode[STIX]{x1D6FC}\leqslant 60^{\circ }$
as mode
 $\text{A}_{2}$
. The critical spanwise wavelengths of mode
 $\text{A}_{1}$
(
 $\unicode[STIX]{x1D706}_{A}$
) vary quite noticeably with the cylinder inclination, increasing from
 $\unicode[STIX]{x1D706}_{A}=5.80h$
at
 $\unicode[STIX]{x1D6FC}=0^{\circ }$
to
 $\unicode[STIX]{x1D706}_{A}=5.97h$
when
 $\unicode[STIX]{x1D6FC}=18^{\circ }$
(approximate inclination for which the wake shows the largest critical spanwise wavelengths for mode
 $\text{A}_{1}$
), and decreasing again thereafter. The curve through these points show a similar gradient discontinuity in
 $\text{d}\unicode[STIX]{x1D706}_{A}/\text{d}\unicode[STIX]{x1D6FC}$
, again at
 $\unicode[STIX]{x1D6FC}=30^{\circ }$
. Upon mode
 $\text{A}_{2}$
resuming as the dominant instability mode after the subharmonic mode branch, the critical spanwise wavelengths decrease with increasing cylinder inclination from
 $\unicode[STIX]{x1D706}_{A}=4.34h$
at
 $\unicode[STIX]{x1D6FC}=56^{\circ }$
to
 $\unicode[STIX]{x1D706}_{A}=4.21h$
at
 $\unicode[STIX]{x1D6FC}=60^{\circ }$
. The mode C instability predicted in the wakes of the cylinder at inclinations
 $34.6^{\circ }\lesssim \unicode[STIX]{x1D6FC}\lesssim 55.4^{\circ }$
show an approximately consistent critical spanwise wavelength, varying from
 $\unicode[STIX]{x1D706}_{C}=1.75h$
at
 $\unicode[STIX]{x1D6FC}=36^{\circ }$
to
 $\unicode[STIX]{x1D706}_{C}=1.68h$
at
 $\unicode[STIX]{x1D6FC}=45^{\circ }$
, and increasing to
 $\unicode[STIX]{x1D706}_{C}=1.67h$
at
 $\unicode[STIX]{x1D6FC}=54^{\circ }$
. As a comparison, the critical spanwise wavelength of mode
 $\text{A}_{1}$
ranges between
 $5.80d\leqslant \unicode[STIX]{x1D706}_{A}\leqslant 5.97d$
for
 $\unicode[STIX]{x1D6FC}\leqslant 30^{\circ }$
, appearing consistent with the values reported for mode A in the wakes of square cylinders (Sheard et al.
Reference Sheard, Fitzgerald and Ryan2009) (approximately
 $5d$
–
 $6d$
) while mode
 $\text{A}_{2}$
becomes unstable at wavelengths
 $4.21h\leqslant \unicode[STIX]{x1D706}_{A}\leqslant 4.34h$
which compares well with the
 $4h$
to
 $5h$
wavelengths reported for circular and elliptical cylinder wakes (Barkley & Henderson Reference Barkley and Henderson1996; Williamson Reference Williamson1996; Thompson et al.
Reference Thompson, Radi, Rao, Sheridan and Hourigan2014) as well as the square cylinder at lower inclinations angles (Sheard Reference Sheard2011). The critical spanwise wavelengths of mode C appear slightly lower than the approximately
 $2d$
wavelength reported for inclined square cylinders at incidence in Sheard et al. (Reference Sheard, Fitzgerald and Ryan2009).
Variation of the peak instability growth rates with
 $\unicode[STIX]{x1D716}$
about the predicted transition Reynolds number. Red triangles (▴, darker) mark peak mode A growth rates, orange triangles (▴, lighter) mark peak mode C growth rates and hollow circles (○) mark those for the circular cylinder’s mode A. The lines through the data are the fitted linear approximations for each predicted instability mode: the solid line for mode A in this study, dash-dotted lines for mode C and the dotted line for mode A of the circular cylinder.

3.2 Growth rate dependence on the Reynolds number
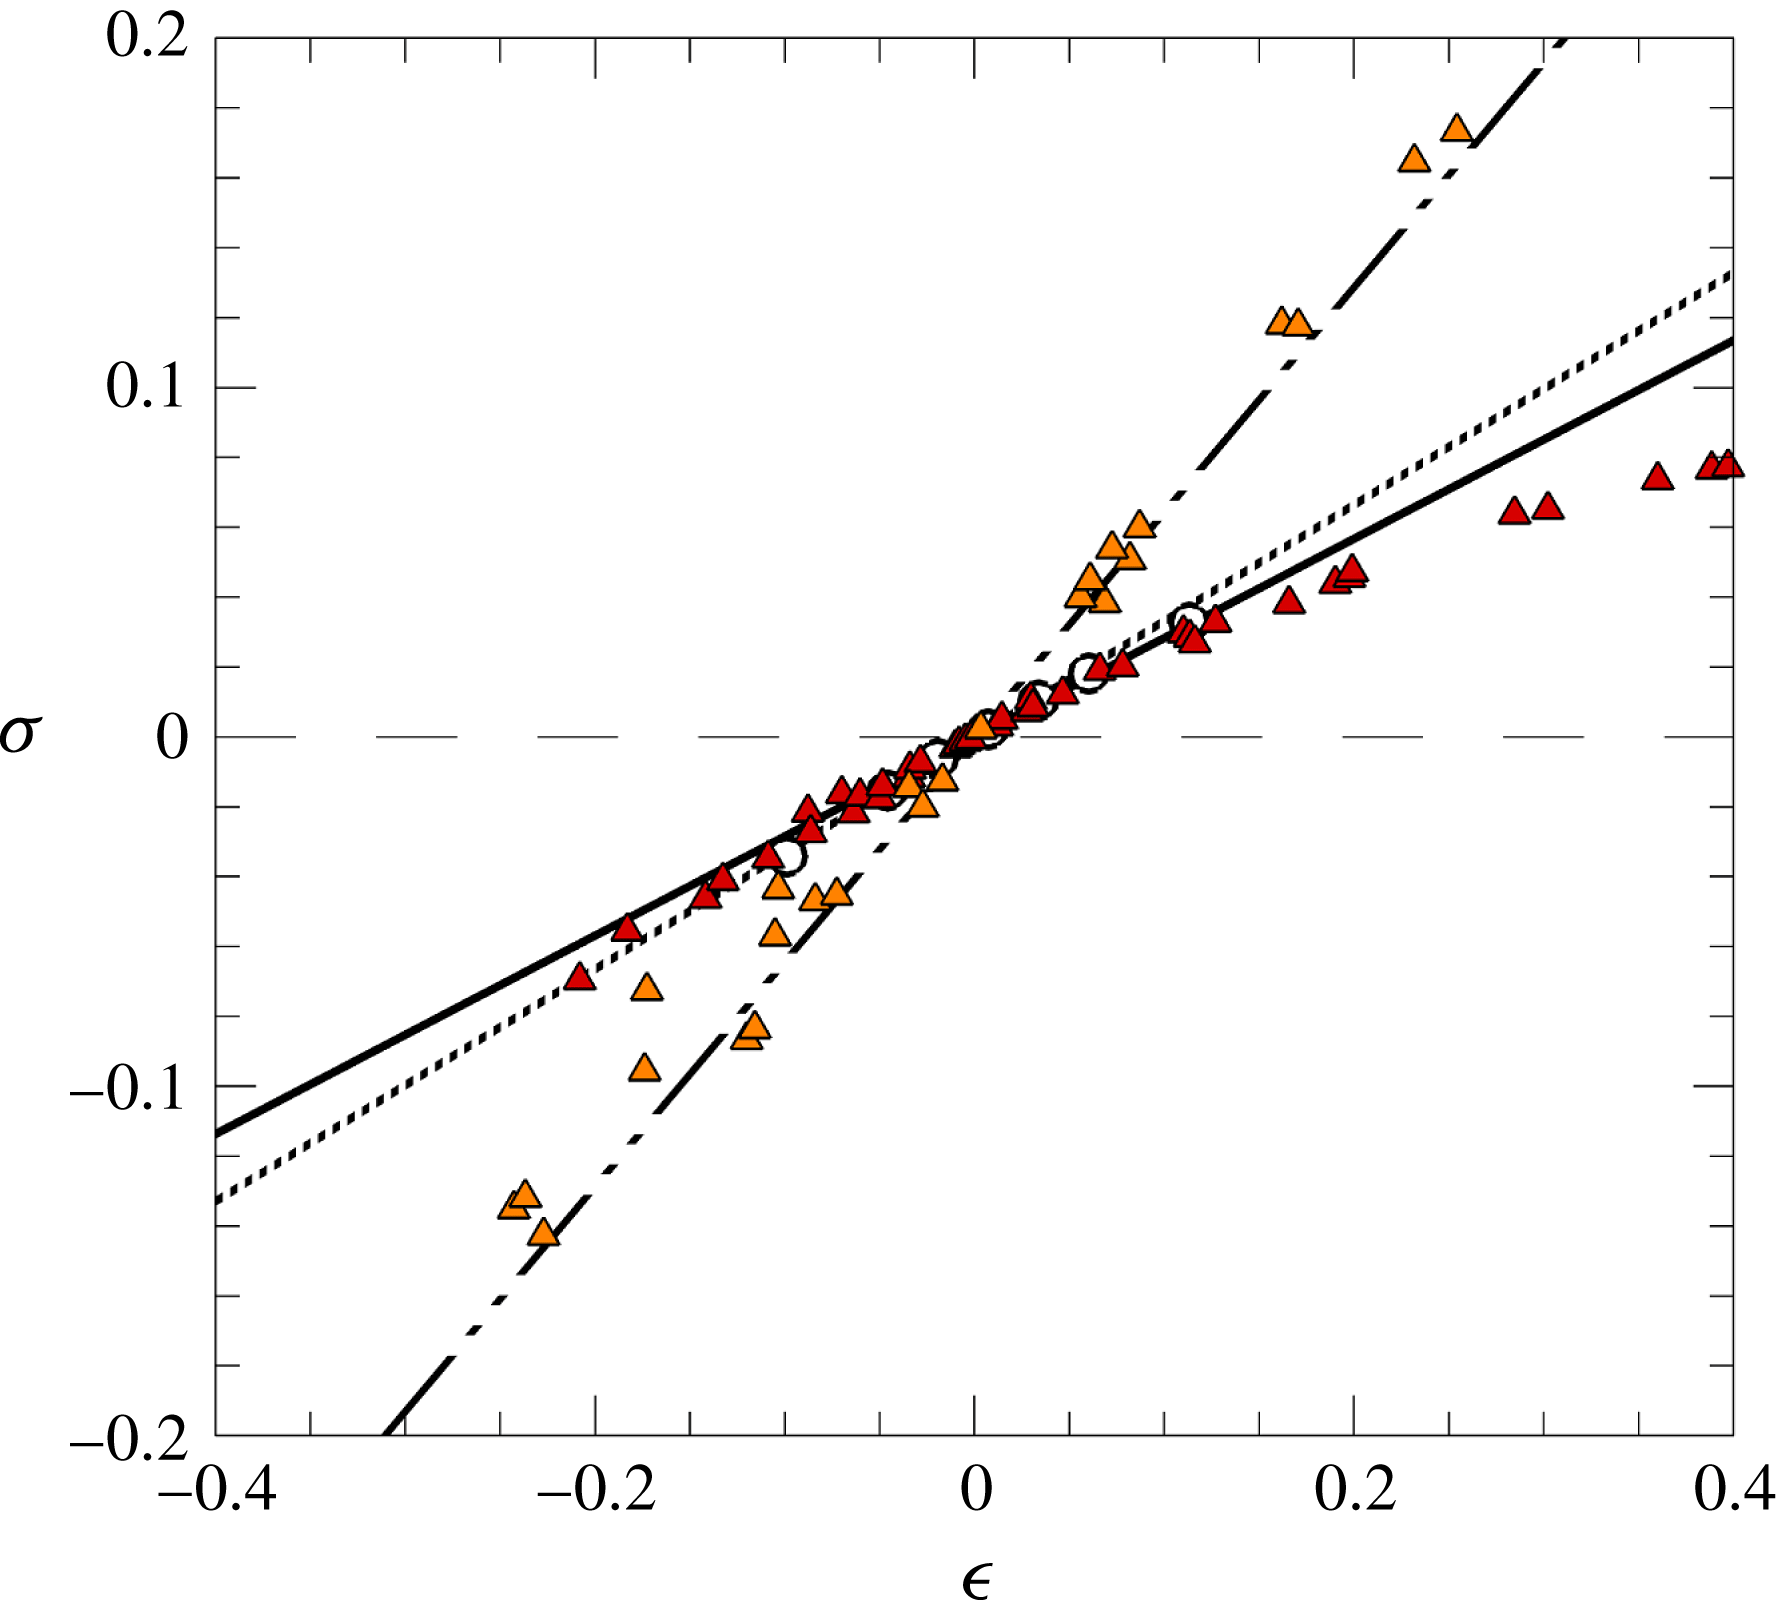
As described earlier, the peak growth rates for each instability branch in the growth rate against Floquet multiplier plots were predicted and used to estimate the critical parameters for their neutral state as shown in figure 5(a,b). To determine any generality in the growth of the linear instability modes, the variation of the growth rates with an
 $\unicode[STIX]{x1D716}$
parameter quantifying the distance between the Reynolds number and its corresponding transition Reynolds number (
 $\unicode[STIX]{x1D716}=(Re-Re_{t})/Re_{t}$
, where
 $Re_{t}$
is the transition Reynolds number corresponding to modes
 $t=\text{A},\text{C}$
) for all cylinder inclinations, was determined and is shown in figure 6. Near the transition point, the function may be approximated using a linear fit while enforcing that
 $\unicode[STIX]{x1D70E}=0$
. For data within
 $|\unicode[STIX]{x1D716}|\leqslant 0.1$
, the growth rates of mode A for all cylinder inclinations collectively aggregate about
 $\text{d}\unicode[STIX]{x1D70E}/\text{d}\unicode[STIX]{x1D716}=0.2840$
, while separately mode A
 $_{1}$
appears to be well described by
 $\text{d}\unicode[STIX]{x1D70E}/\text{d}\unicode[STIX]{x1D716}=0.2712$
and mode
 $\text{A}_{2}$
by
 $\text{d}\unicode[STIX]{x1D70E}/\text{d}\unicode[STIX]{x1D716}=0.3461$
(
 $R^{2}\geqslant 0.98$
for all cases). As a comparison, a similar function through the peak growth rates of the mode A instability in the wake of the circular cylinder computed at
 $170\leqslant Re\leqslant 210$
is described by
 $\text{d}\unicode[STIX]{x1D70E}/\text{d}\unicode[STIX]{x1D716}=0.3322$
. In contrast to mode A, the mode C data showed a larger scatter about the linear trend through the intercept, yielding a linear function
 $\unicode[STIX]{x1D70E}=0.6434\unicode[STIX]{x1D716}$
(
 $R^{2}=0.984$
). The scatter of these points about the linear trend can be attributed to the effect of the cylinder inclination, changing which gives rise to slightly different base flows which ultimately affect the dynamics of the system. It is then interesting to note that the peak mode A growth rates for all cylinder inclinations aggregated strongly about a common linear trend, indicating that the different cylinder inclinations, and to a certain extent the cylinder geometry, have little effect on the growth of the mode A instability with increases in Reynolds number at low
 $\unicode[STIX]{x1D716}$
. These results also demonstrate that mode C generally develops more rapidly than mode A with increasing Reynolds number at approximately twice the rate, a point which will be further explored in § 3.5 in relation to the nonlinear growth and saturation of the instability modes. The peak growth rates at each individual cylinder inclination still vary monotonically with increasing Reynolds number.
Superposition of the two-dimensional base flow and the three-dimensional instability mode showing the mode A structure. The flow direction is from left to right. Images are shown for cylinder inclinations (a)
 $0^{\circ }$
, (b)
 $30^{\circ }$
and (c)
 $60^{\circ }$
at Reynolds numbers and wavenumbers as labelled. Blue (darker) and yellow (lighter) isosurfaces are the positive and negative streamwise perturbation vorticities, respectively, and the translucent red isosurfaces describe the two-dimensional vortex loops at
 $|\bar{\unicode[STIX]{x1D714}}_{z}|=1$
.

3.3 Structure and symmetry of the unstable modes
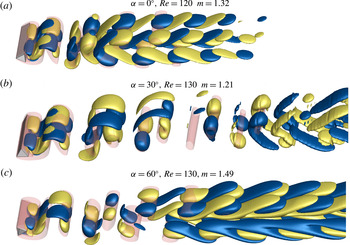
Further evidence of the regular instability mode being consistent with the circular cylinder’s mode A, aside from the nature of the Floquet multiplier, can be observed through the structure of the instability. Visualizations of the perturbation fields from the stability analysis presented here are obtained by superimposing the Fourier mode of the instability onto its corresponding two-dimensional base flow. These perturbation fields are shown for cylinder inclinations
 $\unicode[STIX]{x1D6FC}=0^{\circ },30^{\circ }$
and
 $60^{\circ }$
for the regular mode in figure 7, being representative of the structures of modes
 $\text{A}_{1}$
and
 $\text{A}_{2}$
. The instability is observed to develop primarily within the cores of the two-dimensional vortex loops, which alludes to the elliptical instability mechanism suggested by Leweke & Williamson (Reference Leweke and Williamson1998) and Thompson, Leweke & Williamson (Reference Thompson, Leweke and Williamson2001). The distinction between modes
 $\text{A}_{1}$
and
 $\text{A}_{2}$
lies in the spatial region where the instability is observed to develop more dominantly – the perturbation structures for mode
 $\text{A}_{1}$
develop more intensely in the near wake of the cylinder and decay in strength as it moves downstream, while the perturbation structures for mode
 $\text{A}_{2}$
appear to develop more intensely in the downstream regions of the flow.
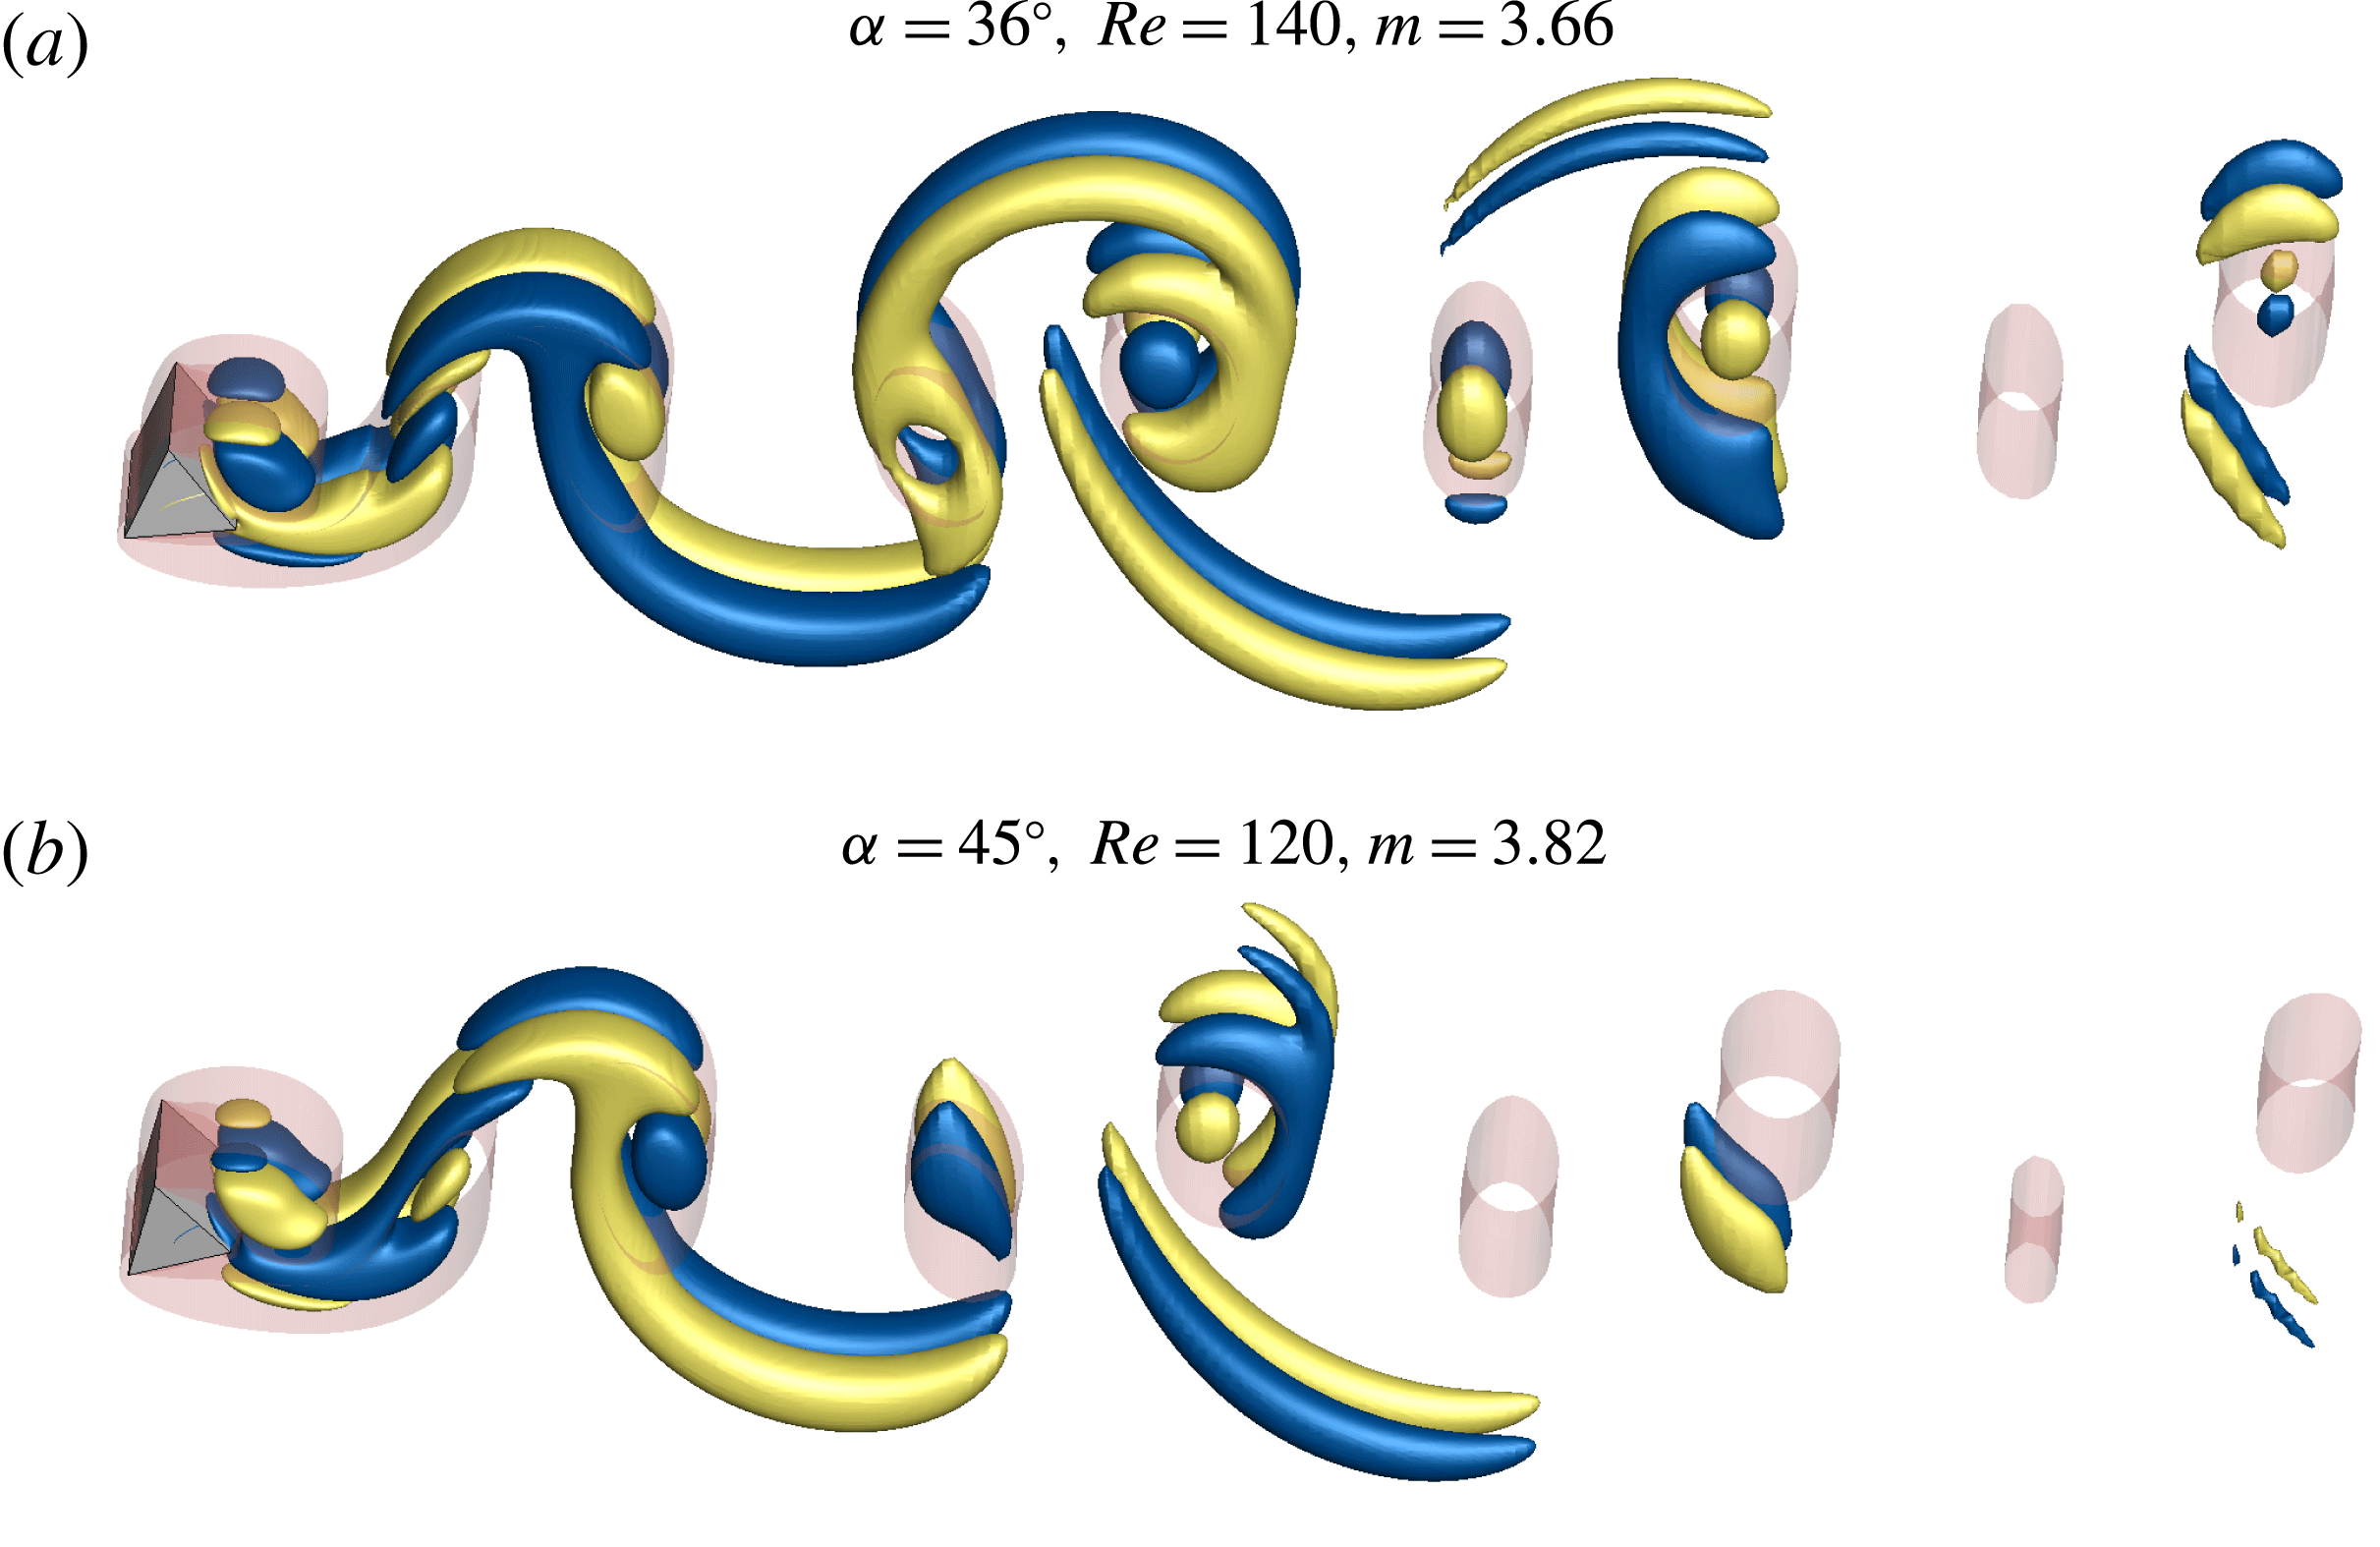
The perturbation fields of the mode C instability are shown for the cylinder inclined at
 $\unicode[STIX]{x1D6FC}=36^{\circ }$
and
 $\unicode[STIX]{x1D6FC}=45^{\circ }$
in figure 8. For all cylinder inclinations becoming unstable through this mode, the instability manifests strongly in the near wake, but rapidly decays in strength as it advects downstream.
Mode C structure, shown for the wakes of the cylinder at inclinations (a)
 $36^{\circ }$
and (b)
 $45^{\circ }$
at Reynolds numbers and wavenumbers as labelled. Isosurfaces and colours are as described in figure 7.

3.4 Quantifying asymmetries in the cylinder wake
Prior studies on the stability of the wakes of various cylindrical configurations have shown the prevalence of mode C to be intrinsically linked to the geometric asymmetry about the horizontal centreline (Sheard et al.
Reference Sheard, Thompson and Hourigan2003, Reference Sheard, Fitzgerald and Ryan2009; Rao et al.
Reference Rao, Leontini, Thompson and Hourigan2017). As such, it is surprising to note that mode C in this study becomes unstable at incidence angles
 $\unicode[STIX]{x1D6FC}>30^{\circ }$
, despite the cylinder at an inclination of
 $\unicode[STIX]{x1D6FC}=30^{\circ }$
possessing the largest geometric asymmetry, as observed through the maximum lift coefficients incurred on the cylinder (hence largest flow asymmetry about the body) about this incidence angle (Ng et al.
Reference Ng, Vo, Hussam and Sheard2016). Mode symmetry studies by Marques, Lopez & Blackburn (Reference Marques, Lopez and Blackburn2004) and Blackburn et al. (Reference Blackburn, Marques and Lopez2005) have described the generic bifurcations for wakes possessing spatio-temporal symmetries consistent with the ideal Kármán vortex street, with Blackburn & Sheard (Reference Blackburn and Sheard2010) further showing the smooth transition from the generic quasi-periodic mode to one of a subharmonic nature as the wake symmetry was gradually broken beyond a small finite level. Considering that the stability of these wakes are entirely described from the characteristics of their base flows, the results obtained from the present stability analysis then pose a question regarding the extent to which the two-dimensional base flow can be asymmetric before mode C becomes the preferred instability over mode A, and whether a robust measure of this asymmetry exists. Experiments on flows past a circular cylinder with a trip wire by Yildirim et al. (Reference Yildirim, Rindt and van Steenhoven2013a
) elucidated the mode C structure similar to Zhang et al. (Reference Zhang, Fey, Noack, König and Eckelmann1995), but further attempted to characterize the three-dimensional mode. The study showed an imbalance in the streamwise flow fluctuations about the wake centreline, and also showed the unequal strengths of counter-rotating spanwise vortices at a position 10 cylinder diameters downstream. The present study extends this idea of asymmetry by first proposing and quantifying several measures alluding to a deviation in symmetry, and further attempts to draw a connection from these deviations in ideal symmetries to the observed instability modes from the stability analysis.
The ideal Kármán vortex street possesses the spatio-temporal symmetry
 $$\begin{eqnarray}\displaystyle \left.\begin{array}{@{}c@{}}u(x,y,t)=u(x,-y,t+T/2)=u(x,y,t+T),\\ v(x,y,t)=-v(x,-y,t+T/2)=v(x,y,t+T),\\ p(x,y,t)=p(x,-y,t+T/2)=p(x,y,t+T),\end{array}\right\} & & \displaystyle\end{eqnarray}$$
where
 $(u,v,p)(x,y,t)$
are the streamwise and transverse velocity fields and the pressure field, respectively, and
 $T$
is the period of the base flow. The spanwise vorticity,
 $\unicode[STIX]{x1D714}_{z}=\unicode[STIX]{x2202}v/\unicode[STIX]{x2202}x-\unicode[STIX]{x2202}u/\unicode[STIX]{x2202}y$
, exhibits the symmetry
 $$\begin{eqnarray}\displaystyle \unicode[STIX]{x1D714}_{z}(x,y,t)=-\unicode[STIX]{x1D714}_{z}(x,-y,t+T/2)=\unicode[STIX]{x1D714}_{z}(x,y,t+T). & & \displaystyle\end{eqnarray}$$
Ideally then, the shed vortices would each possess a peak vorticity given by
 $$\begin{eqnarray}\displaystyle \left.\begin{array}{@{}c@{}}\unicode[STIX]{x1D714}_{z}^{+}(x)=\unicode[STIX]{x1D714}_{z}(x,y^{+}(x),t^{+}(x)),\\ \unicode[STIX]{x1D714}_{z}^{-}(x)=\unicode[STIX]{x1D714}_{z}(x,y^{-}(x),t^{-}(x)),\end{array}\right\} & & \displaystyle\end{eqnarray}$$
where
 $\unicode[STIX]{x1D714}_{z}^{+}$
and
 $\unicode[STIX]{x1D714}_{z}^{-}$
denote the peak positive and negative vorticities in the vortex loops, respectively, with the corresponding times of these peaks denoted by
 $t^{+}$
and
 $t^{-}$
, with
 $y^{+}$
and
 $y^{-}$
being its transverse position; such that
 $|\unicode[STIX]{x1D714}_{z}^{+}|=|\unicode[STIX]{x1D714}_{z}^{-}|$
,
 $y^{+}=-y^{-}$
, and
 $t^{+}/T=t^{-}/T+1/2$
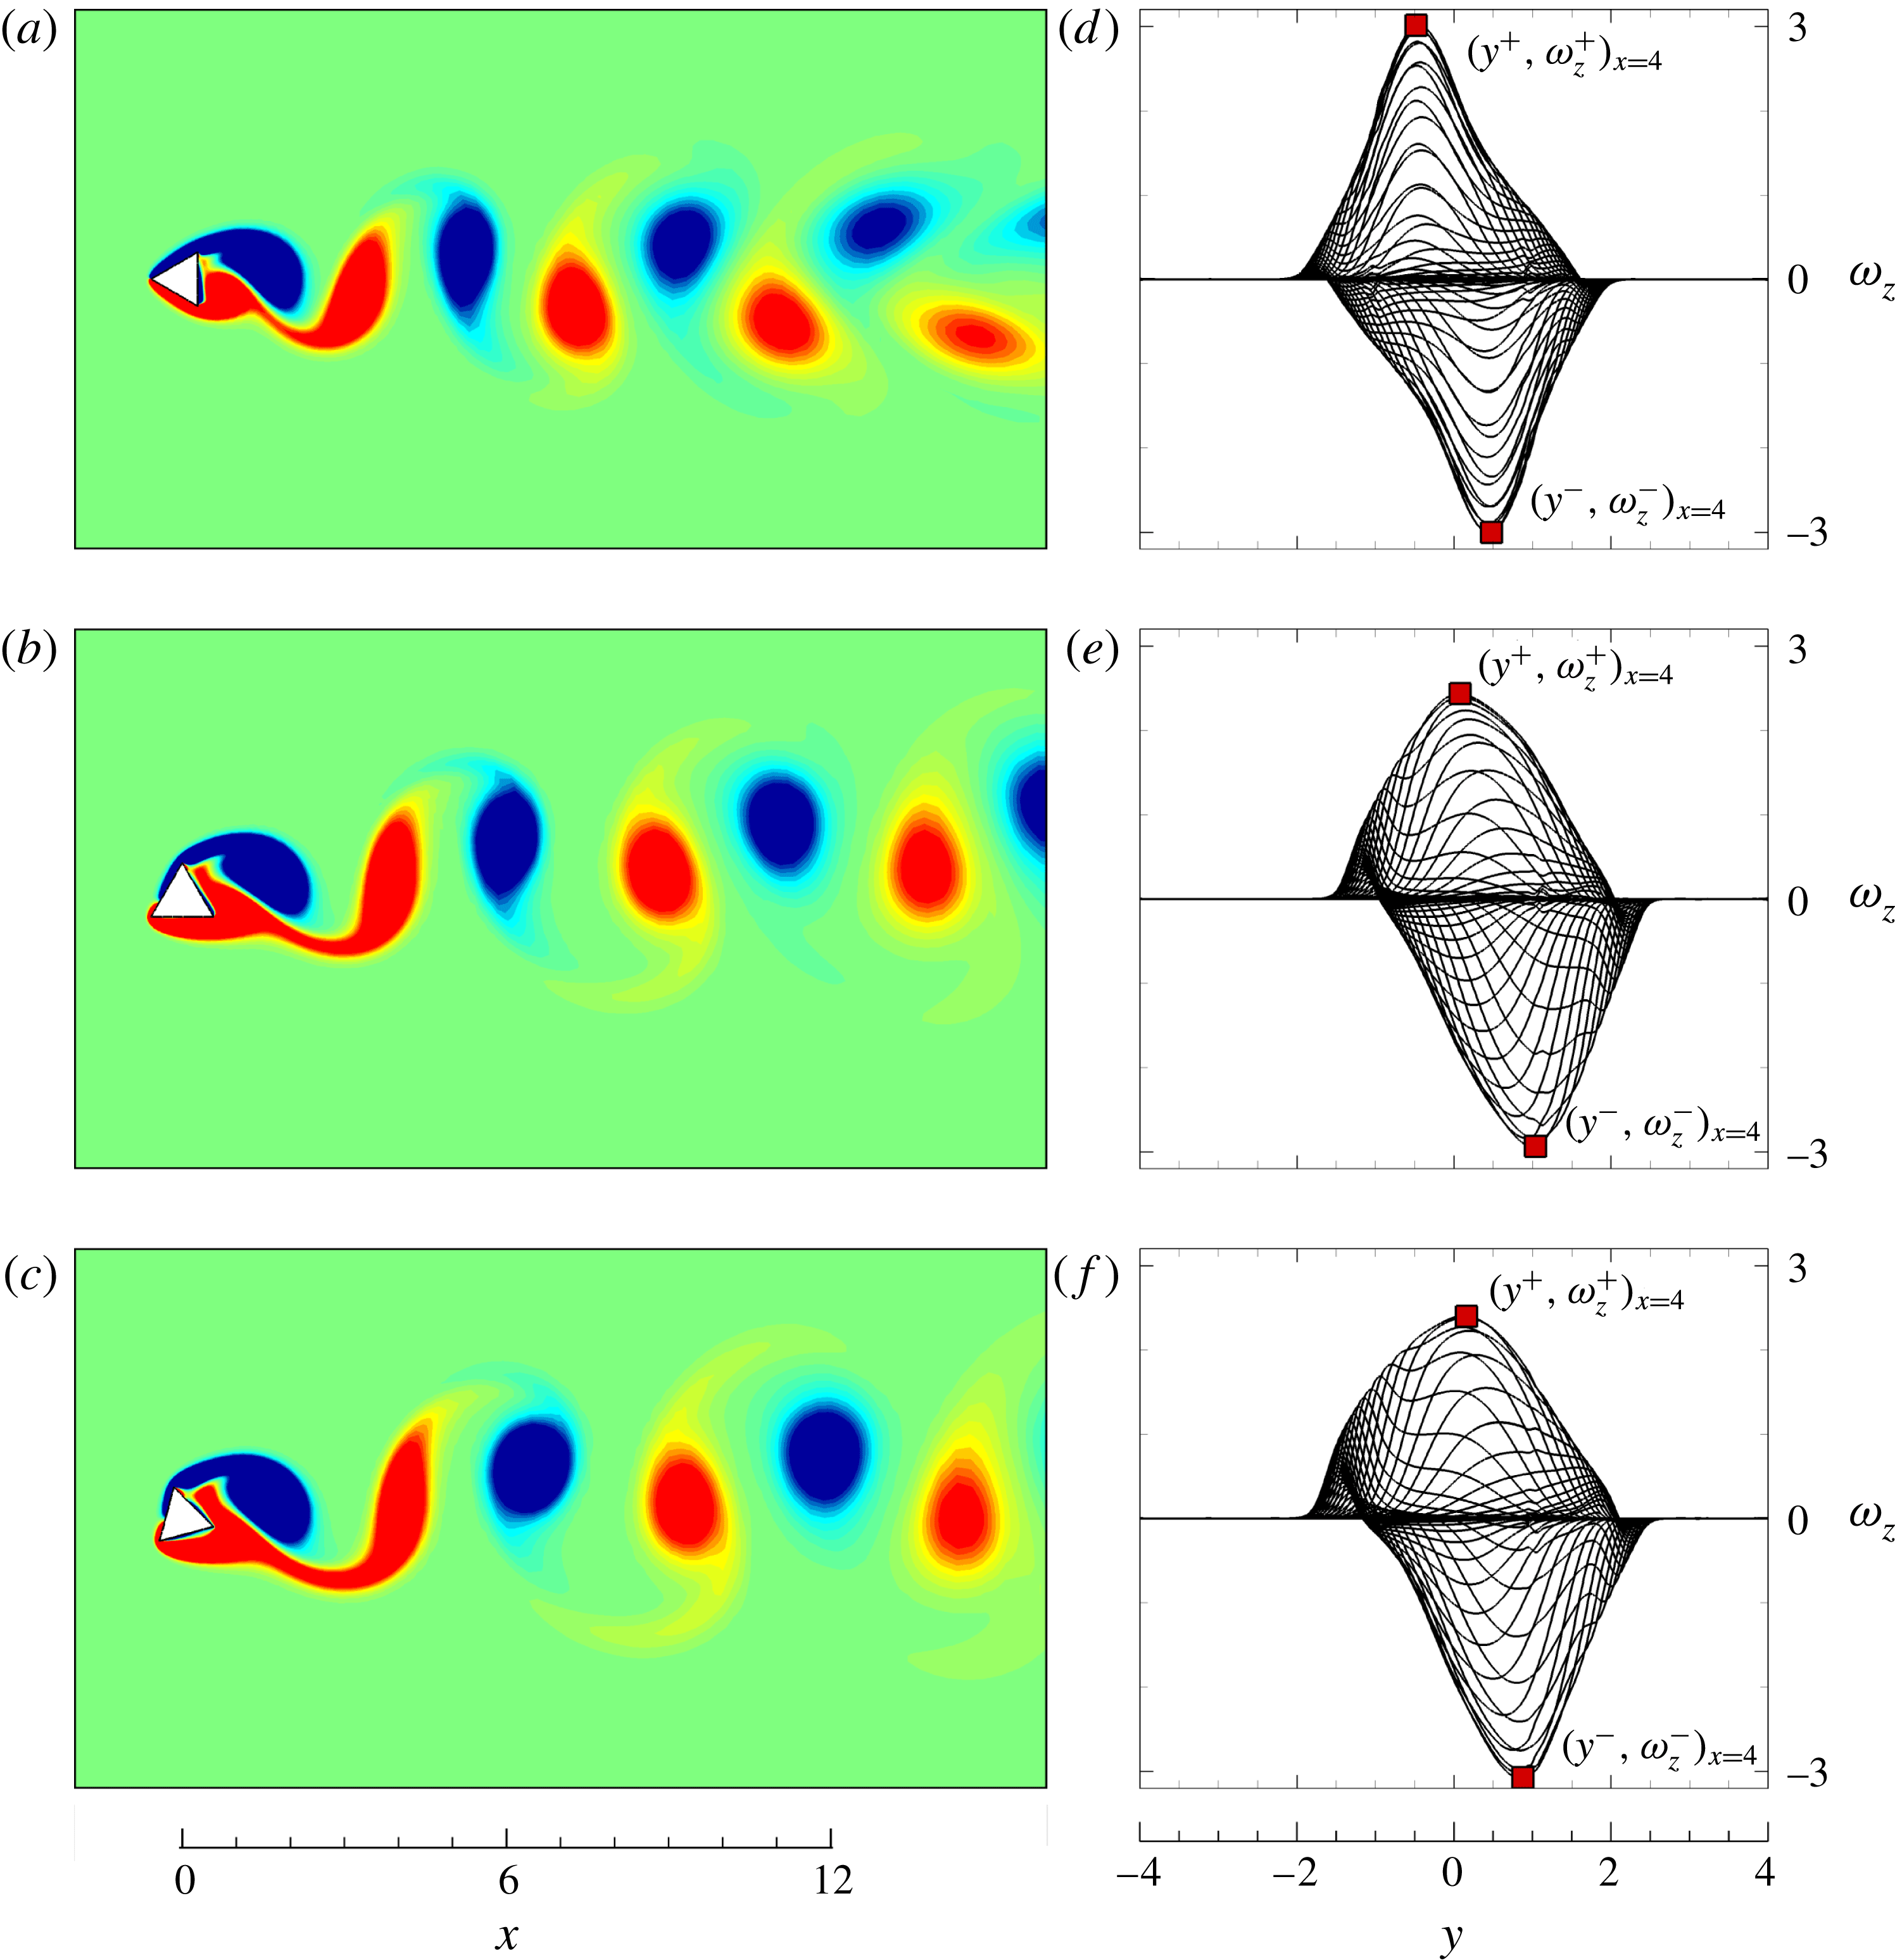
. Indeed, these relations are observed to hold in the laminar wake of the circular cylinder. However, the wakes of the two-dimensional base flows for non-reflection-symmetric cylinder inclinations in this study exhibit small deviations, as expected.
(a–c) Spanwise vorticity contours for the cylinder inclined at (a)
 $0^{\circ }$
, (b)
 $30^{\circ }$
and (c)
 $45^{\circ }$
. Red (lighter) and blue (darker) contours indicate positive and negative vorticity values, respectively. (d–f) Spanwise vorticity profiles in the cross-flow (
 $y$
) direction, taken at a downstream position
 $x=4h$
at 52 equispaced time intervals over one shedding cycle, each corresponding to the flows in the left images. The red squares (▪) indicate peak vorticity values
 $\unicode[STIX]{x1D714}^{+}(x=4h,y^{+},t^{+})$
and
 $\unicode[STIX]{x1D714}^{-}(x=4h,y^{-},t^{-})$
as labelled.

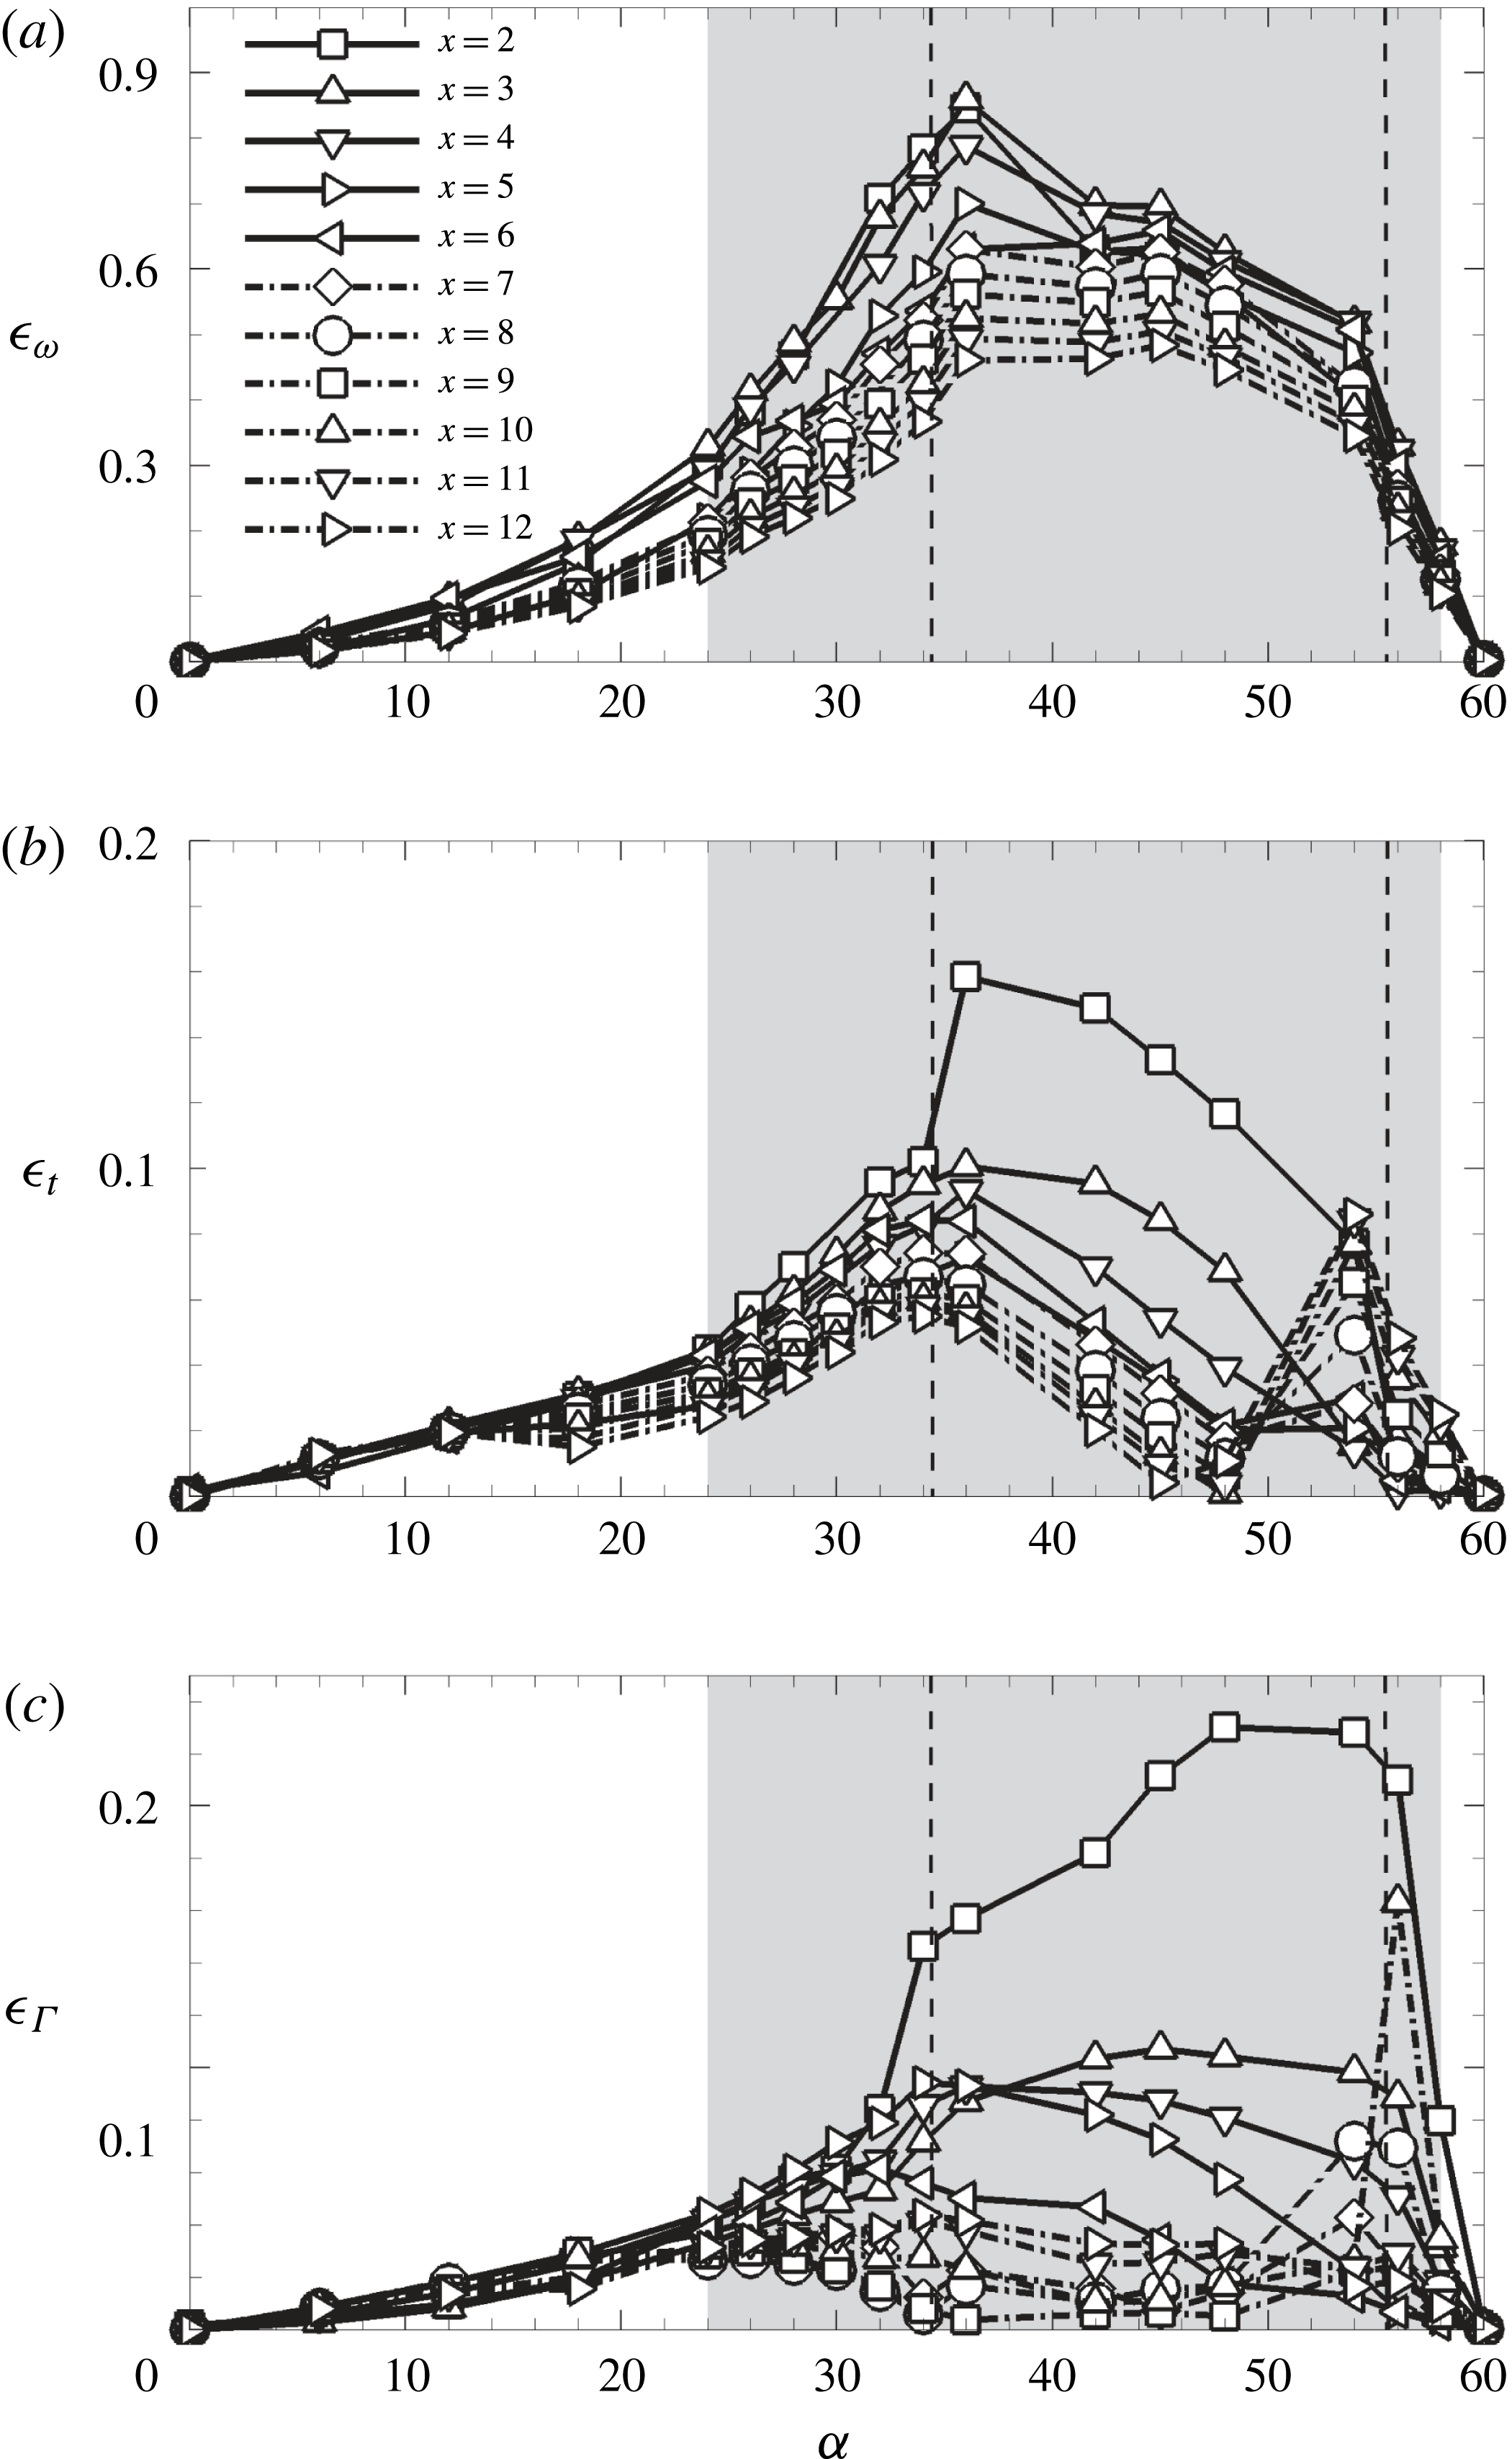
Variation of (a)
 $\unicode[STIX]{x1D716}_{\unicode[STIX]{x1D714}}$
, (b)
 $\unicode[STIX]{x1D716}_{t}$
, and (c)
 $\unicode[STIX]{x1D716}_{\unicode[STIX]{x1D6E4}}$
with cylinder inclination
 $\unicode[STIX]{x1D6FC}$
. Solid lines weave through deviation values for
 $x/h\leqslant 7$
, while dash-dotted lines connect deviation values for
 $x/h>7$
where some wakes exhibit a change in their two-dimensional structure. The shaded region spans cylinder inclinations where the subharmonic mode branch can be observed from the stability analysis (figure 4
b,d), while the region enclosed within the vertical dashed lines (
 $\unicode[STIX]{x1D6FC}\approx 34^{\circ }$
and
 $54^{\circ }$
) covers cylinder inclinations where the three-dimensional flow transition is predicted to occur via mode C (figure 4
c).

Given that a ‘half-period’ in a
 $T$
-periodic wake corresponds to
 $T/2$
where, ideally,
 $T/2=t^{+}-t^{-}$
, and that the magnitudes of the peak vorticities in each vortex core should ideally be equal at the same streamwise position, some measures of deviations from the Kármán vortex street symmetry could be posed as
 $$\begin{eqnarray}\displaystyle \left.\begin{array}{@{}c@{}}\displaystyle \unicode[STIX]{x1D716}_{t}(x)=\left|\frac{t^{+}(x)-t^{-}(x)}{T}-0.5\right|,\\ \unicode[STIX]{x1D716}_{\unicode[STIX]{x1D714}}(x)=|\unicode[STIX]{x1D714}_{z}^{+}(x)+\unicode[STIX]{x1D714}_{z}^{-}(x)|,\end{array}\right\} & & \displaystyle\end{eqnarray}$$
where
 $\unicode[STIX]{x1D716}_{t}$
estimates the imbalance in the anti-phases of consecutive counter-rotating vortices, and
 $\unicode[STIX]{x1D716}_{\unicode[STIX]{x1D714}}$
measures the imbalance in the peak vorticity within each shedding cycle, both being functions of the streamwise position
 $x$
. Measures based on the symmetry deviations of the
 $(u,v)$
two-dimensional velocity fields were not utilized due to the lack of a planar wake centreline for non-symmetric cylinder inclinations. Figure 9 shows that consecutive counter-rotating vortices in the two-dimensional base flow differ in size and shape spatially, and consequently in their peak strength. Taking these factors into consideration, the
 $\unicode[STIX]{x1D716}_{\unicode[STIX]{x1D714}}$
measure might be improved to account for the variability of the vortices by considering the accumulation of vorticity over a shedding cycle at various streamwise positions in the wake, as given by
 $$\begin{eqnarray}\displaystyle \unicode[STIX]{x1D716}_{\unicode[STIX]{x1D6E4}}(x)=\int _{t}^{t+T}\int _{-\infty }^{\infty }\unicode[STIX]{x1D714}_{z}(x,y,t)\,\text{d}y\,\text{d}t. & & \displaystyle\end{eqnarray}$$
The
 $\unicode[STIX]{x1D716}_{\unicode[STIX]{x1D714}}$
asymmetry measure shown in figure 10(a) shows that the discrepancy in the peak vorticity of consecutive counter-rotating vortices increases with cylinder inclination, reaching a maximum at
 $\unicode[STIX]{x1D6FC}\approx 36^{\circ }$
, and having negligible magnitudes at reflection-symmetric inclinations. This shows an approximate agreement with the dependence of the lift force coefficient with cylinder inclination (Ng et al.
Reference Ng, Vo, Hussam and Sheard2016), but lacks a clear correlation with the emergence of the mode C branch besides the higher
 $\unicode[STIX]{x1D716}_{\unicode[STIX]{x1D714}}$
levels within the corresponding range of incidence angles (region enclosed within the vertical dashed lines in figure 10). The
 $\unicode[STIX]{x1D716}_{t}$
levels of the base flow instead (figure 10
b) show a stronger correlation to the emergence of mode C, demonstrating that consecutive counter-rotating vortices in the base flow possess a noticeably larger deviation in phase in the near wake which rapidly decreases downstream within the range of inclinations where mode C can be observed. These variations in asymmetry levels for
 $\unicode[STIX]{x1D716}_{t}$
and
 $\unicode[STIX]{x1D716}_{\unicode[STIX]{x1D714}}$
may be related to the vortex shedding dynamics in the wake. For all cylinder inclinations, flow separation from the upper half of the cylinder remains fixed at the upper edge where the vortex forms. Flow separation from the underside of the cylinder experiences two different scenarios depending on the cylinder inclination. For
 $\unicode[STIX]{x1D6FC}<30^{\circ }$
, flow separation and vortex formation occur similarly to the upper half of the cylinder, leading to an approximately similar vorticity distribution across both vortices. The commensurate increase in the magnitude of
 $\unicode[STIX]{x1D716}_{\unicode[STIX]{x1D714}}$
with increasing
 $\unicode[STIX]{x1D6FC}$
then arises primarily from the difference in strengths of the flow reversal into the wake about the two rear vertices, leading to increasingly unequal peak vorticities. The arrangement of vortices in the vortex street will then be affected to maintain its stability, leading to an increase in
 $\unicode[STIX]{x1D716}_{t}$
. For
 $30^{\circ }\leqslant \unicode[STIX]{x1D6FC}\lesssim 60^{\circ }$
, the flow initially separates at the forward cylinder edge, and undergoes a subsequent separation about the rear edge before the underside vortex is shed. In the latter case, the abrupt secondary separation of the already strained shear layer induces a stronger suction into the cylinder wake, entraining a proportion of the flow (forming vortex) into the upper region of the cylinder near wake. This broadens the vorticity distribution, resulting in a lower peak vorticity
 $\unicode[STIX]{x1D714}_{z}^{+}$
as the vortex is shed, which results in a larger
 $\unicode[STIX]{x1D716}_{\unicode[STIX]{x1D714}}$
magnitude. The reversal about the rear cylinder edge also introduces a lag in the shedding of the underside vortex, which results in larger
 $\unicode[STIX]{x1D716}_{t}$
magnitudes in the near wake.
The
 $\unicode[STIX]{x1D716}_{\unicode[STIX]{x1D6E4}}$
measure (figure 10
c) also shows a similar increase in asymmetry in the near wakes of cylinders at inclinations where mode C is observed. However, the variation of
 $\unicode[STIX]{x1D716}_{\unicode[STIX]{x1D6E4}}$
with streamwise position appears significant at cylinder inclinations whose wakes exhibit the development of the subharmonic mode branch from the stability analysis (shaded region of figure 10). Wakes becoming unstable through mode A show
 $\unicode[STIX]{x1D716}_{\unicode[STIX]{x1D6E4}}$
magnitudes to remain fairly constant spatially, without necessarily possessing
 $\unicode[STIX]{x1D716}_{\unicode[STIX]{x1D6E4}}=0$
. This implies that the flow can be asymmetric and unstable to mode A provided that the asymmetry levels (
 $\unicode[STIX]{x1D716}_{\unicode[STIX]{x1D6E4}}$
and to a certain extent
 $\unicode[STIX]{x1D716}_{t}$
) are consistent globally where the Kármán vortex street exists. Curiously, the rapid decay of
 $\unicode[STIX]{x1D716}_{\unicode[STIX]{x1D6E4}}$
downstream of the cylinder for the mode C range of incidence angles show a correlation with the perturbation structures obtained for mode C from the stability analysis wherein the perturbations appear most intensely closest to the cylinder where the deviations are largest, and are almost unobservable where levels of
 $\unicode[STIX]{x1D716}_{\unicode[STIX]{x1D6E4}}$
appear low (see figure 8). Perhaps these imbalances in the base flow give rise to mode C instead of mode A – the instability acting as a mechanism to compensate for the asymmetries.
It is important to note that the deviations quantified here focus primarily on the near wake where the wake exhibits a structure similar to the Kármán vortex street, ranging between positions
 $2\leqslant x/h\leqslant 12$
. Wakes of the cylinder at inclinations ranging
 $54^{\circ }\lesssim \unicode[STIX]{x1D6FC}\lesssim 56^{\circ }$
develop a dual layer wake within the range of streamwise positions, with the approximate position of the onset of the dual layer wake affecting the corresponding values of
 $\unicode[STIX]{x1D716}_{t}$
and
 $\unicode[STIX]{x1D716}_{\unicode[STIX]{x1D6E4}}$
as observed through the sudden increase in asymmetry measured at approximately
 $x/h\geqslant 7$
(figure 10
b,c).
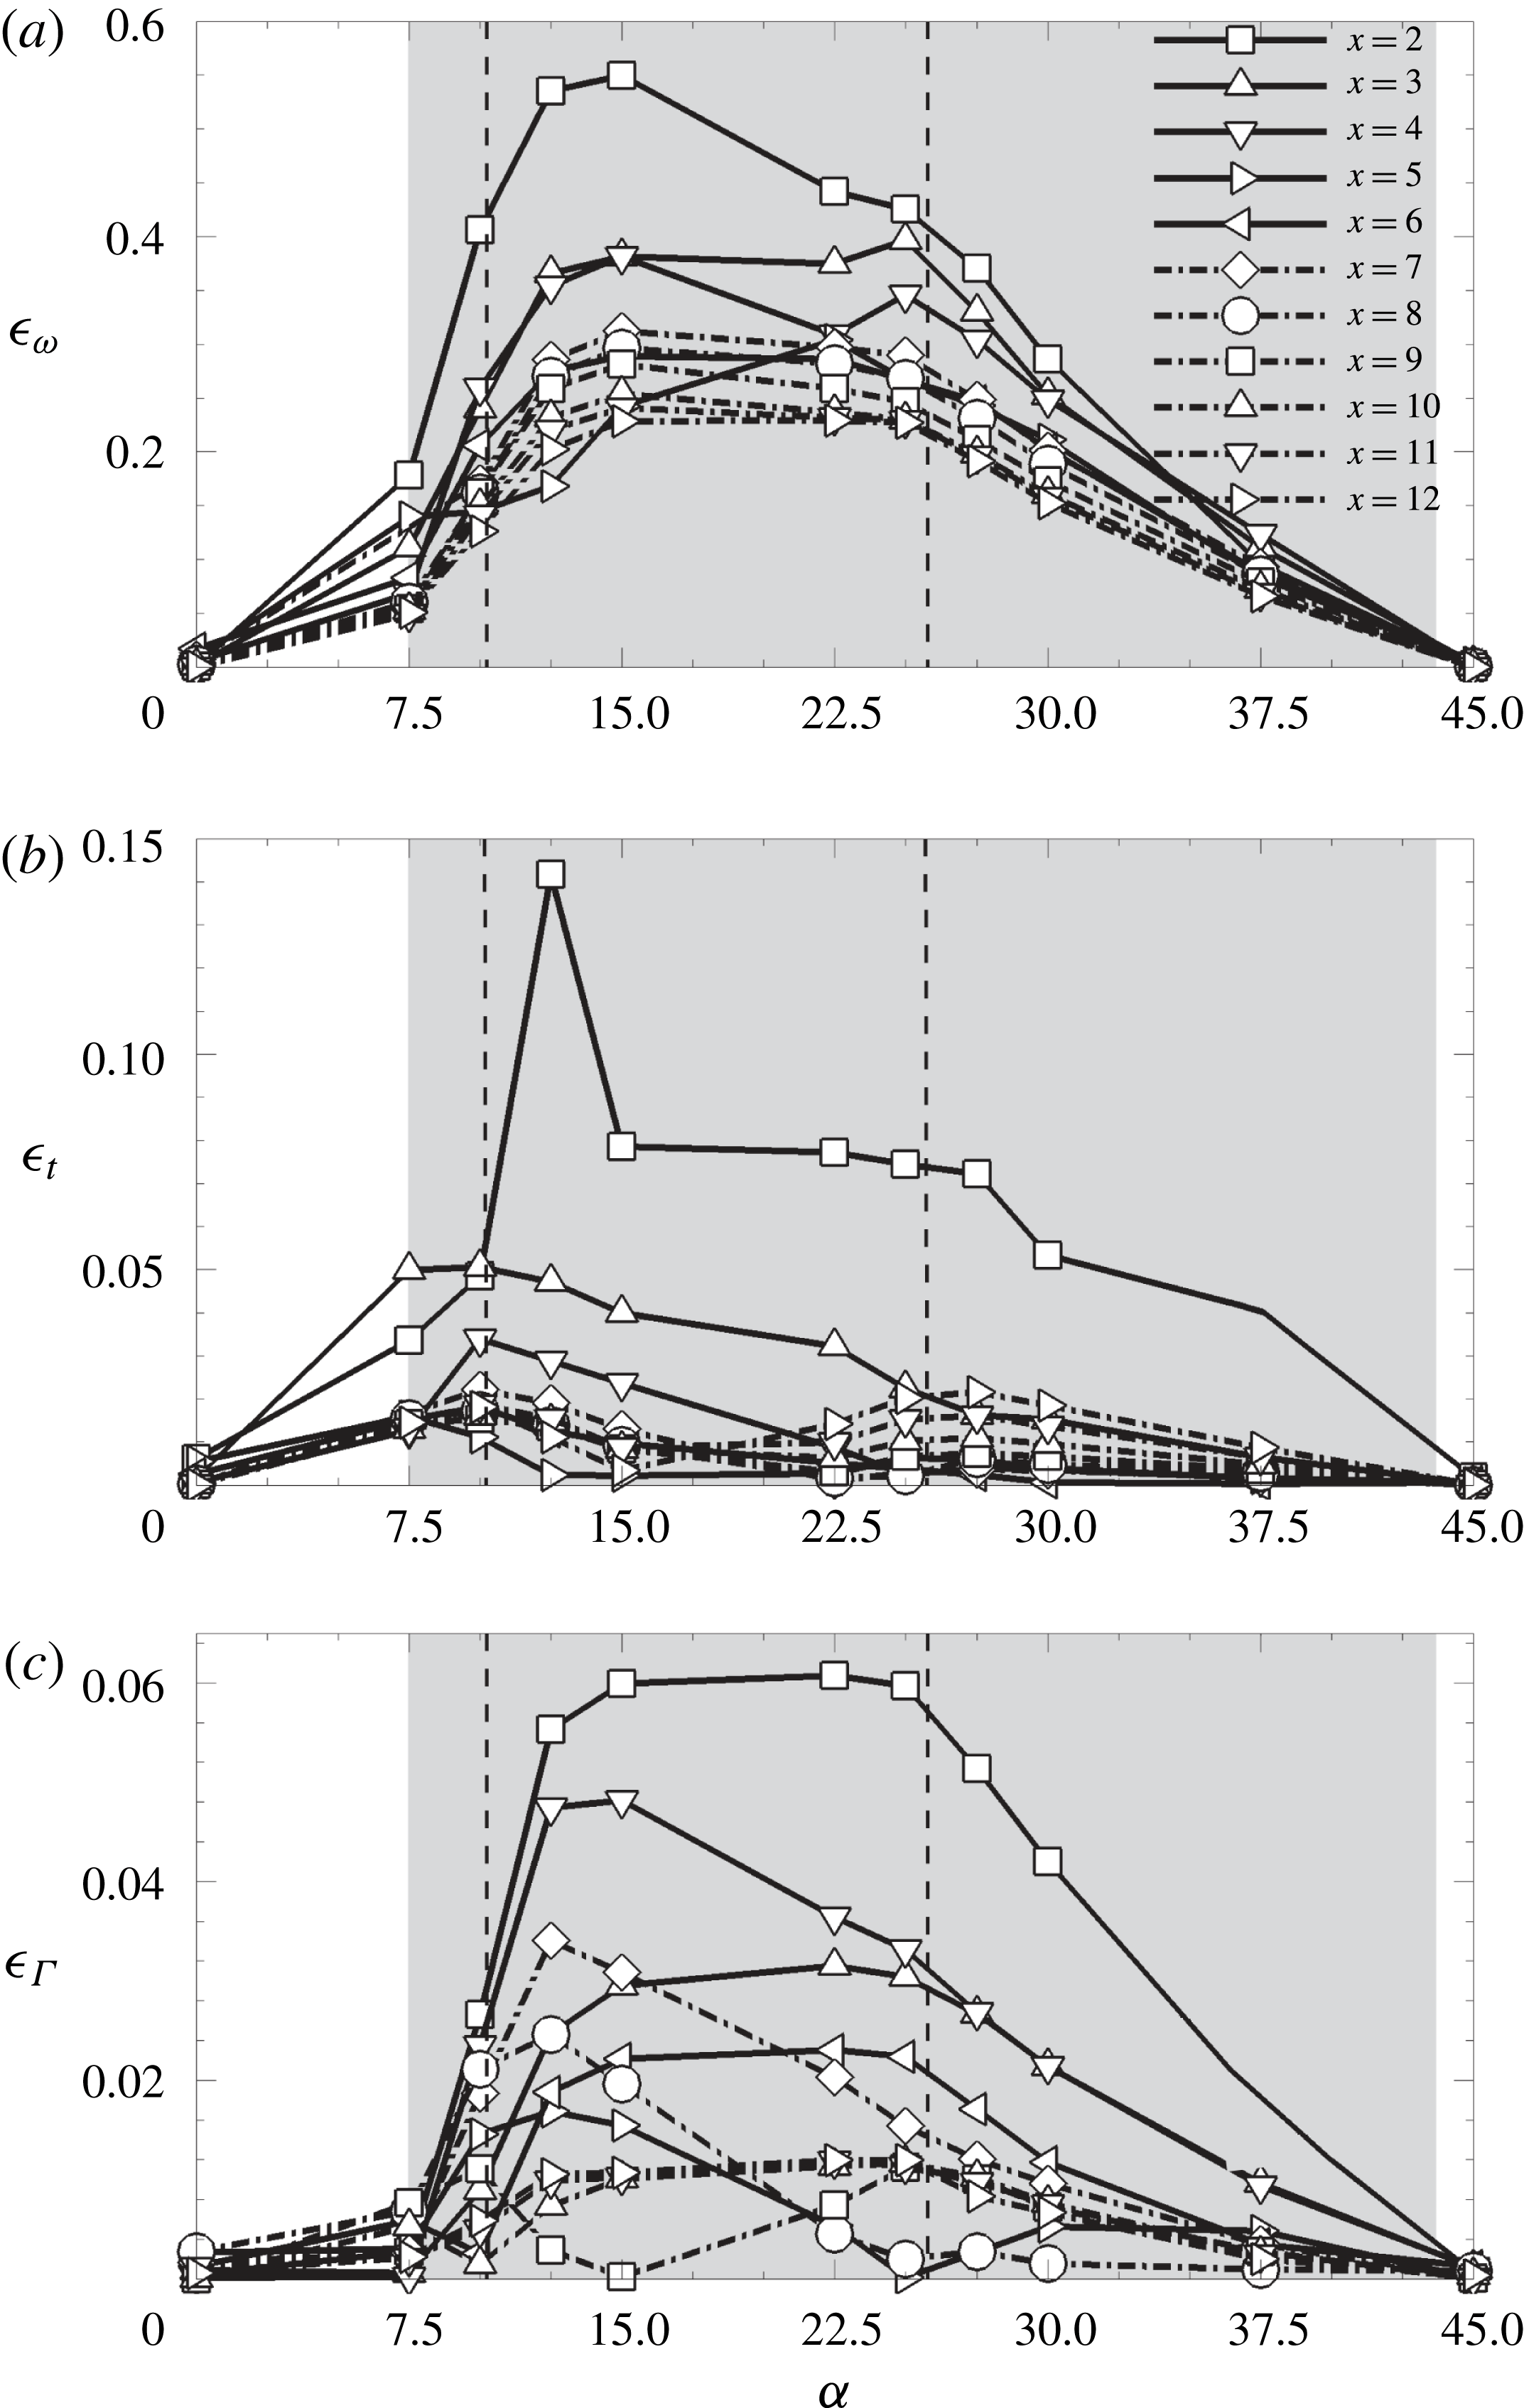
Variation of (a)
 $\unicode[STIX]{x1D716}_{\unicode[STIX]{x1D714}}$
, (b)
 $\unicode[STIX]{x1D716}_{t}$
and (c)
 $\unicode[STIX]{x1D716}_{\unicode[STIX]{x1D6E4}}$
with cylinder inclination
 $\unicode[STIX]{x1D6FC}$
for the square cylinder. Solid lines weave through deviation values for
 $x/h<7$
, while dashed lines connect deviation values for
 $x/h\geqslant 7$
.

To test the predictive capacity of these asymmetry measures in more general wake flows, the measures were applied to simulations of the flows past an inclined square cylinder whose stability characteristics have been mapped and described in Sheard et al. (Reference Sheard, Fitzgerald and Ryan2009), Yoon et al. (Reference Yoon, Yang and Choi2010) and Sheard (Reference Sheard2011). In these studies, the first-occurring three-dimensional mode was observed to change depending on the inclination of the square cylinder, starting with mode A when the cylinder presents a face normal to the flow (their
 $\unicode[STIX]{x1D6FC}=0^{\circ }$
), changing to mode C at intermediate cylinder inclinations (
 $\unicode[STIX]{x1D6FC}\approx 10.5^{\circ }{-}26^{\circ }$
), before mode A recovers as the first-occurring instability mode again (
 $\unicode[STIX]{x1D6FC}\gtrsim 26^{\circ }$
). For these flows,
 $\unicode[STIX]{x1D716}_{\unicode[STIX]{x1D714}}$
,
 $\unicode[STIX]{x1D716}_{t}$
and
 $\unicode[STIX]{x1D716}_{\unicode[STIX]{x1D6E4}}$
were obtained from the two-dimensional time-periodic base flows of the inclined square cylinder, generally at increments of
 $7.5^{\circ }$
, and are shown in figure 11. The region enclosed within the vertical dashed lines in figure 11 highlights inclination ranges where stability analysis predicts mode C to be the first unstable mode (Sheard et al.
Reference Sheard, Fitzgerald and Ryan2009; Yoon et al.
Reference Yoon, Yang and Choi2010; Sheard Reference Sheard2011). Similar to the triangular cross-section cylinder in this study, the deviations obtained were larger in magnitude within inclination ranges where the flow becomes unstable through mode C (region enclosed within the vertical dashed lines in figure 11). Both
 $\unicode[STIX]{x1D716}_{t}$
and
 $\unicode[STIX]{x1D716}_{\unicode[STIX]{x1D6E4}}$
for the square cylinder wake (figure 11
b,c) exhibit a similar rapid decay in space to the
 $\unicode[STIX]{x1D716}_{\unicode[STIX]{x1D6E4}}$
measure for the triangular cylinder. Since a stability analysis on the wakes of the inclined square cylinder was not performed here, an estimate of the range of cylinder inclinations where the subharmonic mode branch might be predicted from the stability analysis of the flow is made by observing the spatial variation and magnitudes of
 $\unicode[STIX]{x1D716}_{t}$
and
 $\unicode[STIX]{x1D716}_{\unicode[STIX]{x1D6E4}}$
, and is represented by the shaded regions in figure 11 spanning incidence angles
 $7.5^{\circ }\lesssim \unicode[STIX]{x1D6FC}<45^{\circ }$
. This range of cylinder inclinations predicted purely from the deviations of the two-dimensional base flows from the Kármán vortex street symmetry show a strong agreement with those reported in Sheard et al. (Reference Sheard, Fitzgerald and Ryan2009) and Yoon et al. (Reference Yoon, Yang and Choi2010) as ranging between
 $7.5^{\circ }\lesssim \unicode[STIX]{x1D6FC}\lesssim 37.5^{\circ }$
. These results are also consistent with those for the three-dimensional wake of a circular cylinder with a trip wire, where Yildirim et al. (Reference Yildirim, Rindt and van Steenhoven2013a
) describes the difference in strengths of consecutive spanwise vortices (similar to the present
 $\unicode[STIX]{x1D716}_{\unicode[STIX]{x1D6E4}}$
measure) 10 cylinder diameters downstream. The difference between the present measurements and those reported in Yildirim et al. (Reference Yildirim, Rindt and van Steenhoven2013a
) being that the present work quantifies these deviations and makes predictions of the stability characteristics purely from the two-dimensional base flows instead of requiring the full three-dimensional flow.
3.5 Nonlinear dynamics of the three-dimensional flow transition
To model the nonlinear dynamics of the transition, three-dimensional flow simulations were performed for several cylinder inclinations at Reynolds numbers just above the predicted transition. The cylinder inclinations chosen for this analysis were selected to cover a range of inclinations where the flow is predicted to become unstable through modes
 $\text{A}_{1}$
, C, and
 $\text{A}_{2}$
, and the spanwise domain was set to the wavelength of the leading instability mode for each case. The simulations were performed at Reynolds numbers within
 $\unicode[STIX]{x1D716}<0.1$
, where
 $\unicode[STIX]{x1D716}=(Re-Re_{t})/Re_{t}$
is the distance parameter used earlier in § 3.2 and is similar to that defined in Henderson (Reference Henderson1997), with
 $Re_{t}$
corresponding to either
 $Re_{A}$
or
 $Re_{C}$
depending on which mode is the first to become unstable. This range of
 $\unicode[STIX]{x1D716}$
was chosen to limit the study to Reynolds numbers where the peak growth rates of the dominant modes predicted from the stability analysis vary linearly with
 $\unicode[STIX]{x1D716}$
as discussed in § 3.2. Resolution studies performed showed that 8 Fourier modes (
 $N_{F}$
) sufficiently resolved the flow to within 0.1 % relative to
 $N_{F}=32$
(highest tested), measured through the growth rates of the leading Fourier mode corresponding to the most unstable linear mode (
 $\text{d}\log |E_{1}|/\text{d}t$
), the mean total energy at saturation of the fundamental and leading Fourier modes (
 $\overline{E}_{0,sat},\overline{E}_{1,sat}$
) and the mean spanwise flow velocity at a point in the wake at saturation (
 $\overline{w}(x,y,z,t)$
).
Modelling the flow as a complex oscillator, a weakly nonlinear approximation can be applied to the flow to understand the nature of the transition. The Stuart–Landau equation describes the evolution of the complex amplitudes in these systems, and can be written as
 $$\begin{eqnarray}\frac{\text{d}A}{\text{d}t}=(\unicode[STIX]{x1D70E}+\text{i}\unicode[STIX]{x1D714})A-l(1+\text{i}c)|A|^{2}A+\cdots \,,\end{eqnarray}$$
where
 $A(t)$
is the complex amplitude of a given signal (Landau & Lifshitz Reference Landau and Lifshitz1976; Drazin & Reid Reference Drazin and Reid2004). Assuming
 $A(t)$
takes the form
 $|A|\exp (\text{i}\unicode[STIX]{x1D6F7})$
, equation (3.6) can be decomposed into real and imaginary components to form
 $$\begin{eqnarray}\displaystyle \frac{\text{d}\log |A|}{\text{d}t} & = & \displaystyle \unicode[STIX]{x1D70E}-l|A|^{2}+\cdots \,,\end{eqnarray}$$
 $$\begin{eqnarray}\displaystyle \frac{\text{d}\unicode[STIX]{x1D6F7}}{\text{d}t} & = & \displaystyle \unicode[STIX]{x1D714}-lc|A|^{2}+\cdots \,,\end{eqnarray}$$
 $|A|$
and
 $\unicode[STIX]{x1D6F7}$
are the magnitude and phase angle of the complex amplitude signal, respectively,
 $\unicode[STIX]{x1D70E}$
is the growth rate,
 $\unicode[STIX]{x1D714}$
is angular frequency and
 $l$
and
 $c$
are coefficients describing the nonlinear departure of the mode evolution from the linear regime. Considering only up to linear form as shown in (3.7) (up to cubic terms of
 $A$
in (3.6)), the nature of the transition can be described sufficiently through the sign of the
 $l$
coefficient (commonly called the Landau coefficient) in (3.7a
). The transition is supercritical for
 $l>0$
close to the vertical axis, and subcritical when
 $l<0$
. This model has been applied extensively for similar bluff-body flows (Henderson Reference Henderson1997; Sheard, Thompson & Hourigan Reference Sheard, Thompson and Hourigan2004; Sheard et al.
Reference Sheard, Fitzgerald and Ryan2009, among others), and various other flow configurations such as those for confined channel flows (Sapardi et al.
Reference Sapardi, Hussam, Pothérat and Sheard2017) and flows in differential-disk rotating systems (Vo et al.
Reference Vo, Montabone, Read and Sheard2015). For the configuration in the present study, the energy growth of the Fourier mode corresponding to the leading instability mode predicted from the linear stability analysis is used as the complex amplitude measure similar to Henderson (Reference Henderson1997), and is given by
 $$\begin{eqnarray}\displaystyle |A_{m}|(\unicode[STIX]{x1D70F})=\left[\int _{V}|\boldsymbol{u}_{m}(\unicode[STIX]{x1D70F})|^{2}\,\text{d}V\right]^{1/2}, & & \displaystyle\end{eqnarray}$$
where
 $\unicode[STIX]{x1D70F}$
is the normalized time
 $t/T$
sampled once per period of the two-dimensional flow, and is thus necessarily an integer,
 $|A_{m}|(\unicode[STIX]{x1D70F})$
is the magnitude of the oscillatory signal and
 $m$
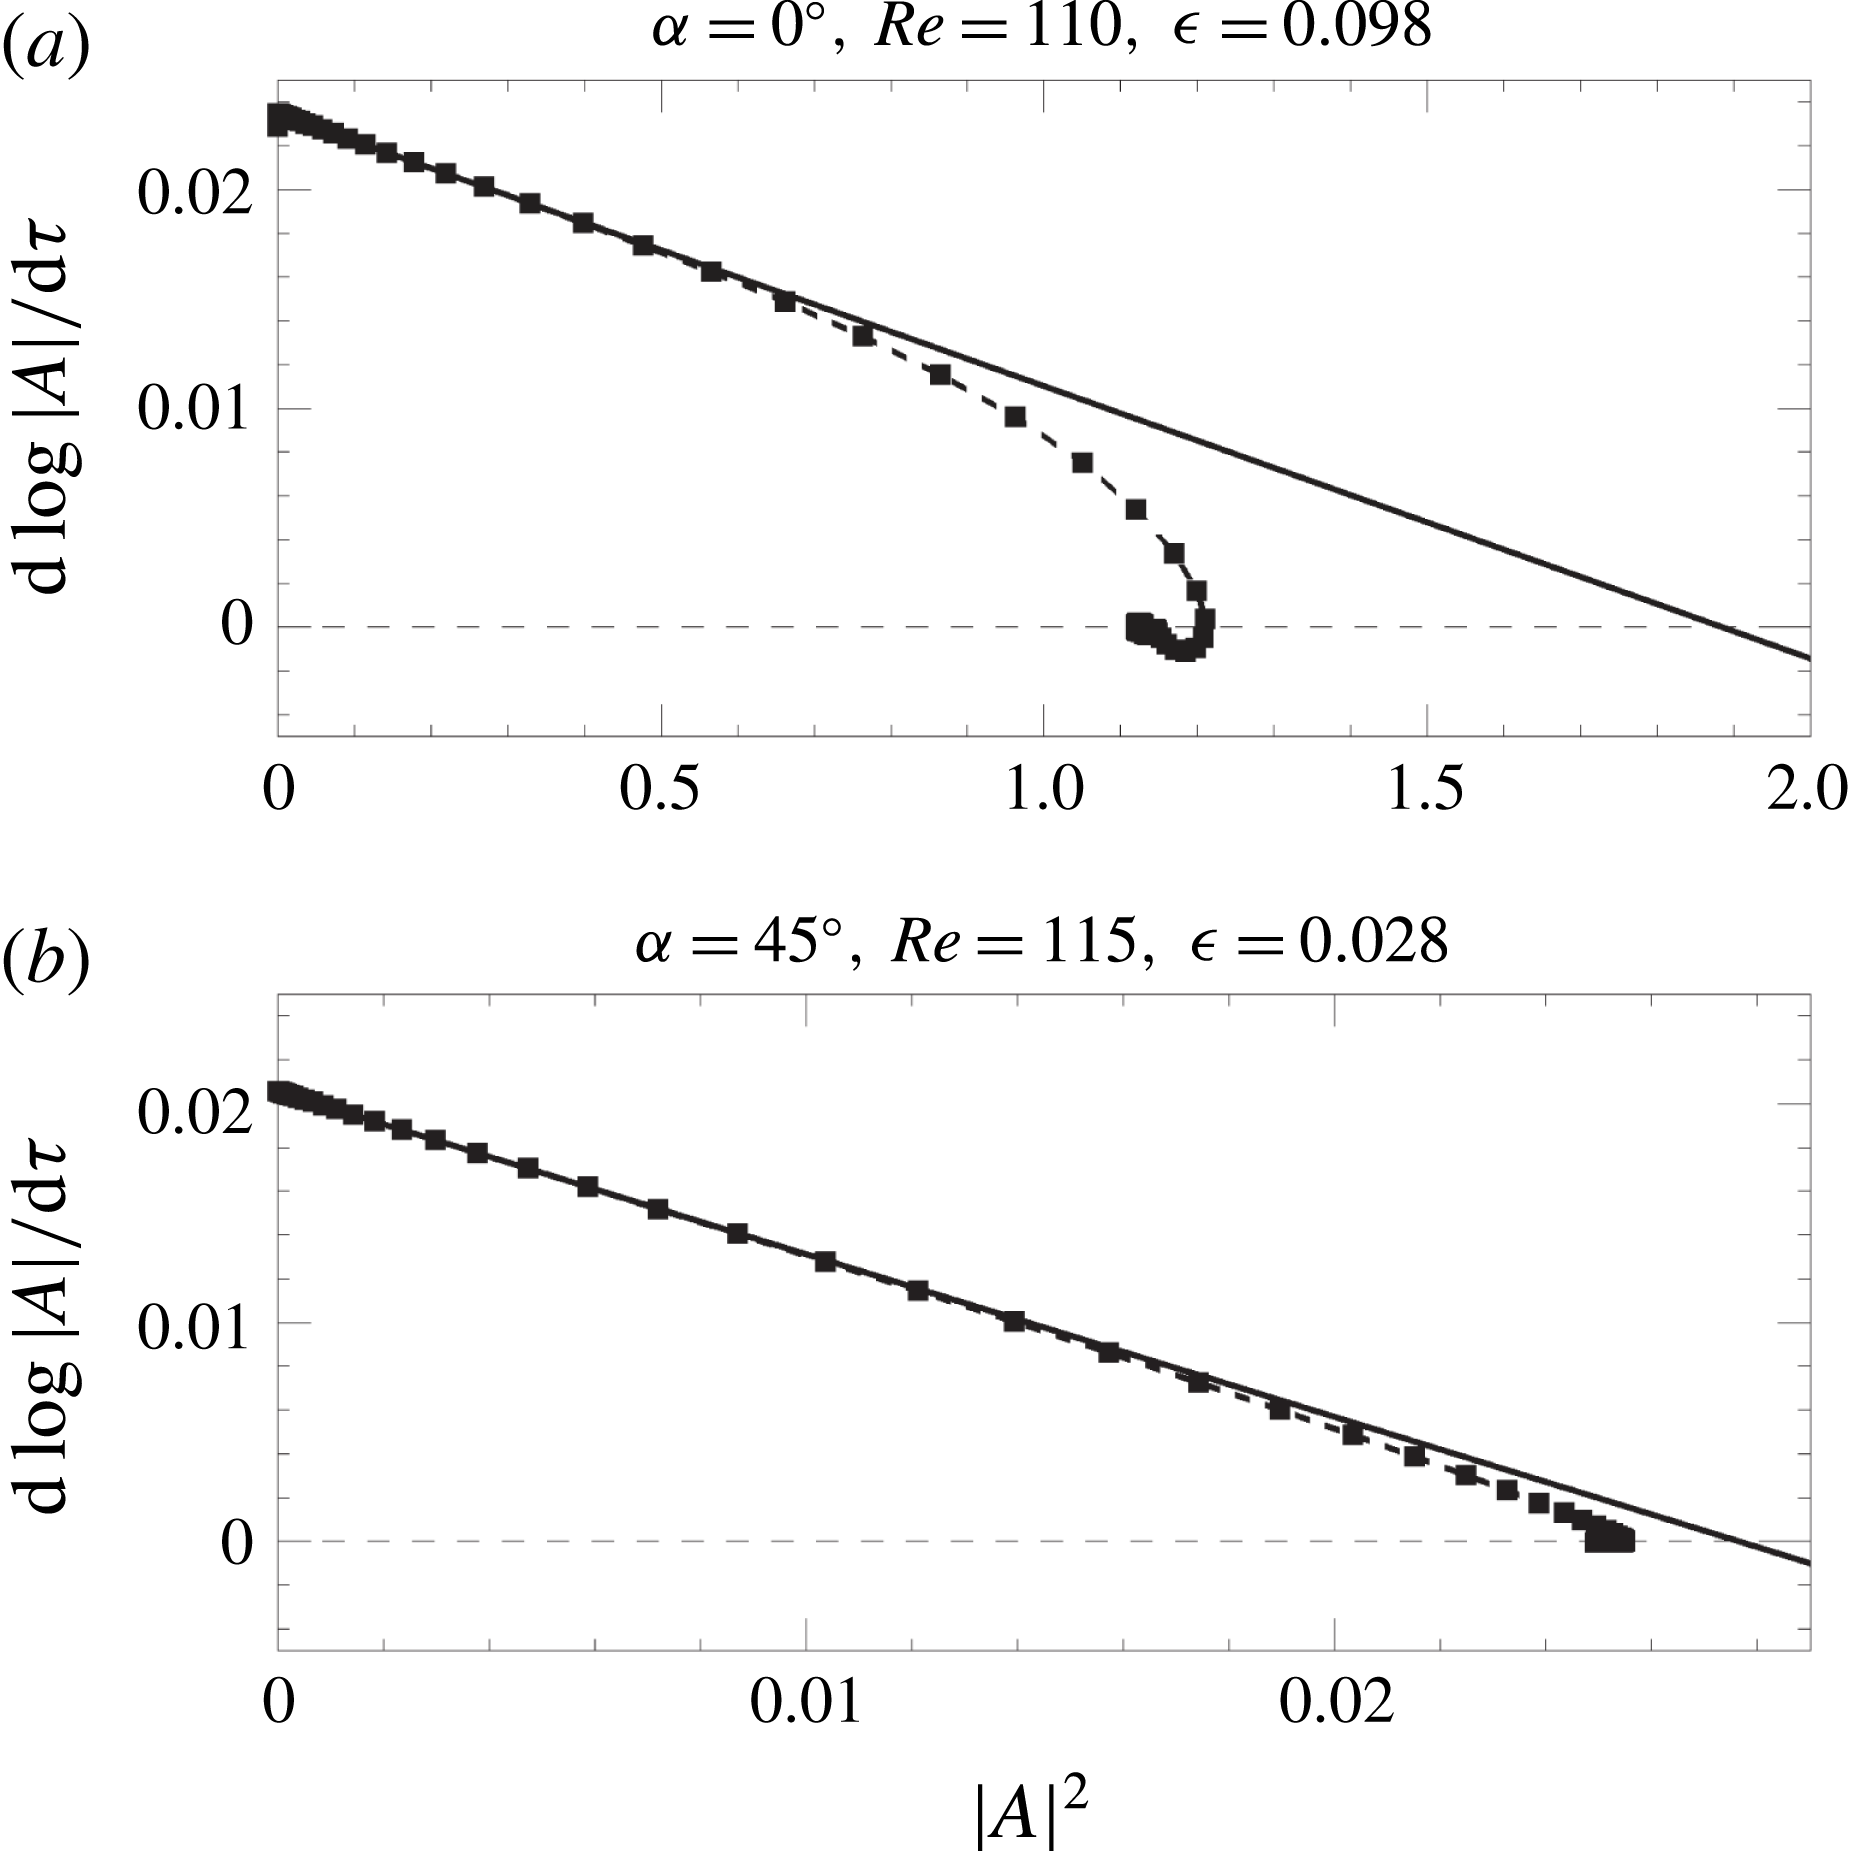
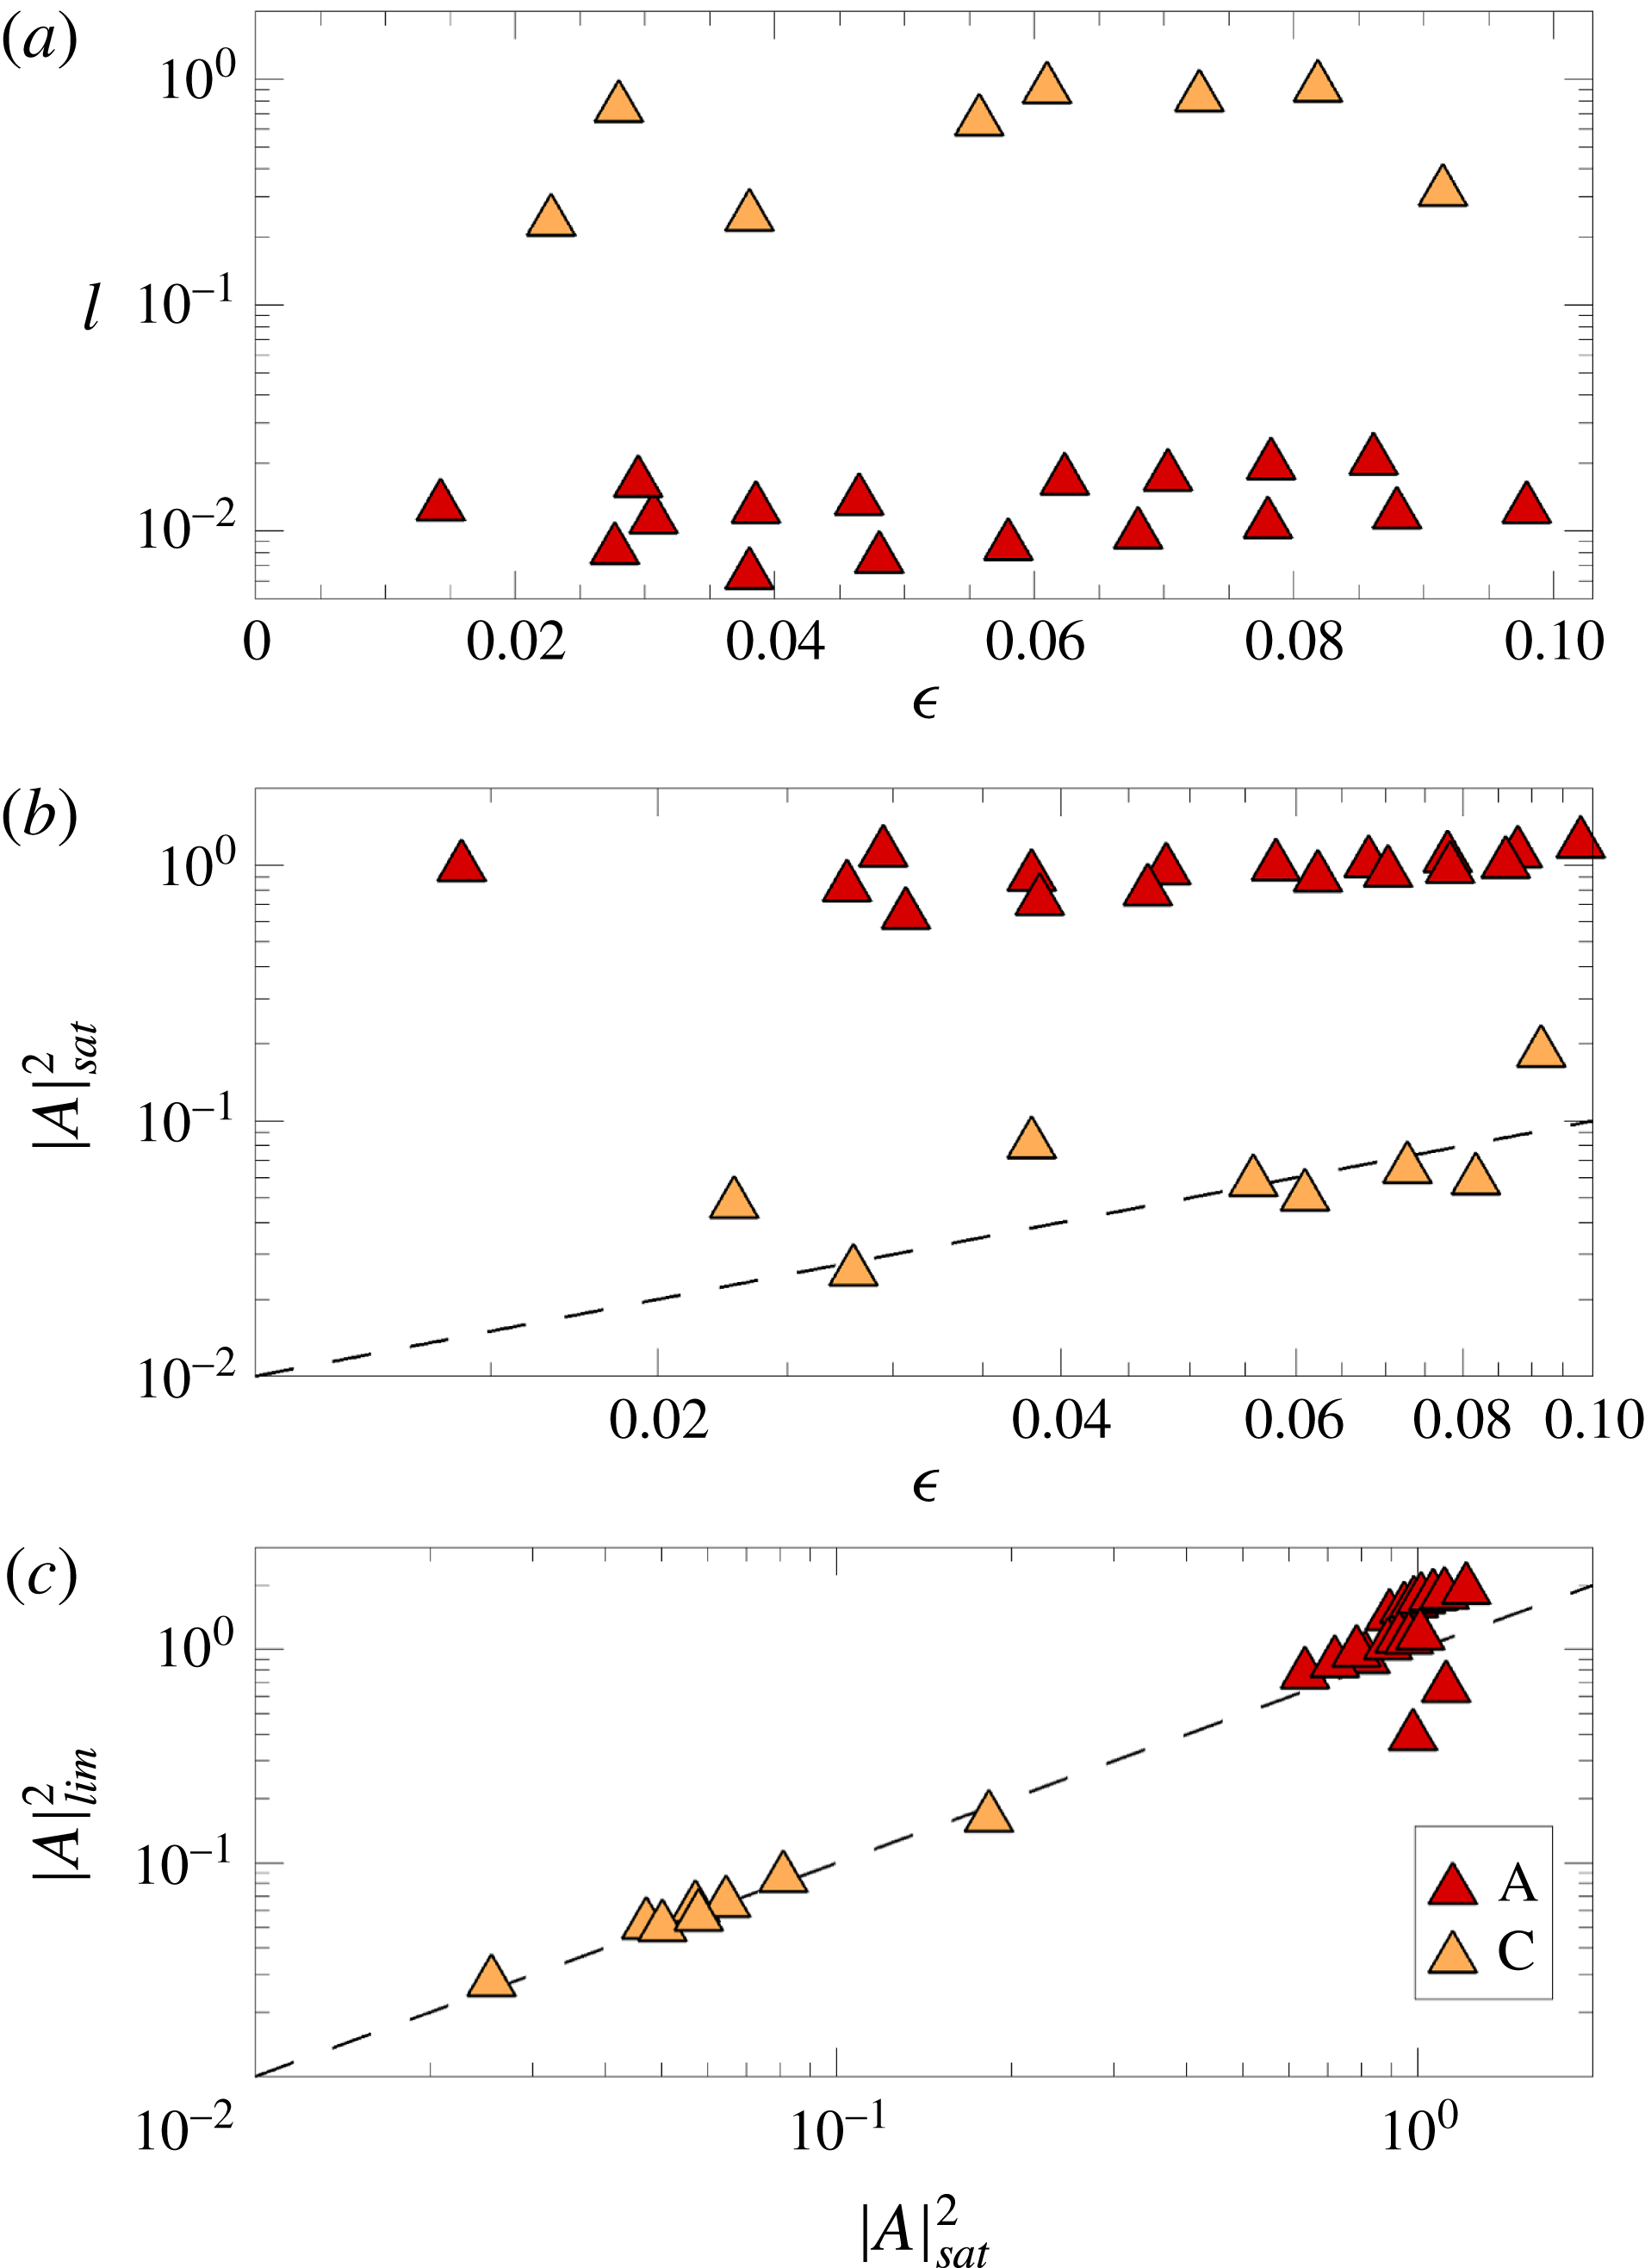
corresponds to the dominant mode. For all cylinder inclinations investigated, the transitions for both modes A and C are found to be supercritical (positive
 $l$
), indicating a smooth transition from the two-dimensional base state to the unstable three-dimensional modes. Examples of these are shown in figure 12. Hence transition to three-dimensional flow is expected to occur at the predicted critical Reynolds numbers with no hysteresis. This is in contrast to the mode A transitions observed in the wakes of the circular cylinder where Henderson & Barkley (Reference Henderson and Barkley1996) and Henderson (Reference Henderson1997) showed the transition to be subcritical. Also, Sheard et al. (Reference Sheard, Fitzgerald and Ryan2009) reported the mode A transition of the square cylinder wake to be either sub- or supercritical depending on the cylinder inclination, whereas the mode C transitions were always supercritical. The present results also show the supercritical nature of mode A here to differ from the hysteretic nature of the mode A transition reported for the wake of a downstream-pointing isosceles triangular cylinder (Luo & Eng Reference Luo and Eng2010) where the two downstream faces of the cylinder in their study were longer than the normally oriented side at the fore of the cylinder, as opposed to the equilateral triangular cross-section cylinder investigated here. This demonstrates the possible sensitivity of the criticality of the transition to the experimental set-up.
A comparison of the
 $l$
coefficients across the different cylinder inclinations shows that they adopt distinctly different values depending on whether they are derived from mode A or mode C, whereas the difference between values within each mode is relatively small. For mode A, these Landau coefficients are measured to be
 $l_{A}\approx O(10^{-2})$
, while those for mode C are consistently higher, in the range
 $O(10^{-1})<l_{C}<O(1)$
(figure 13
a). Thus, the transition through mode C is more strongly supercritical than those through mode A, regardless of the Reynolds number for
 $\unicode[STIX]{x1D716}<0.1$
. This suggests that the Landau coefficient may find utility in the classification of three-dimensional instability modes; this could be helpful experimentally in cases where fluid opacity precludes optical approaches for visualization (e.g. laser-induced fluorescence) and velocimetry (e.g. particle image velocimetry).
As a consequence of this, the saturated amplitudes (
 $|A|_{sat}$
) of the asymptotic state of mode C remain small where
 $|A|_{C,sat}^{2}\approx O(\unicode[STIX]{x1D716})$
(figure 13
b), and show a strong agreement with the limiting amplitudes (
 $|A|_{lim}$
) predicted by the cubic-order truncation (linear form) of the Stuart–Landau equation (the
 $\text{d}\log |A|/\text{d}\unicode[STIX]{x1D70F}=0$
intercepts in figure 12) such that
 $|A|_{C,lim}^{2}\approx |A|_{C,sat}^{2}$
as shown in figure 13(c). This suggests that any coupling to the primary mode is weak near the onset of the mode C instability similar to that described for mode B by Henderson (Reference Henderson1997). The saturated amplitudes of mode A (
 $|A|_{A,sat}$
) instead consistently asymptote at a larger amplitude than mode C despite being within the same
 $\unicode[STIX]{x1D716}$
range (figure 13
b), but still indicate a fair agreement with the predicted limiting amplitude (
 $|A|_{A,lim}$
), such that
 $|A|_{A,sat}^{2}=O(|A|_{A,lim}^{2})$
(figure 13
c). The scatter of the mode C points about the
 $|A|_{lim}^{2}=|A|_{sat}^{2}$
line in figure 13(c) is also found to be significantly smaller than that for mode A as quantified by the residual sum of squares error of these points, normalized by the number of points (akin to a variance measure). Flows unstable through mode C are also observed to reach their asymptotic state much more rapidly than mode A, which agrees with the results reported in § 3.2 where the peak growth rates of mode C increased at approximately twice the rate of those of mode A with increasing
 $\unicode[STIX]{x1D716}$
.
Examples of the growth of the predicted instability modes from the initially two-dimensional flow, shown for (a)
 $\unicode[STIX]{x1D6FC}=0^{\circ },Re=110$
, and (b)
 $\unicode[STIX]{x1D6FC}=45^{\circ },Re=115$
, being representative of mode A and mode C, respectively. The dashed lines through data points are the measured amplitude growths (
 $|A|_{sat}^{2}$
), while the solid lines project the linear gradient near the axis, showing the departure due to nonlinear interactions in the flow, as well as describing the envelope of the limiting amplitude predicted from the cubic-order truncation Stuart–Landau equation (
 $|A|_{lim}^{2}$
).

Plots of (a) the
 $l$
coefficient against the distance parameter
 $\unicode[STIX]{x1D716}$
, (b) the squares of the amplitude at saturation of the mode (
 $|A|_{sat}^{2}$
) versus
 $\unicode[STIX]{x1D716}$
and (c) squares of the predicted limiting amplitudes (
 $|A|_{lim}^{2}$
) versus
 $|A|_{sat}^{2}$
. For all panels, the red triangles (▴, darker) correspond to mode A simulations, while the orange triangles (▴, lighter) correspond to mode C. The dashed lines in (b) and (c) map the linear functions
 $|A|_{sat}^{2}=\unicode[STIX]{x1D716}$
and
 $|A|_{sat}^{2}=|A|_{lim}^{2}$
, respectively.

4 Conclusions
This paper reports on the stability of the wake of a cylinder with a triangular cross-section at various inclinations to the incident flow, computed through a Floquet type stability analysis. The results indicate that the transition to three-dimensionality occurs through two instability modes, each being dominant across various cylinder inclination ranges. The regular mode is shown to possess Floquet multipliers and spatio-temporal characteristics consistent with the mode A observed in the wakes of circular and square cylinders, and is the primary mode through which the flow transitions for cylinder inclinations
 $0^{\circ }\leqslant \unicode[STIX]{x1D6FC}\lesssim 34.6^{\circ }$
(denoted mode
 $\text{A}_{1}$
, possessing instability wavelengths ranging
 $4.6\lesssim \unicode[STIX]{x1D706}_{A}/h\lesssim 6.0$
) and
 $55.4^{\circ }\lesssim \unicode[STIX]{x1D6FC}\leqslant 60^{\circ }$
(denoted mode
 $\text{A}_{2}$
with instability wavelengths
 $4.2\lesssim \unicode[STIX]{x1D706}_{A}/h\lesssim 4.4$
). The subharmonic mode instead exhibits a negative real only Floquet multiplier and shows the instability structure to have a period that is twice that of the two-dimensional flow, consistent with descriptions of the mode C from various prior studies. Mode C is predicted as the first instability across cylinder inclinations
 $34.6^{\circ }\lesssim \unicode[STIX]{x1D6FC}\lesssim 55.4^{\circ }$
, with an instability wavelength ranging
 $1.6\lesssim \unicode[STIX]{x1D706}_{C}/h\lesssim 1.8$
. The peak growth rates corresponding to mode
 $\text{A}_{1}$
and mode
 $\text{A}_{2}$
for all cylinder inclinations demonstrate a linear dependence with
 $(Re-Re_{A})/Re_{A}$
, while the peak growth rates of mode C lack the same level of linearity with
 $(Re-Re_{C})/Re_{C}$
. Despite this, the trends still describe mode C developing more rapidly than mode A with increasing
 $Re$
past its onset.
An attempt to elucidate and quantify deviations of the symmetry of the underlying two-dimensional base flow from those of the Kármán vortex street was presented. Suggested measures for the degree of asymmetry possessed by the base flow are the
 $\unicode[STIX]{x1D716}_{\unicode[STIX]{x1D714}}$
,
 $\unicode[STIX]{x1D716}_{t}$
and
 $\unicode[STIX]{x1D716}_{\unicode[STIX]{x1D6E4}}$
parameters, which describe the imbalance in the peak vorticities of consecutive counter-rotating vortices in each period, the deviations from the anti-phase temporal arrangements of vortices and a net circulation measure, respectively. The performance of each measure was discussed, showing
 $\unicode[STIX]{x1D716}_{\unicode[STIX]{x1D6E4}}$
to provide the strongest correlation to the mode C predictions obtained through stability analysis of the flow – where the stability analysis predicts the mode C to be unstable, the corresponding base flows show a strong deviation in the near wake which rapidly decreases downstream of the cylinder, particularly for the
 $\unicode[STIX]{x1D716}_{t}$
and
 $\unicode[STIX]{x1D716}_{\unicode[STIX]{x1D6E4}}$
measures. Cylinder inclinations unstable to mode A instead show these deviation measures to remain fairly constant spatially through the near wake, particularly the
 $\unicode[STIX]{x1D716}_{\unicode[STIX]{x1D6E4}}$
measure. These results were verified by applying the same deviation measures to the two-dimensional time-periodic wakes of flows past an inclined square cylinder, and then comparing the results against the predicted stability characteristics as reported previously in Sheard et al. (Reference Sheard, Fitzgerald and Ryan2009) and Yoon et al. (Reference Yoon, Yang and Choi2010). The results describe a similar spatial variation at cylinder inclinations where stability analysis predicts mode C to be unstable, similar to the case for the triangular cylinder wake. Whether these results hold true for all flow systems exhibiting the mode C is presently unknown, but the ability to delineate the occurrence of the various instability modes through the two-dimensional base flow would be quite useful in attempting to further investigate the physical mechanism behind these transitions.
Analysis of the results from three-dimensional flow simulations at low Reynolds numbers past the predicted onset of instability shows the transitions to be supercritical for all cylinder inclinations, with mode C being more strongly supercritical than mode A. This is reflected in the mode C flows reaching an asymptotic state more rapidly than those through mode A. The final saturation amplitudes of mode C are also shown to be small compared to those of mode A, and these saturation amplitudes remain close to those predicted through the linear approximation, similar to those for mode B in the wake of circular cylinders as described by Henderson (Reference Henderson1997).
Acknowledgements
Z.Y.N. was supported by an Engineering Research Living Allowance (ERLA) through the Faculty of Engineering, Monash University. This research was supported by ARC Discovery grants DP150102920 and DP180102647, and was undertaken with the assistance of resources from the National Computational Infrastructure (NCI), which is supported by the Australian Government.