


Introduction
It is of fundamental importance in Nepal to be able to estimate glacier ablation under the debris layer, since the melt-water from glaciers is one of the major water sources for the country. In Nepal, most of the ablation areas of glaciers are covered with debris (Reference Fujii and HiguchiFujii and Higuchi, 1977). However, no reliable estimates have been made as yet regarding the precise amount of ablation under the debris layer.
The relation between the rate of ablation and debris thickness has been studied by many workers (e.g. Reference ØstreamØstream, 1959; Reference LoomisLoomis, 1970; Reference FujiiFujii, 1977; Reference Nakawo and TakahashiMattson and others, 1993) The presence of a debris layer at the ice surface means that the ablation rate underneath it is accelerated when the debris layer is thin, while the ablation rate is retarded when debris is thick. This general finding is reported in the results of many researchers, but results vary as to the thickness required before ablation is accelerated or suppressed. In addition, the debris thickness at which maximum ablation takes place varies between studies, along with, the maximum rate of ablation. These discrepancies can be explained in terms of the different thermal properties of debris and/or the different meteorological conditions when experiments or observations were carried out (Reference Nakawo and TakahashiNakawo and Young, 1981). It is important, therefore, to take into accounl not only debris thickness, but both the thermal properties of the debris and the meteorological conditions for examining ablation under a debris layer (Reference Nakawo and YoungNakawo and Takahashi, 1982).
In order to estimate glacier melt from the whole ablation area of debris-covered glaciers, it is necessary to know, in addition to meteorological conditions, the distribution of debris thickness and its thermal properties. It is very difficult, however, to measure debris distribution in the field, partly because it varies between geographical areas, and partly because collecting such data is dangerous and it is sometimes impossible to assess the entire surface of debris-covered glaciers. In the past, therefore, runoff’models have been based on a variety of assumptions regarding debris characteristics for debris-covered glaciers.
The present study was conducted in the Lirung basin, located in the Langtang Valley, approximately 60 km north pf Kathmandu, Nepal. Glacial discharge modeling in this area has been attempted by Reference Braun, Grabs and RanaBraun and others (1993), who mentioned that the predictions of a conceptual runoff model agree roughly with field data if the ablation under the debris is regarded to be half the ablation of debris-free glacier ice. Reference Rana, Fukushima, Ageta and NakawoRana and others (1996) suggested assuming an average debris thickness of 0.5-1 in, with a thermal conductivity of 1.4-2.6 Wm−1 deg−1
Reference Nakawo and YoungNakawo and Young (1982) showed that the ablation rate under a debris layer can be estimated only by meteorological variables if the surface temperature of the debris is given. Nakawo and others i proposed that the distribution of surface temperature could be estimated by using satellite data: therefore it is possible to estimate ablation from large debris-covered areas. The present paper uses this methodology to estimate the ablation rate of a debris-covered glacier and then compares the results with field discharge data.
Basin Description
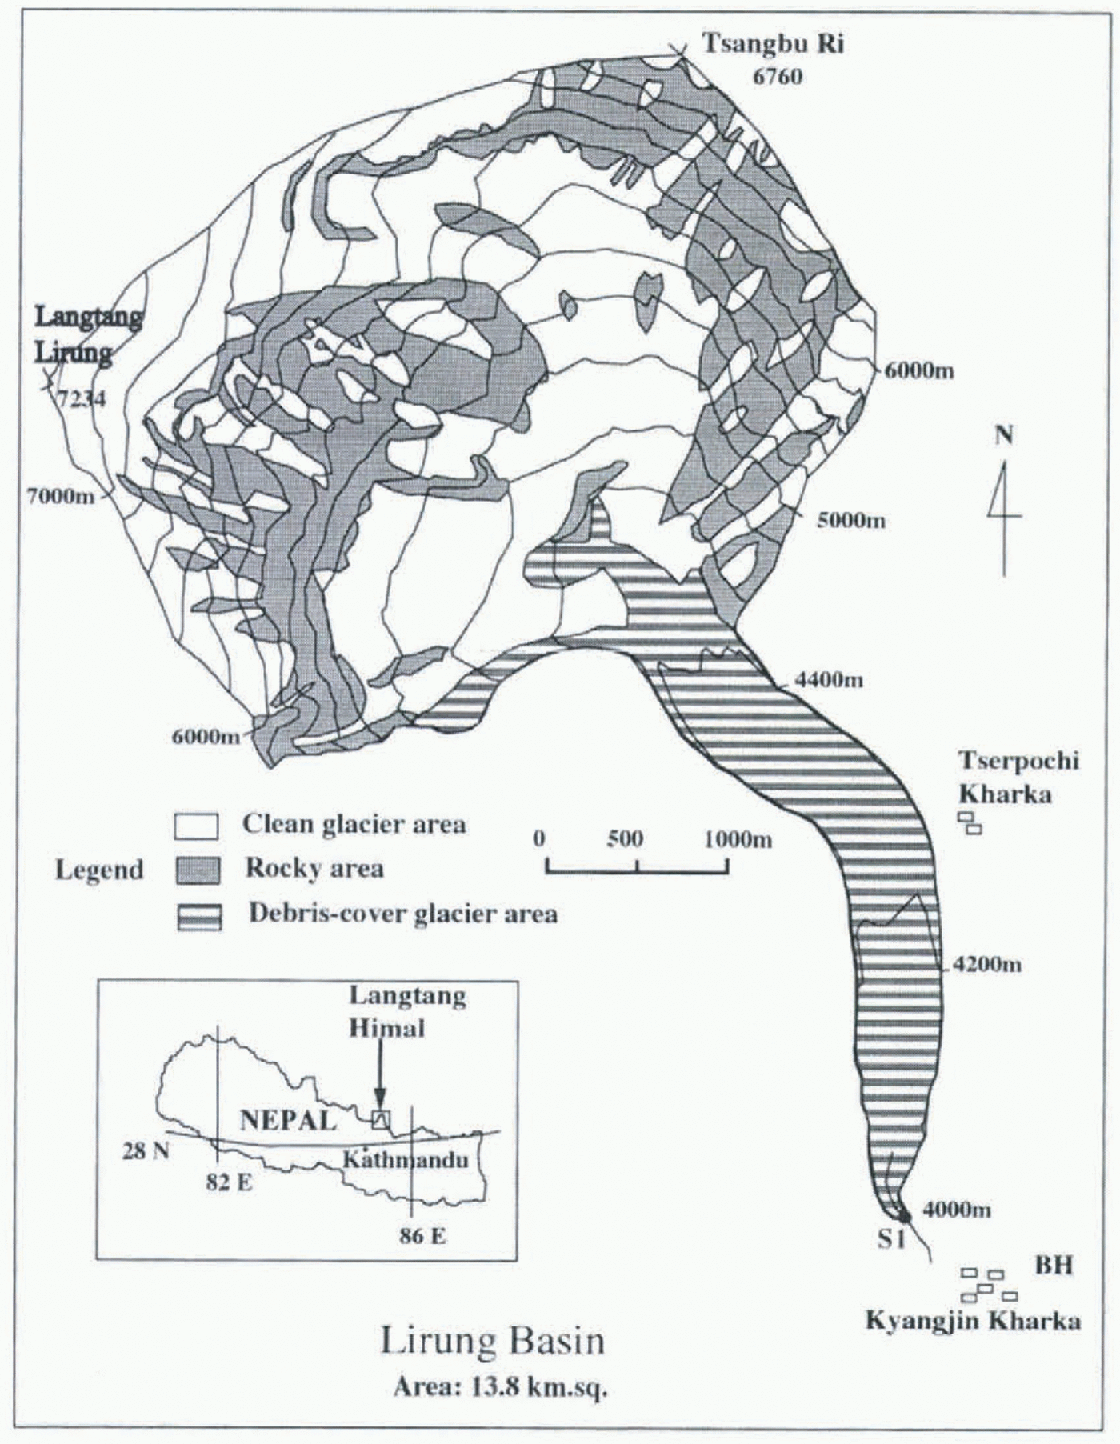
Figure 1 is a topographical map of the Lirung basin with the hydrological site (S1), and the meteorological observation site (BH) at an altitude of 3920 m a.s.l. Hydromcteorologi-cal observations have been taken regularly at KH since 1987 by the Department of Hydrology and Meteorology, Nepal. The total basin area is 13.8 km2, of which 51 % is debris-free ice, 16% debris-covered glacier, and the remaining 33% comprises steep, rocky walls.
Topograpkical map of the Lirung basin in Nepal Sl shows the location of the hydrological station and the represents the “Base House” where the meteorological observations were math .
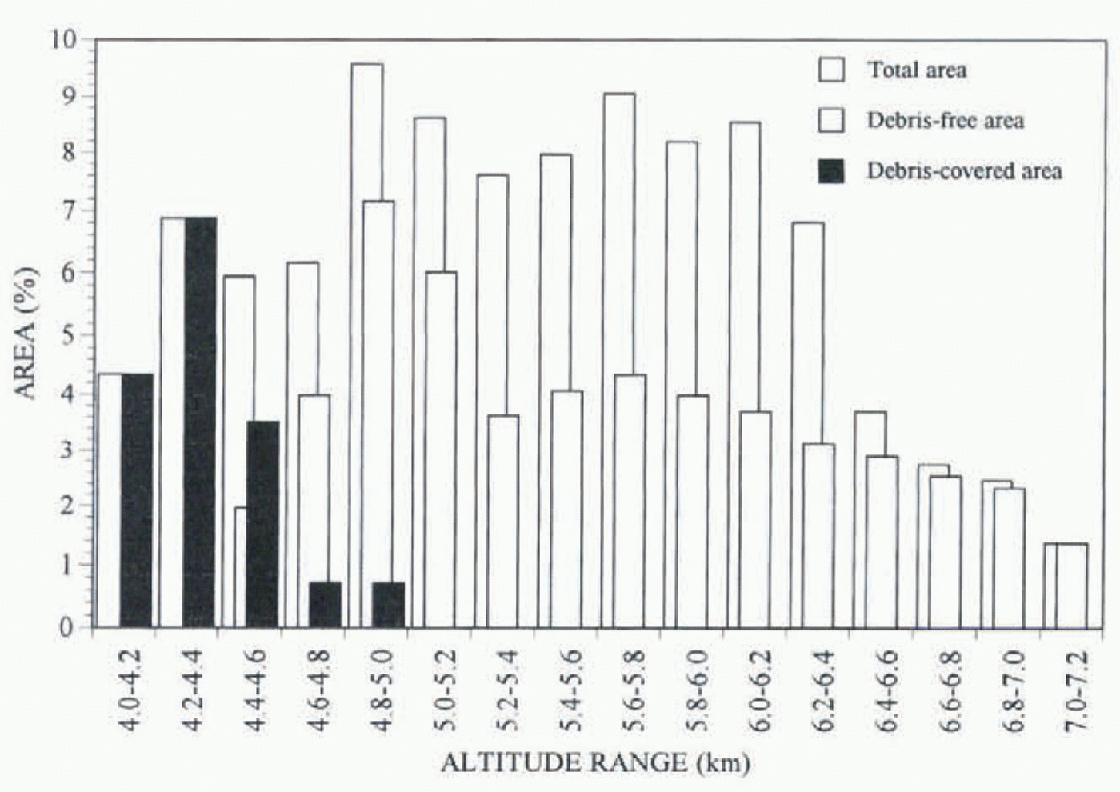
From the 1:50 000 map published by the Austrian Alpine club (1990) areal distribution of debris-free and debris-covered ice were derived at 200 m altitudinal spans for the present model calculation as shown in Figure 2. Lining Glacier is heavily debris-covered at its lower elevations. The average debris thickness around 4400 ma.s.l. was approximately 0.5 m (K. Fujita. personal communication, 1996). The albedo of the debris surface varied with a mean value of about 0.1.
Altitudinal distribution of the Limng drainage basin and the glacier areas included at 200 m intervals (the area of debris fret glacier is 51%. debris-covered glacier is 16%. and the rocky wall is 33% of the total basin).
The Model And Data
Runoff Model
The HYCYMODEL treats snow and ice meltwater the same as rainfall. This model is the same kind of conceptual runoff model that was developed for a small forested mountain catchment Reference FukushimaFukushima (1988). The schematic representation of the model is shown in Figure 3. Effective rainfall. Re(t). is determined by the mean effective soil-depth parameter and its deviation (in the present case, evaporation is neglected) Su is a linear upper-storage tank, Sb a non-linear lower-storage lank, and Sd is a non-linear lank for storm flow.
Schematic representation of the modified HYCYMODEL

This model was used to simulate the stream How with daily precipitation and daily mean air-temperature data for the 45% glacierized Langtangbasin in the Nepal Himalaya (Reference Fukushima, Watanabe and HiguchiFukushima and others, 1991).The observed streamflow was simulated well in the period between July 1985 and April 1986.
Precipitation and melt for debris-free glacier surfaces
That precipitation increases with altitude is usually true in the glacier areas in the Nepal Himttlayti (Reference Higuchi, Ageta, Yasunari and InoueHiguchi and others, 1982). In the Langlang Valley, the precipitation at 5000m was 1.3 times greater than at 1000m (Reference SekoSeko. 1987). Since precipitation data were available from BH only, the current study made the assumption that precipitation is a function of altitude as follows:
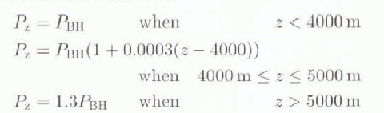
where, Pz is precipitation at altitude z meters (in mm), Pnn is precipitation observ ed at BH, located at 3920 in m.a.s.l. (in mm).
The Lirung basin was divided into 16 altitude zones of 200 m intervals. Rainfall, snow melt and ice mell were calculated at each zone. The critical air temperature between snowfall and rainfall was estimated as 2.0°C (Reference Ageta, Ohata, Tanaka, Ikegami and HiguchiAgeta and others, 1980). The lapse rate was taken to be −0.6°C/100 m.
For calculating snow melt and ice melt from debris-free areas, the empirically derived relation for Glacier AX 010 in eastern Nepal (Reference Ageta, Ohata, Tanaka, Ikegami and HiguchiAgeta and others. 1980), was used:

where, SMo is the daily snow melt and ice melt from debris-free areas (in mm) and T is the daily mean air temperalure (in °C).
Ablation under a debris layer
To evaluate glacier ablation under a debris layer, Netkawo and Young (1982) successfully proved that the surface temperature of the debris layer can be used for estimating the thermal properties of unknown material, assuming a linear temperature profile in the debris layer. Figure 1a shows an image Iroin Landsat 5 TM Band 2 depicting areas of relatively high intensity reflected radiation with bright color. Scallercd dark spots can be seen over the glacier, indicating schistose-type dark-colored debris material (Reference Inoue and YoshidaInoue and Yoshida, 1980).
A Landsat 5 TM Band 6 image 8 May 1989 was used to derive the distribution of the surface temperature of the debris layer : (Fig. 4b) since no images for 1985-86 were available. With the surface temperature, the thermal resistance (R) of the surface debris was also calculated using meteorological data taken at lhc same time as the satellite image, following the model of Reference Nakawo and YoungNakawo and Young, (1982).
Distribution of a high radiation intensity in TM 2 and b) surface temperature from TM Band 6 of LANDASAT 5 on 8 May 1989 in the debris-covered area of the Lirung Glacier.

The general energy-balance equation at the surface layer of a glacier is:

where Fr is radiation heat flux (wm−2) is sensible heat flux Wm −2;. F1 is latent heat flux (Wm−2 and Fm is the heat available to melt ice (Wm−2). All lite flux terms are taken to be positive downward.
Radialion heat flux is calculated from the equation:

where Q is incoming solar radiation (W m−2) α is surface albedo, I1 is incoming longwave radiation (Wm2) and I0 is outgoing longwave radiation (Wm−2).
The incoming longwave radiation can be calculated (Reference KondoKondo, 1967) by:

and the outgoing longwave radiation by:

where σ is the Stefan Boltzmann constant 5.67 x 10⁻⁸ Wm−2 K−4) Ra is air temperature (°C), Ts is surface temperature °C), ea is the vapor pressure of air (mb) and Cc depends on vapor pressure, cloud type and cloud thickness.
The sensible and latent heat flux is calculated by the bulk aerodynamic method:


where β is the heat transfer coefficient (4.89 J m−3 deg−1), (U is wind speed (ms ), is the laieni heat of evaporation (2494Jg −1 p is pressure (mb), Cp is the specific heat capacity of air at constant pressure (1.0J g−1deg−1 ) and es is vapor pressure at the glacier surface (mb).
The assumptions made in the model are that the stored heat in the debris layer is constant as the time-step is one day, and the temperature in the debris layer is in a stationary state, i.e.:

where R is the thermal resistance of the debris layer (m2 degW−1 ).
With the value for R thus estimated, glacier ablation under the debris layer was calculated again utilizing the Reference Nakawo and YoungNakawo and Miung (1982) model for meteorological conditions during the period in question.
Results and Discussion
The temperature along a transverse line in different parts of the Liritng Glacier Is shown in Figure 5. Figure 4b and Figure 5 show that debris-surface temperature is lower on the glacier surface than on the lateral moraines, which indicates that the debris-surface temperature is lowered by the pre-sence of the ice body underneath. Ground observations revealed that ice cliffs and ponds are predominant on the left side of the glacier, where temperature is comparatively low. It can be seen that the maximum and minimum temperatures on till transverse lines are similar (i.e. the range is small), indicating a generally uniform distribution of debris material over the length of the glacier. This is in contrast to data from Khumbu Glacier (Reference Nakawo, Iwata, Watanabe and YoshidaNakawo and others, 1986) where temperature distribution was not uniform.
Transversal temperature profile along the white lines indicated on Fig. 4a of the Lirung Glacier derived from LANDAST. 5 TM Band 6 on 8 May 1989 at a) 4300 m, b) 4200 m and c) 4080 m.a.s.l.
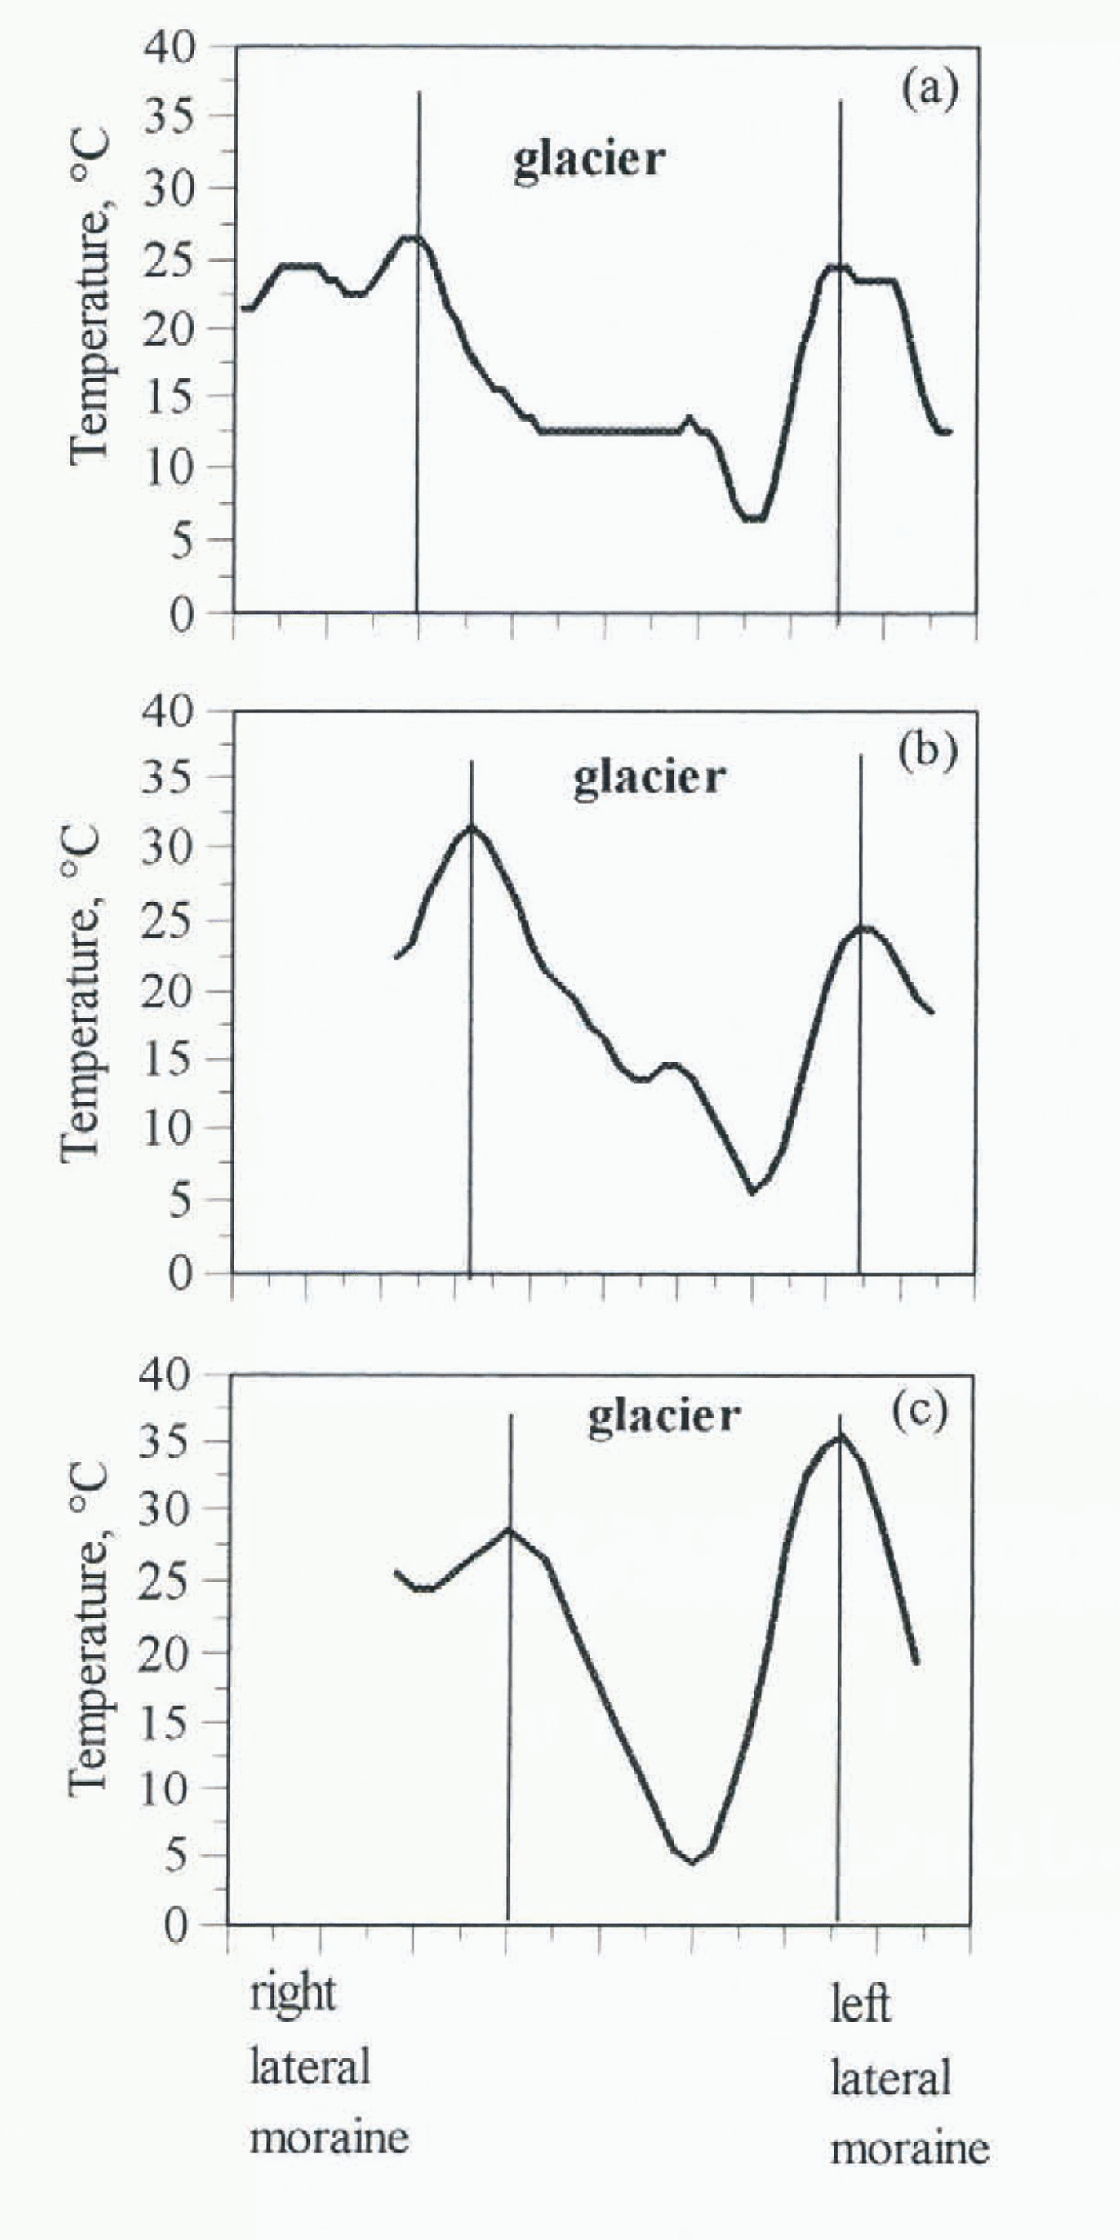
The maximum temperature of lateral moraines range on the glacier are in the 25-15°C and the minimum temperature range is 4–6°C. Similar results were obtained when airborne measurements ofSurface temperatures were made by IR radiometer at another debris-covered glacier in eastern Nepal (Reference YasunariYasunari, 1980). The resolution of a unit pixel in TM Band 6 is 120 m, which is rather large for the Liruhg basin, the approximate width of which is only 500 m.
The average surface temperature was calculated, for the whole debris-covered area, as 12°C This value gave a thermal resistance of about 0.14 m2 degW −1 as a mean value for the whole debris cover. Using this thermal resistance, the daily ablation from the debris-covered area was calculated with the meteorological parameters observed at BH from July 1985 to June 1986, making the assumption that the debris condition had not changed between 1985 and 1989.
Figure 6 shows a comparison of the daily discharges from July to September 1985, calculated for different basin conditions as follows (a) assuming the whole drainage basin is debris-free, (b) assuming no melt from the debris-covered areas, and (c) with melt under the debris layer calculated with the constant thermal resistance derived from the satellite data. When the basin is assumed to be debris-free, (a) the simulated discharge is higher than the observed discharge. In the case of no melt from the debris-covered area (b) the simulated discharge is much smaller than the observed value. The ablation under the debris layer (c) has results most compatible with the field data. This indicates that the estimation of glacier ablation under the debris layer is necessary for runoff modeling. It can be seen that the ease that included the melt from the debris area improved the result by 20% more than the case of no melt from the debris-covered area.
Comparison of daily observed discharge to simulated runoff in the Lirung drainage basin using the HYCYMODEL, including the melt from the debris zones.
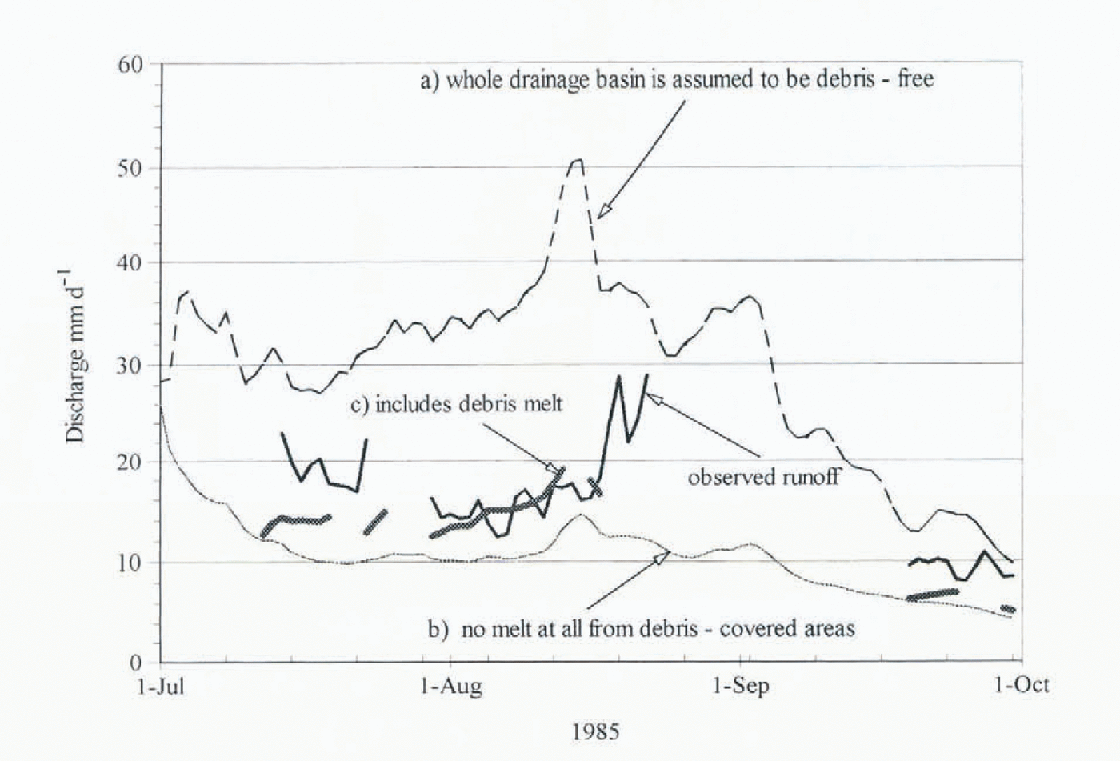
Although the total discharge for 30 July-13 August agrees fairly well with the Iield data, the mean discharge for the beginning and the end of the observation period is underestimated by 30%. This discrepancy might be attributed to the averaged surface temperature used in the calculation. Since the relationship between the rate of ablation and the surface temperature is non-linear, the areas with the lowest surface temperatures would produce more melt-water than that estimated. It is necessary, therefore, to obtain a map of surface-temperature variability using higher resolution techniques, and to assess the contribution of individual sites in more detail.
Concluding Remarks
Satellite data can be used to derive surface-temperature data from Landsat 5 TM Band 6 images. The glacier-ablation rate calculated on the basis of average thermal properties of unknown debris material derived from satellite data improved the modeled results. However, a further study of ground and airborne observations is required to obtain a better understanding of the distribution of surface temperatures. Detailed study of debris distribution, with higher resolution of surface temperature, would greatly improve the estimates of glacier ablation under debris layers, and. accordingly, the estimate of discharge from debris-covered glacier basins.
Acknowledgements
The authors are grateful to K. Seko and H. Yabuki of the Laboratory of Gryosphere Variation, Instituie for Hydrospheric Atmospheric Sciences, for helping to acquire and process the satellite data.



