Introduction
Bipolar disorders (BPs) show pleomorphic courses with diverse symptom presentations (Lieberman et al., Reference Lieberman, Peele and Razavi2008). Because each patient has distinct clinical disease courses, mood episode symptoms, and comorbid psychiatric conditions (Suppes et al., Reference Suppes, Leverich, Keck, Nolen, Denicoff, Altshuler, McElroy, Rush, Kupka, Frye, Bickel and Post2001; Perlis et al., Reference Perlis, Miyahara, Marangell, Wisniewski, Ostacher, DelBello, Bowden, Sachs, Nierenberg and Investigators2004; Simon et al., Reference Simon, Otto, Weiss, Bauer, Miyahara, Wisniewski, Thase, Kogan, Frank, Nierenberg, Calabrese, Sachs, Pollack and Investigators2004a; Kessler et al., Reference Kessler, Ormel, Petukhova, McLaughlin, Green, Russo, Stein, Zaslavsky, Aguilar-Gaxiola, Alonso, Andrade, Benjet, de Girolamo, de Graaf, Demyttenaere, Fayyad, Haro, Hu, Karam, Lee, Lepine, Matchsinger, Mihaescu-Pintia, Posada-Villa, Sagar and Ustun2011), it seems to be nearly impossible to find patients who show identical clinical characteristics. The complexity of the phenotypes might reflect the complexity of the biological and genetic underpinnings of BPs. Therefore, identifying simpler phenotypic subgroups would contribute to finding biological mechanisms and novel targets for drug discovery.
Current DSM (the American Psychological Association Diagnostic and Statistical Manual of Mental Disorders) nosology appears not to capture biologically homogeneous BP subtypes (Insel et al., Reference Insel, Cuthbert, Garvey, Heinssen, Pine, Quinn, Sanislow and Wang2010); the DSM defines only bipolar I (BP-I) and bipolar II (BP-II) as BP subtypes, and the two diagnoses are distinguished only by the severity of the manic episodes. The DSM does propose specifiers for BP, e.g. with mixed features, with rapid cycling, with melancholic features, etc. However, it is unclear how these characteristics are inter-related or correlated with other clinical variables.
Previous investigators have attempted to delineate homogeneous clinical BP subtypes or dimensions and mostly applied these phenotypes in genetic studies. Researchers did perform an earlier large-scale analysis of the subjects of a National Institute of Mental Health BP genetics initiative (Faraone et al., Reference Faraone, Su and Tsuang2004) and extracted five symptom dimensions from 29 recorded symptoms. Authors have also identified multiple different sets of symptom dimensions and adopted these as phenotypes in recent genome-wide (Meier et al., Reference Meier, Mattheisen, Vassos, Strohmaier, Treutlein, Josef, Breuer, Degenhardt, Muhleisen, Muller-Myhsok, Steffens, Schmael, McMahon, Nothen, Cichon, Schulze, Rietschel, Kelsoe, Greenwood, Nievergelt, Barrett, McKinney, Shilling, Schork, Smith, Bloss, Nurnberger, Edenberg, Foroud, Koller, Gershon, Liu, Badner, Scheftner, Lawson, Nwulia, Hipolito, Coryell, Rice, Byerley, McMahon, Chen, Schulze, Berrettini, Potash, Zandi, Mahon, McInnis, Craig and Szelinger2012; Ruderfer et al., Reference Ruderfer, Fanous, Ripke, McQuillin, Amdur, Gejman, O'Donovan, Andreassen, Djurovic, Hultman, Kelsoe, Jamain, Landen, Leboyer, Nimgaonkar, Nurnberger, Smoller, Craddock, Corvin, Sullivan, Holmans, Sklar and Kendler2014) and candidate gene (Maciukiewicz et al., Reference Maciukiewicz, Dmitrzak-Weglarz, Pawlak, Leszczynska-Rodziewicz, Zaremba, Skibinska and Hauser2014) studies. In addition, authors have proposed comorbidity-based BP sub-grouping (Kerner et al., Reference Kerner, Lambert and Muthen2011; Monahan et al., Reference Monahan, Stump, Coryell, Harezlak, Marcoulides, Liu, Steeger, Mitchell, Wilcox, Hulvershorn, Glowinski, Iyer-Eimerbrink, McInnis and Nurnberger2015) and symptom dimensions that cover broader psychoses including schizophrenia and BP-I (Ventura et al., Reference Ventura, Nuechterlein, Subotnik, Gutkind and Gilbert2000; Labbe et al., Reference Labbe, Bureau, Moreau, Roy, Chagnon, Maziade and Merette2012).
Previous studies could not generate dimensional BP phenotypes that can be consistently applied in future research because of differences among studies in terms of ascertained clinical characteristics, sample compositions, and measurement tools. To identify valid psychopathologic domains of BP, future researchers need to encompass comprehensive lifetime symptoms and characteristics described in the current DSM. Considering the high variability in the disease course (Solomon et al., Reference Solomon, Leon, Coryell, Endicott, Li, Fiedorowicz, Boyken and Keller2010) and the clinical importance of the comorbidities (Simon et al., Reference Simon, Otto, Wisniewski, Fossey, Sagduyu, Frank, Sachs, Nierenberg, Thase and Pollack2004b; Nierenberg et al., Reference Nierenberg, Miyahara, Spencer, Wisniewski, Otto, Simon, Pollack, Ostacher, Yan, Siegel, Sachs and Investigators2005; McElroy et al., Reference McElroy, Crow, Blom, Biernacka, Winham, Geske, Cuellar-Barboza, Bobo, Prieto, Veldic, Mori, Seymour, Bond and Frye2016), authors should also include variables that reflect the disease course and comorbid psychiatric conditions. In addition, researchers need to clarify the interplays among various phenotype dimensions and their relationships with the current BP-I and BP-II categories.
In this study, we aimed to determine lifetime BP psychopathology dimensions; we also investigated the interplay between these dimensions and their differing associations with BP-I and BP-II. We first deconstructed the DSM criteria for mood episodes and treated each symptom as a single variable from a lifetime perspective. We also included variables that covered BP comorbidity, long-term courses, and specifiers suggested in the DSM.
Methods
Study subjects
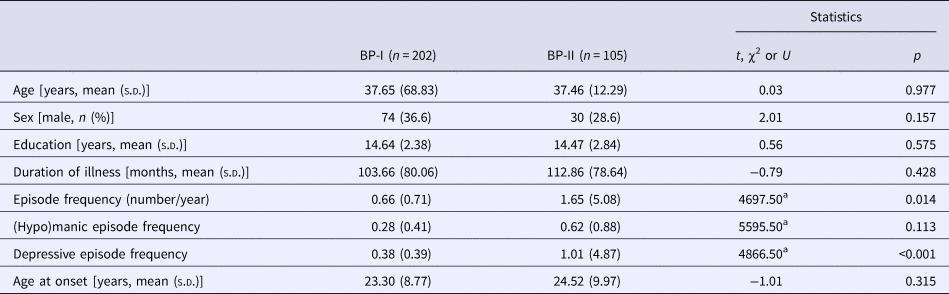
We recruited patients who met the DSM-IV-TR diagnostic criteria (American Psychiatric Association, 2000) for BP-I (n = 202) and BP-II (n = 105) from the Samsung Medical Center and Seoul National University Bundang Hospital. We assessed clinical symptoms on a lifetime basis through direct patient interviews using the Korean version of the Diagnostic Interview for Genetic Studies (DIGS) (Joo et al., Reference Joo, Joo, Hong, Hwang, Maeng, Han, Yang, Lee and Kim2004) or the Structured Clinical Interview for DSM-IV Axis I Disorders (SCID) (Han et al., Reference Han, Ahn, Siong, Cho, Kim, Bae, Cho, Jeon, Suh, Hahm, Lee and Park2000), using the DIGS at Samsung Medical Center and the SCID at Seoul National University Bundang Hospital. All subjects were under pharmacological treatment. Interview was conducted when subjects were clinically stable (i.e. The Clinical Global Impression of Severity scale ⩽3), and additional information from available care-givers and their physicians were also collected. We obtained written informed consent from all subjects after a complete explanation of the study. Table 1 displays the basic demographic characteristics of the participants; there were no significant differences between the BP-I and BP-II subjects.
Demographic and clinical characteristics of subjects

BP-I, bipolar I disorder; BP-II, bipolar II disorder; s.d., standard deviation.
a Mann–Whitney U test.
This study was approved by the institutional review boards at Samsung Medical Center and Seoul National University Bundang Hospital.
Variables included in the analysis
We included a total of 41 variables in the analyses, all coded as dichotomous (0: absent, 1: present); we evaluated variables related to clinical courses and symptom characteristics using data from the DIGS or the SCID, and we also evaluated seasonality and eveningness. We excluded from the analysis clinical variables that we observed in <1% of subjects (including dysthymia, anorexia nervosa, catatonia, and personality disorders) and those observed only in females (including premenstrual dysphoric disorder, postpartum onset mood episodes, and postmenopausal mood episodes).
Clinical course variables
We included in the analysis early age at onset, frequent episodes, polarity at onset, rapid cycling, seasonality, and unipolar mania. We defined early onset as <22 years old based on prior studies (Bellivier et al., Reference Bellivier, Golmard, Henry, Leboyer and Schurhoff2001; Lin et al., Reference Lin, McInnis, Potash, Willour, MacKinnon, DePaulo and Zandi2006; Hamshere et al., Reference Hamshere, Gordon-Smith, Forty, Jones, Caesar, Fraser, Hyde, Tredget, Kirov, Jones, Craddock and Smith2009). We defined frequent episodes as number of lifetime mood episodes both (hypo)manic and depressive divided by illness duration (i.e. number of episodes per year) >1.0, which was 75% of the episode frequencies in the total sample. Polarity of onset was polarity of the first episode [0: depressive, 1: (hypo)manic], and we defined rapid cycling following the DSM-IV-TR criteria. We measured seasonality using the Seasonal Pattern Assessment Questionnaire (SPAQ) (Rosenthal et al., Reference Rosenthal, Bradt and Wehr1987). We coded sub-syndromal seasonal affective disorder and seasonal affective disorder defined using the SPAQ as seasonality. Unipolar mania was positively coded when subjects experienced only manic episodes.
Depressive episode ratings
Depressive episode variables were lifetime presence of depressed mood, loss of interest, decreased appetite, increased appetite, insomnia, hypersomnia, psychomotor agitation, psychomotor retardation, fatigue, guilty feeling, decreased concentration, suicidal ideation, and psychotic symptoms during depressive episodes. We also defined frequent major depression as number of lifetime major depressive episodes divided by duration of illness >0.61, which was 75% of the major depressive episode frequencies in the total sample.
(Hypo)manic episode ratings
(Hypo)manic episode variables were lifetime presence of elevated mood, irritability, grandiosity, decreased sleep need, talkativeness, flights of ideas, distractibility, increased goal-directed activity, excessive involvement in activity that may cause painful consequences, psychotic symptoms during manic episodes, mixed mania, and unipolar mania, with mixed mania defined as the presence of mixed episodes based on DSM-IV-TR criteria. We defined frequent (hypo)mania as frequency >0.5, which was 75% of the (hypo)manic episode frequencies in the total sample.
Axis I comorbid conditions
We evaluated lifetime existence of axis I comorbid conditions, excluding comorbid conditions observed in <1% of all subjects. We included in the analysis alcohol and substance use disorder, obsessive compulsive disorder, panic disorder, phobic disorders, bulimia nervosa, and somatization disorder.
Other specific conditions
We also evaluated hyperthymic temperament, lifetime suicide attempts, and eveningness, which we measured using the standardized Korean version (Yoon et al., Reference Yoon, Shin, Kook and Lee1997) of the Composite Scale of Morningness (CSM) (Smith et al., Reference Smith, Reilly and Midkiff1989). Because there was no standard cut-off score for defining eveningness, we used our data from a general population (Baek et al., Reference Baek, Kim, Kim, Ryu, Lee, Ha and Hong2016), in which eveningness was defined as CSM score ⩽20 (below 2 standard deviations).
Statistical analysis
Imputation
Before constructing the factors, we performed multiple imputations to supplement missing data following the method proposed by McGrath et al. (Reference McGrath, Avramopoulos, Lasseter, Wolyniec, Fallin, Liang, Nestadt, Thornquist, Luke, Chen, Valle and Pulver2009). We used SAS MI with the Markov chain Monte Carlo (MCMC) algorithm. Because MCMC in SAS MI assumes Gaussian distribution, MCMC outputs can be <0 or >1; to reduce the bias caused by these output values, we accepted the MCMC results when all observations were bounded between −0.5 and 1.5. We made 10 imputation sets and ultimately constructed a factor analysis data set that combined these sets plus one additional set that we made by averaging the 10 imputation results.
Factor analysis
To identify the factors, we performed factor analysis in SAS, using iterative principal component analysis to calculate the factors. To maximize the variances explained by the small number of factors, we performed varimax rotation, and to determine the number of factors, we considered the Scree Test Acceleration Factor rule and Velicer's minimum average partial (MAP) test.
Factor-based structural equation modeling
We applied structural equation modeling (SEM) to examine the unique relationships between dimensions (factors) extracted in the above-mentioned analyses. We scaled all dimensions by setting the factor variance factor to 1. We assessed model fit with the χ2 test, the standardized root mean residual (SRMR), and the root mean square error of approximation (RMSEA).
Results
Identifying phenotype dimensions
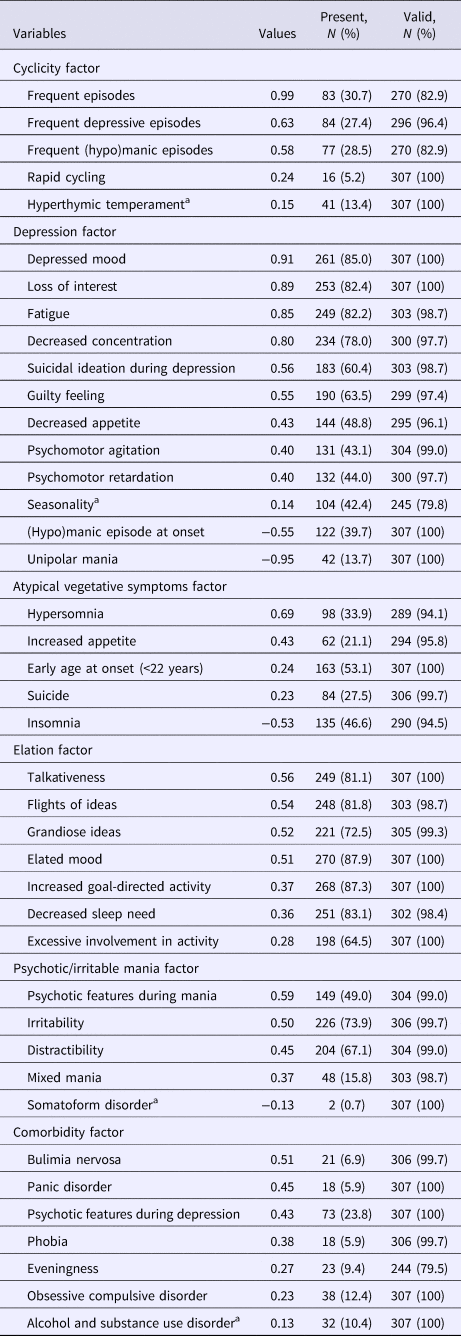
Both the scree plot and Velicer's MAP test indicated that a six-factor solution was the most appropriate. All of the authors separately reviewed solutions from five to eight factors, and the six-factor solution also obtained the highest face validity; each variable loaded on only one factor. Table 2 presents the results for the final factor solution. Each factor reflects unique clinical characteristics: cyclicity, depression, atypical vegetative symptoms, elation, psychotic/irritable mania, and comorbidity dimension. We determined variables with rotated factor loadings of >0.2 to be valid members of each factor and entered them into additional analyses, excluding variables with rotated factor loadings of <0.2 such as hyperthymic temperament, seasonality, somatoform disorder, and alcohol and substance use disorder.
The six-factor phenotype dimensions of bipolar disorders
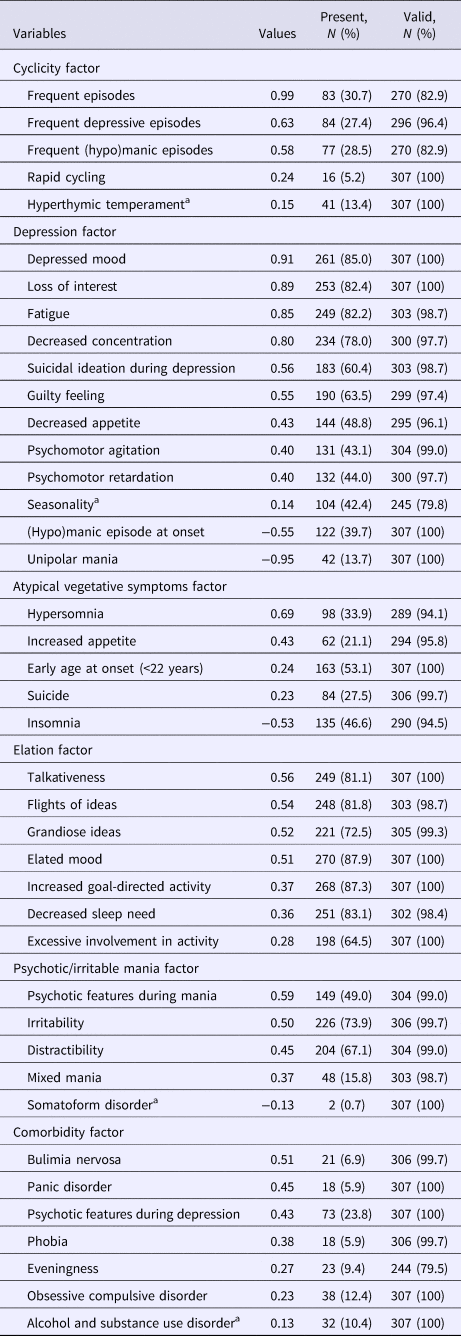
Unipolar mania was defined as having manic episodes only. Frequent episodes was defined as frequency (number of lifetime mood episodes both (hypo)manic and depressive divided by duration of illness) higher than 1.0, which was 75% of the episode frequencies in the total sample. Frequent major depression was defined as frequency (number of lifetime major depressive episodes divided by illness duration) higher than 0.61, which was 75% of the major depressive episode frequencies in the total sample. Frequent (hypo)mania was defined as frequency >0.5, which was 75% of the frequencies of (hypo)manic episodes in the total sample. Eveningness was defined as Composite Scale of Morningness score ⩽20. Seasonality was defined as sub-syndromal or syndromal seasonal affective disorder evaluated using the Seasonal Pattern Assessment Questionnaire.
a Excluded in the additional analyses.
To examine the robustness of our phenotype dimension structure, we performed complementary analyses excluding missing data. A total of 165 samples without any missing variable (the complete dataset) were included in the analysis. In six-factor model, the factor loading vector of each factor generated using the complete dataset showed high correlations with that generated from the original imputed data (r = 0.83–0.99; online Supplementary Table S1), indicating the dimensional structures are stable.
To test the invariance of factor structures between BP-I and BP-II, the same factor analysis was separately performed for BP-I and BP-II. In these analyses, we excluded three variables (psychotic feature during mania, mixed feature during mania, and unipolar mania) that were all coded as 0 (absent) in BP-II. Six-factor solution for BP-I and five-factor solution for BP-II replicated well the original factor structure of the whole BPs samples (online Supplementary Table S2). Factor loading vector of each factor showed moderate-to-high correlation (r = 0.51–0.82) between BP-I and BP-II except for elation-1 factor of BP-I which was not extracted in BP-II (online Supplementary Table S3).
Interplay between phenotype dimensions
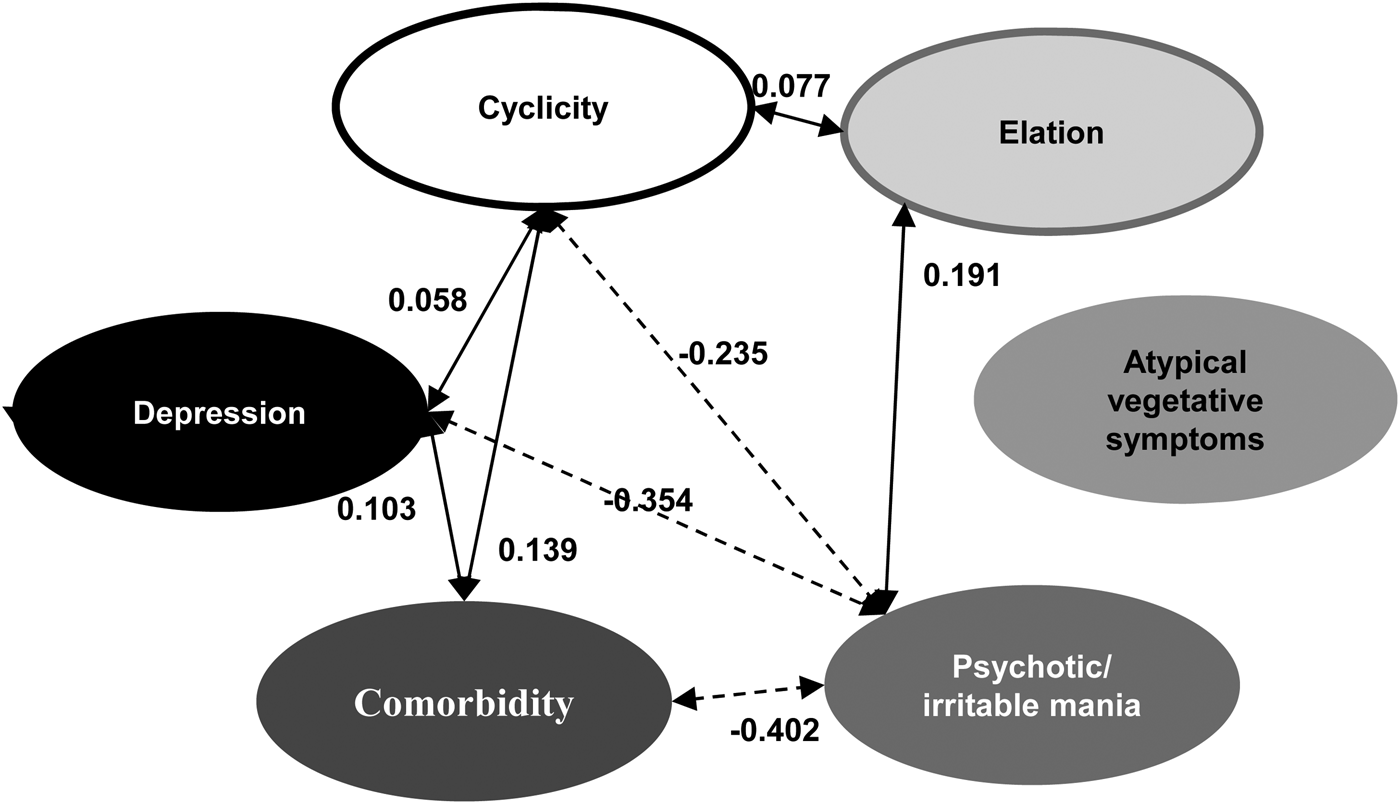
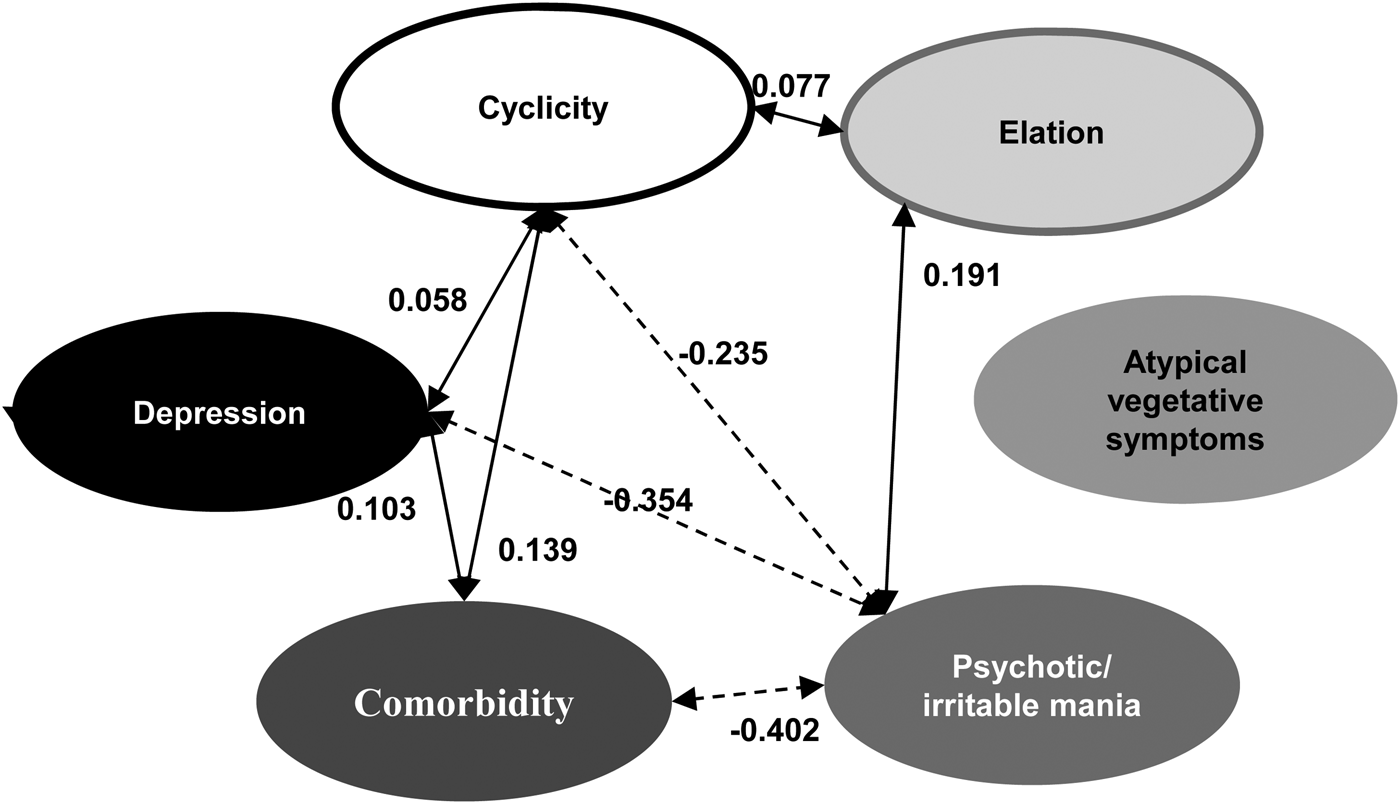
After we identified the six factors, we performed SEM to fit the model, examining the relationships between factors, and the model generally provided good fit with the data [χ2 = 50 040.77, df = 703, p < 0.001, SRMR = 0.091, RMSEA = 0.08, 90% CI (0.079–0.082)] (Fig. 1).
Structural equation modeling (SEM) analyses to determine the relationships among factors. Solid lines indicate positive correlations; dotted lines indicate negative correlations.

Cyclicity, depression, and comorbidity had statistically significant positive associations with one another (estimates: between cyclicity and depression = 0.058; between cyclicity and comorbidity = 0.139; between depression and comorbidity = 0.103), and elation had positive associations with cyclicity (estimates = 0.077) and psychotic/irritable mania (estimates = 0.191); psychotic/irritable mania had negative associations with cyclicity (estimates = −0.235), depression (estimates = −0.354), and comorbidity (estimates = −0.402). Atypical vegetative symptoms did not show any statistically significant associations with other factors. Online Supplementary Tables S4 and S5 summarize the weight and path coefficients of each variable.
Comparing the dimensional structures of BP-I with BP-II
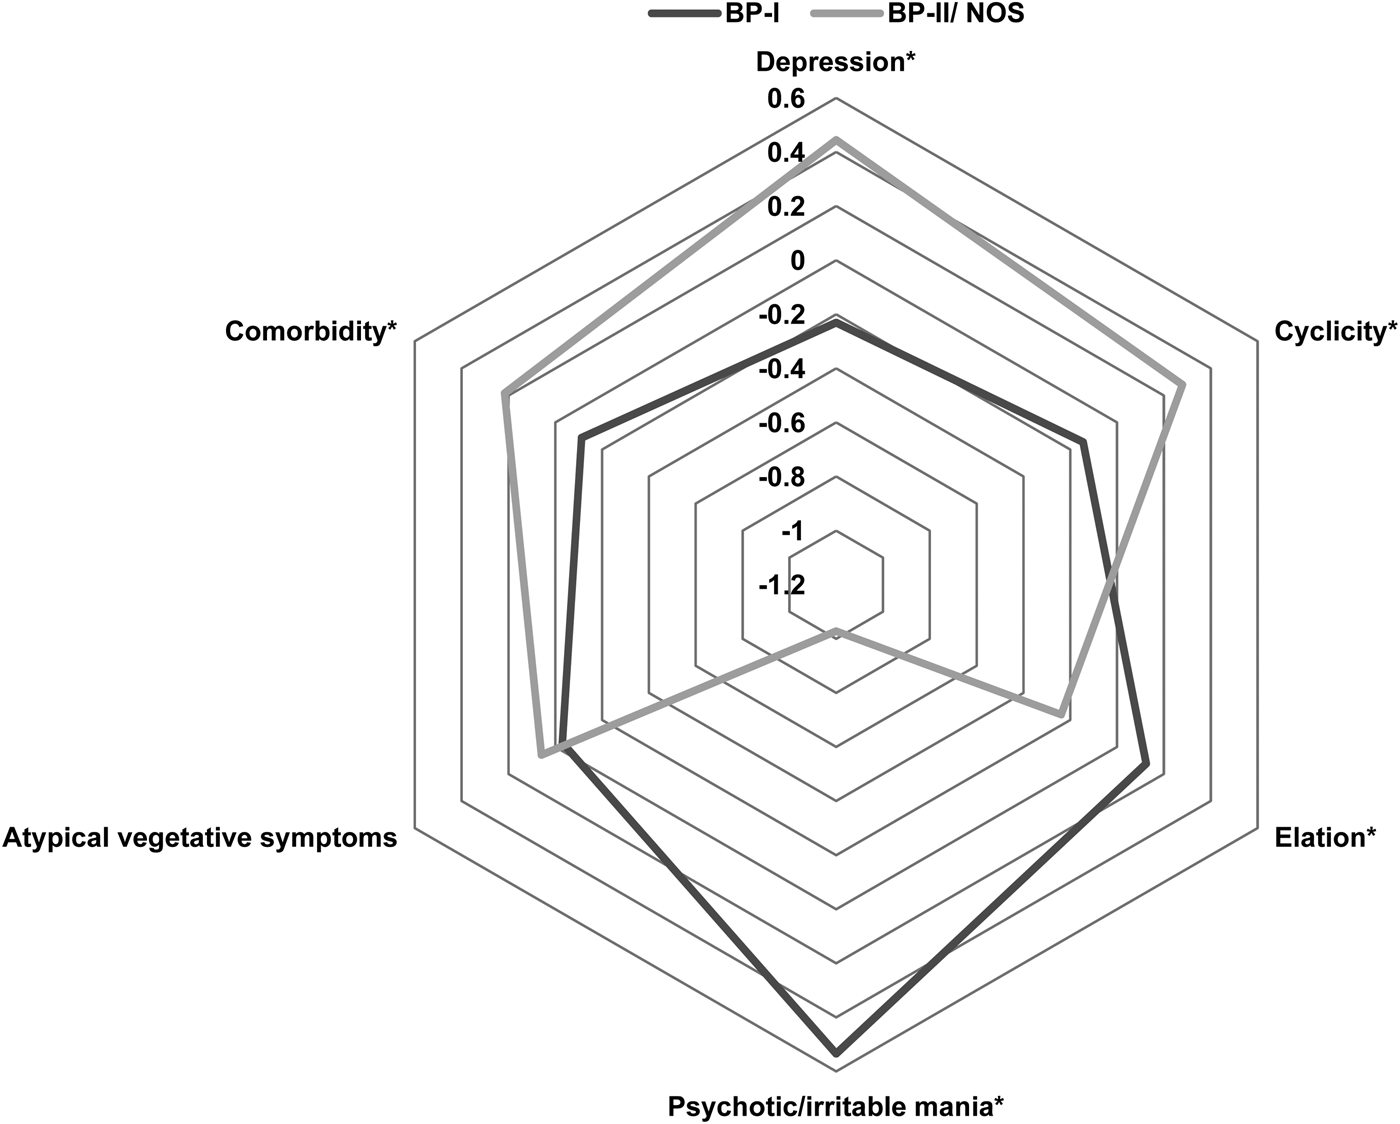
We compared the factor scores for BP-I and for BP-II using the six-factor model (Fig. 2), and except for atypical vegetative symptoms, BP-I and BP-II showed significant differences in scores for all factors. As expected from the DSM criteria, BP-I showed higher scores for psychotic/irritable mania and elation, whereas BP-II showed higher scores for cyclicity, depression, and comorbidity.
Comparison of factor scores between bipolar I and bipolar II disorders. Asterisks indicate factors that were significantly different between two groups.
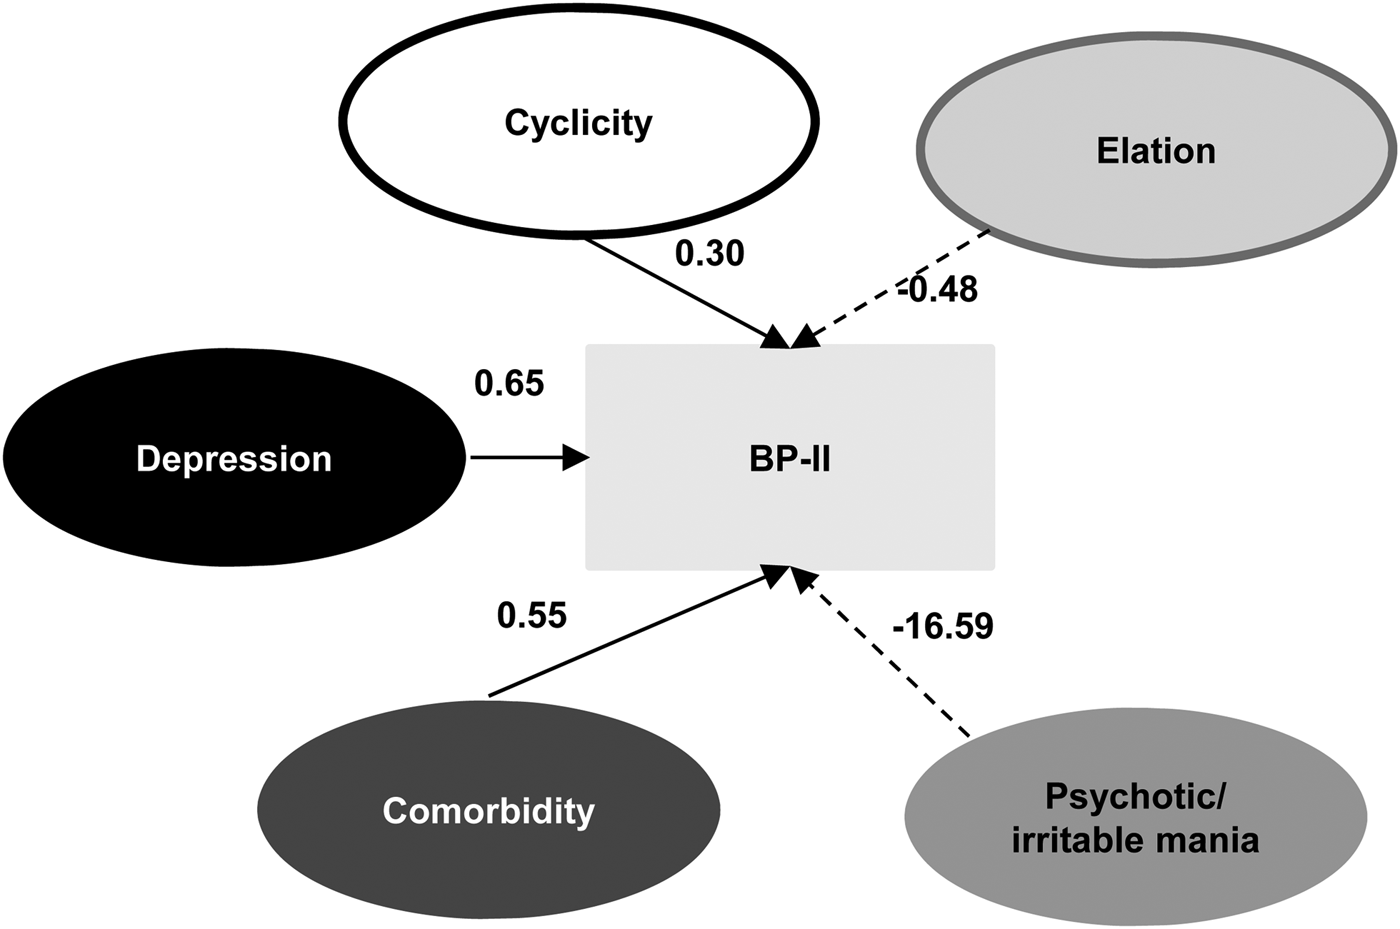
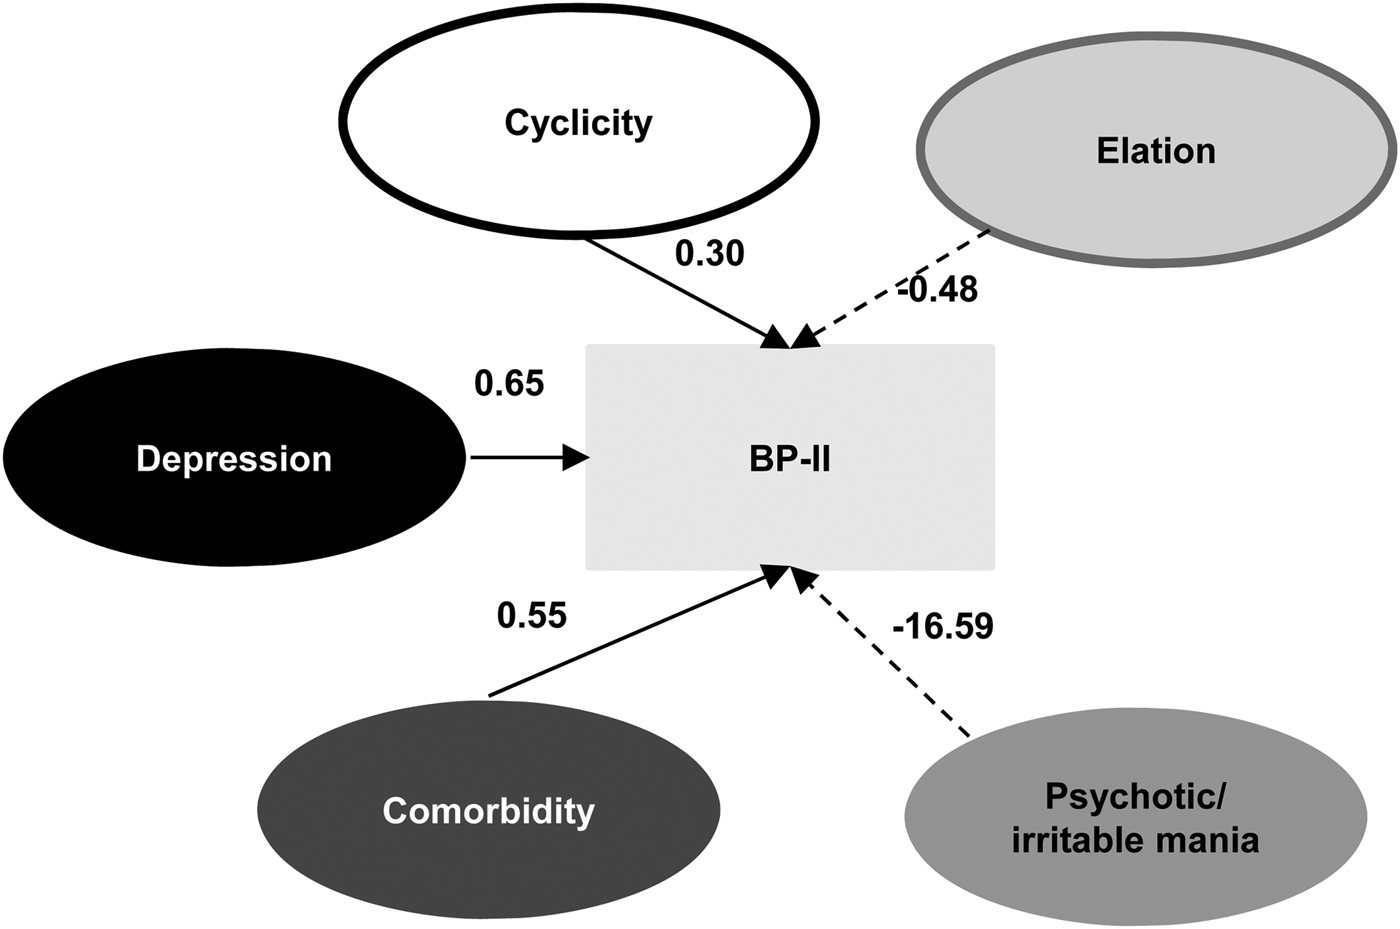
We also applied SEM analysis in discriminating BP-II from BP-I (Fig. 3), and the model generally provided good fit with the data [χ2 = 52 446.3, df = 666, p < 0.001, SRMR = 0.0896, RMSEA = 0.08, 90% CI (0.081–0.082)]. Psychotic/irritable mania (β = −16.59), elation (β = −0.48), depression (β = 0.65), comorbidity (β = 0.55), and cyclicity (β = 0.30) significantly contributed to differentiating BP-II from BP-I; atypical vegetative symptoms was not included in the model. We summarize the weight and path coefficients for this model in the supplementary materials (online Supplementary Tables S6 and S7).
Structural equation modeling analysis to discriminate bipolar II from bipolar I disorders using psychopathology dimension models. Solid lines indicate factors more significantly associated with bipolar II than with bipolar I disorders; dotted lines indicate factors more significantly associated with bipolar I disorders. Numbers indicate β coefficients.
Discussion
Most BP patients do not experience all items of symptoms listed in the criteria of manic or depressive episode of the DSM. In addition, BP-II, which differs from BP-I only in terms of the severity of manic-side symptoms by DSM definition, shows different clinical courses, comorbidity and frequently presented symptoms during (hypo)manic and depressive episodes. Given that complex clinical manifestations of BPs might reflect underlying biological complexity (Charney et al., Reference Charney, Ruderfer, Stahl, Moran, Chambert, Belliveau, Forty, Gordon-Smith, Di Florio, Lee, Bromet, Buckley, Escamilla, Fanous, Fochtmann, Lehrer, Malaspina, Marder, Morley, Nicolini, Perkins, Rakofsky, Rapaport, Medeiros, Sobell, Green, Backlund, Bergen, Jureus, Schalling, Lichtenstein, Roussos, Knowles, Jones, Jones, Hultman, Perlis, Purcell, McCarroll, Pato, Pato, Craddock, Landen, Smoller and Sklar2017), identifying simplified clinical attributes is crucial for delineating their biological bases. In the current study, we measured symptoms, courses, and comorbid conditions as lifetime characteristics in patients with BPs and entered them into a factor analysis. We identified six phenotype dimensions, and the SEM for these dimensions provided an integrative view of the dimensions as well as the complex psychopathology of BPs.
Lifetime psychopathology dimensions
Manic-side symptoms had dual-factor structures in our study; Akiskal and colleagues (Benazzi and Akiskal, Reference Benazzi and Akiskal2003; Akiskal et al., Reference Akiskal, Hantouche and Allilaire2003b) suggested that the irritable, dark nature of hypomania composed a separate factor from its elated, sunny nature, which corroborates our current findings. Authors of previous studies separately extracted the elation and irritability factors when screening for hypomanic symptoms in the general population (Bae et al., Reference Bae, Lee, Baek, Kim, Cho, Ryu, Ha and Hong2014; Lee et al., Reference Lee, Oh, Lee, Kim, Kim and Hong2016). A line of evidence shows that elated mania and irritable mania had distinct biological backgrounds (Valiengo et al., Reference Valiengo, Soeiro-de-Souza, Marques, Moreno, Juruena, Andreazza, Gattaz and Machado-Vieira2012; Greenwood et al., Reference Greenwood and Kelsoe2013), and other study authors (Sato et al., Reference Sato, Bottlender, Kleindienst and Moller2002; Akiskal et al., Reference Akiskal, Azorin and Hantouche2003a; Hanwella and de Silva, Reference Hanwella and de Silva2011) who investigated only manic patients suggested psychotic mania as a separate factor. In the current study, which encompassed both manic and hypomanic episodes, the psychotic feature during mania merged into a single factor with irritability, and this factor also included distractibility and mixed features. A nationwide register-based cohort study conducted in Denmark (Ostergaard et al., Reference Ostergaard, Bertelsen, Nielsen, Mors and Petrides2013) showed a significant association between psychotic mania and mixed affective episodes, which corroborates our findings.
For depression, the traditional melancholic and atypical types appeared to be reflected in our findings, and atypical vegetative symptoms constructed a separate factor from other depressive symptoms; this result is also in line with prior findings (Serretti et al., Reference Serretti, Lattuada, Cusin, Macciardi and Smeraldi1998; Maciukiewicz et al., Reference Maciukiewicz, Czerski, Leszczynska-Rodziewicz, Kapelski, Szczepankiewicz, Dmitrzak-Weglarz, Skibinska, Pawlak, Hauser and Karlowski2012) that the atypical domain was identified bipolar depression symptomatology. In this study, atypical vegetative symptoms showed no interplay with other factors and were equally prevalent in both BP-I and BP-II. Sleep problems were commonly observed in BPs regardless of subtypes (Hoertel et al., Reference Hoertel, Le Strat, Angst and Dubertret2013; Geoffroy et al., Reference Geoffroy, Hoertel, Etain, Bellivier, Delorme, Limosin and Peyre2018). Earlier studies on the pharmacotherapy of depression suggested a different approach to atypical depression (Sargant, Reference Sargant1962), and in addition, in a recent study of ours, we reported that increased appetite in depressive episodes was associated with poorer response to maintenance mood stabilizer therapy (Ahn et al., Reference Ahn, Baek, Yang, Kim, Cho, Choi, Lee, Park and Hong2017).
Comorbid conditions are common and play an important role in the clinical features of BPs (McElroy et al., Reference McElroy, Altshuler, Suppes, Keck, Frye, Denicoff, Nolen, Kupka, Leverich, Rochussen, Rush and Post2001). Kessler et al. (Reference Kessler, Ormel, Petukhova, McLaughlin, Green, Russo, Stein, Zaslavsky, Aguilar-Gaxiola, Alonso, Andrade, Benjet, de Girolamo, de Graaf, Demyttenaere, Fayyad, Haro, Hu, Karam, Lee, Lepine, Matchsinger, Mihaescu-Pintia, Posada-Villa, Sagar and Ustun2011) suggested a dimensional spectrum model of psychopathology that is composed of internalizing (anxiety and mood disorders) and externalizing (behavior and substance disorders) factors. Adopting this concept in a clinical investigation, Monahan et al. (Reference Monahan, Stump, Coryell, Harezlak, Marcoulides, Liu, Steeger, Mitchell, Wilcox, Hulvershorn, Glowinski, Iyer-Eimerbrink, McInnis and Nurnberger2015) suggested two-factor and four-cluster models (pure BP-I; BP-I plus internalizing disorders only; BP-I plus externalizing disorders only; and BP-I plus internalizing and externalizing disorders) in determining clinical BP-I subtypes. Using multiplex BP-I family data, Monahan et al. showed that each cluster had significantly distinct clinical courses and familial aggregations. In the present study, comorbid disorders incorporated into the phenotype dimension were all internalizing disorders (anxiety and obsessive–compulsive disorders and an eating disorder) that were eventually clustered as a single factor. Externalizing comorbid disorders appeared to be much less prevalent or less thoroughly evaluated in the subjects in this study; some of these conditions may need more focused evaluations with specialized questionnaires. In the current study, alcohol and substance use disorder was the only externalizing disorder that had prevalence higher than 1%. However, we removed this disorder from additional analyses because of its low factor loading (0.15). Because of the heavy alcohol consumption in the Korean general population and the high prevalence of alcohol use disorder (Hong et al., Reference Hong, Noh and Kim2017), the associations between alcohol abuse and BPs might have been diluted in the current analyses. Abuse of substances other than alcohol is much less prevalent in the Korean population compared with in Western countries (Feng et al., Reference Feng, Yu, Chang, Han, Chung and Li2016); in another comorbidity study of BPs in a Caucasian population, alcohol and other substance abuse constructed separate dimensions (Kerner et al., Reference Kerner, Lambert and Muthen2011). In that study, internalizing disorders such as anxiety and obsessive–compulsive disorder were not incorporated into any subclass.
Eveningness and seasonality are well-known characteristics associated with mood disorders; our group reported that they were associated with each other, and they presented more frequently in BP-II (Choi et al., Reference Choi, Baek, Noh, Kim, Choi, Ha, Kwon and Hong2011; Kim et al., Reference Kim, Ha, Chang, Park, Huh, Kim, Hong, Park and Ha2015; Baek et al., Reference Baek, Kim, Kim, Ryu, Lee, Ha and Hong2016). In the current study, eveningness was included in the comorbidity factor, which was associated more with BP-II than with BP-I. On the contrary, seasonality loaded on the depression factor but was excluded from the final analysis because of its low loading score.
Even though we obtained high face validity for most of the factors, there were some exceptions. Psychotic features during depression were separate from other depressive symptoms and loaded on the comorbidity factor. Additionally, early age at onset and lifetime suicide attempts were loaded on the atypical vegetative symptoms factor. Interpreting these findings, however, is beyond the scope of this study and warrants future investigations.
Relationships between phenotype dimensions
Individual psychopathologic domains are not independent from other domains, and to the best of our knowledge, this is the first study that explores the relationships among the lifetime psychopathology dimensions of BP; our results provided an integrative view of clinical characteristics that were not captured in the DSM BP criteria. We identified triangular positive associations between depression, cyclicity, and comorbidity. Unipolar mania, i.e. existence of only manic episodes, showed a strong negative loading on the depression factor rather than the elation or psychotic/irritable mania factors. In previous studies, frequent depressive episodes and comorbid conditions were associated with poor prognosis (McElroy et al., Reference McElroy, Altshuler, Suppes, Keck, Frye, Denicoff, Nolen, Kupka, Leverich, Rochussen, Rush and Post2001; Judd et al., Reference Judd, Schettler, Akiskal, Maser, Coryell, Solomon, Endicott and Keller2003b), whereas unipolar mania showed a better clinical course (Baek et al., Reference Baek, Eisner and Nierenberg2014). Among the manic symptoms, it is notable that psychotic/irritable mania including psychotic and mixed features of manic episodes showed negative associations with the abovementioned factor triangle. Regarding psychosis in BP, authors have reported mixed results for courses and outcomes (Keck et al., Reference Keck, McElroy, Havens, Altshuler, Nolen, Frye, Suppes, Denicoff, Kupka, Leverich, Rush and Post2003; Dell'Osso et al., Reference Dell'Osso, Camuri, Cremaschi, Dobrea, Buoli, Ketter and Altamura2017; Burton et al., Reference Burton, Ryan, Kamali, Marshall, Harrington, McInnis and Tso2018). In our study, psychotic symptoms during depression and mania were separately clustered in two factors that did not represent typical depressive or manic symptoms, and psychotic symptoms in manic episodes (49%) were more prevalent than those in depressive episodes (23.8%). Given that a family study (Merikangas et al., Reference Merikangas, Cui, Heaton, Nakamura, Roca, Ding, Qin, Guo, Shugart, Zarate and Angst2014) suggested separate inheritance of mania and depression, their psychotic features might have distinct biological mechanisms rather than a strong common biological basis. Additionally, given that the mixed state is considered a poorer prognostic factor in terms of high suicide risk (Persons et al., Reference Persons, Coryell, Solomon, Keller, Endicott and Fiedorowicz2018), comorbidity, and early onset (Swann et al., Reference Swann, Lafer, Perugi, Frye, Bauer, Bahk, Scott, Ha and Suppes2013), the current findings appear to contradict previous results. This discrepancy might partly originate from our adoption of rigid DSM-IV-TR criteria for mixed episodes in the current study. The overall picture drawn in this study using SEM provided a bird's-eye view of different symptom characteristics of bipolar spectrum disorders, from unipolar mania to typical BP-I to BP-II.
Comparison between BP-I and BP-II
This is also the first study to compare symptom dimensions between BP-I and BP-II; in differentiating between the two, previous study authors have mainly focused on whether they are within the same dimension or categorically distinct (Gershon et al., Reference Gershon, Hamovit, Guroff, Dibble, Leckman, Sceery, Targum, Nurnberger, Goldin and Bunney1982; Endicott et al., Reference Endicott, Nee, Andreasen, Clayton, Keller and Coryell1985; Judd et al., Reference Judd, Akiskal, Schettler, Coryell, Maser, Rice, Solomon and Keller2003a; Baek et al., Reference Baek, Park, Choi, Kim, Choi, Ha, Kwon, Lee and Hong2011). Considering the inconsistent results from these studies, an innovative approach is needed to establish a model to explain the biological or clinical relationships between BP-I and BP-II. The symptom dimension approach that assumes multiple phenotype dimensions that are differently associated with BP-I and BP-II can be a good alternative. Ostacher et al. (Reference Ostacher, Suppes, Swann, Eudicone, Landsberg, Baker and Carlson2015) reported different treatment responses across BP mood episode symptoms, suggesting the biological distinctiveness of symptom dimensions. Further study is needed with a separate sample to confirm the model we explored in our study.
Strengths and limitations
The main strength of this study is analyzing subjects’ lifetime characteristics instead of state-dependent characteristics. This would be essential to extract phenotype dimensions having distinct biological underpinnings. Comprehensive information on lifetime symptoms, courses, comorbid conditions, and other traits associated with BP were obtained from multiple information sources. In addition, this study is unique because it investigated interplays among phenotype dimensions and their differing relationships with the current BP-I and BP-II categories.
The findings of our study need to be interpreted in the context of our study design. First, we evaluated all symptoms based on the DSM-IV-TR, and as such, inter-episode, subthreshold affective symptoms or mixed-nature depressive episodes could not be included in the analyses. Second, while evaluating symptoms on a lifetime basis, recall bias and influence of subjects’ affective symptoms might have arisen. In addition, each episode may show different characteristics throughout a lifetime (Coryell et al., Reference Coryell, Winokur, Shea, Maser, Endicott and Akiskal1994; Oquendo et al., Reference Oquendo, Barrera, Ellis, Li, Burke, Grunebaum, Endicott and Mann2004; Perlis et al., Reference Perlis, Ostacher, Uher, Nierenberg, Casamassima, Kansky, Calabrese, Thase and Sachs2009), and the complex nature of symptom presentation over the illness course might not have been completely reflected here. We tried to minimize the bias by collecting additional information from available care-givers and their clinicians. Third, relationships between symptom dimensions that we observed in our study do not mean causal or temporal relationships. Fourth, we excluded a number of comorbid conditions from the analysis because there were so few positive cases, which might reflect their low prevalence in patients with BP. Our previous study with a larger clinical sample (n = 416) also showed extremely low rates (<1%) of these conditions (anorexia and somatoform disorder) in Korean patients with BPs (Bae et al., Reference Bae, Lee, Baek, Kim, Cho, Ryu, Ha and Hong2014). Lastly, sample size may not be enough to use multiple variables for generating phenotype constructs. Complementary analyses excluding the missing data to examine the robustness of our results showed consistent results. However, as both analyses have insufficient power, further study with larger sample is warranted to confirm the study findings.
Implications
In this study, we evaluated the factor structures of lifetime clinical manifestations of BP. The phenotype dimensions we observed in our study were partly in line with findings from prior studies, and we also identified some novel pictures. Our findings also reflect differences between BP-I and BP-II. In order to understand the complex symptom presentations in BPs, alternative approaches beyond the current diagnostic system are necessary. Further study is warranted to explore the biological or clinical distinctiveness of the dimensional phenotypes we drew from the current study.
Supplementary material
The supplementary material for this article can be found at https://doi.org/10.1017/S003329171800301X.
Acknowledgement
None.
Financial support
This study was supported by a National Research Foundation of Korea (NRF) grant funded by the Ministry of Science, ICT and Future Planning (MSIP; 2015R1A2A2A01002699), Republic of Korea and by a grant of the Korea Health Technology R&D Project through the Korea Health Industry Development Institute (KHIDI), funded by the Ministry of Health & Welfare, Republic of Korea (grant number: HI15C0626). The work of Yongkang Kim and Taesung Park was supported by the NRF Bio-Synergy Research Project (2013M3A9C4078158) funded by the Republic of Korea MSIP.
Conflict of interest
None.
Ethical standards
The authors assert that all procedures contributing to this work comply with the ethical standards of the relevant national and institutional committees on human experimentation and with the Helsinki Declaration of 1975, as revised in 2008.