1. INTRODUCTION
In direct-drive laser fusion, a few millimeter of a fuel capsule is irradiated by high-intensity lasers from all directions. The irradiated target surface is ablated and the ablation pressure generated by the recoil of expanding surface drives the target inward. This process is called as implosion, and it is a very important process for compressing the fuel to high density and for raising the temperature to that required for ignition and burning. Achieving a high compression ratio and high temperature requires that the target be imploded spherically. The spherical implosion is, however, quite difficult for several reasons. One of the major reasons is the non-uniformity of laser irradiation, which is caused by the overlap of individual beams, imbalance of the laser intensity between each beam, and so on. Perturbations imprinted by such non-uniform irradiation are amplified by Rayleigh–Taylor (RT) instability during the implosion (Lindl et al., Reference Lindl, Amendt, Berger, Glendinning, Glenzer, Haan, Kauffman, Landen and Suter2004; Casner et al., Reference Casner, Smalyuk, Masse, Igumenshchev, Liberatore, Jacquet, Chicanne, Loiseau, Poujade, Bradley, Park and Remington2012). In a conventional “hot spot” ignition scheme, the high-temperature region near the center of the fuel plays an important role for the ignition, but the RT instability causes the mixing of the hot region and the surrounding cold region, which disturbs the creation of the “hot spot” necessary for ignition (Regan et al., Reference Regan, Epstein, Hammel, Suter, Ralph, Scott, Barrios, Bradley, Callahan, Cerjan, Collins, Dixit, Doeppner, Edwards, Farley, Glenn, Glenzer, Golovkin, Haan, Hamza, Hicks, Izumi, Kilkenny, Kline, Kyrala, Landen, Ma, MacFarlane, Mancini, McCrory, Meezan, Meyerhofer, Nikroo, Peterson, Sangster, Springer and Town2012; Ma et al., Reference Ma, Patel, Izumi, Springer, Key, Atherton, Benedetti, Bradley, Callahan, Celliers, Cerjan, Clark, Dewald, Dixit, Doppner, Edgell, Epstein, Glenn, Grim, Haan, Hammel, Hicks, Hsing, Jones, Khan, Kilkenny, Kline, Kyrala, Landen, Pape, MacGowan, Mackinnon, MacPhee, Meezan, Moody, Pak, Parham, Park, Ralph, Regan, Remington, Robey, Ross, Spears, Smalyuk, Suter, Tommasini, Town, Weber, Lindl, Edwards, Glenzer and Moses2013).
As an alternative to the “hot spot” ignition scheme, the “fast ignition” scheme has been proposed (Tabak et al., Reference Tabak, Hammer, Glinsky, Kruer, Wilks, Woodworth, Campbell, Perry and Mason1994). In “fast ignition”, the ignition is realized by rapid heating of the compressed fuel by an external source. This scheme has the merit that does not have to form a hot spot in the implosion; thus, the mixing of the hot and cold regions is not critical problem. In the Fast Ignition Realization EXperiment (FIREX) at Osaka University (Azechi et al., Reference Azechi, Mima, Fujimoto, Fujioka, Homma, Isobe, Iwamoto, Jitsuno, Johzaki, Kodama, Koga, Kondo, Kawanaka, Mito, Miyanaga, Motojima, Murakami, Nagatomo, Nagai, Nakai, Nakamura, Nakamura, Nakazato, Nakao, Nishihara, Nishimura, Norimatsu, Ozaki, Sakagami, Sakawa, Sarukura, Shigemori, Shimizu, Shiraga, Sunahara, Taguchi, Tanaka and Tsubakimoto2009; Shiraga et al., Reference Shiraga, Fujioka, Nakai, Watari, Nakamura, Arikawa, Hosoda, Nagai, Koga, Kikuchi, Ishii, Sogo, Shigemori, Nishimura, Zhang, Tanabe, Ohira, Fujii, Namimoto, Sakawa, Maegawa, Ozaki, Tanaka, Habara, Iwawaki, Shimada, Nagatomo, Johzaki, Sunahara, Murakami, Sakagami, Taguchi, Norimatsu, Homma, Fujimoto, Iwamoto, Miyanaga, Kawanaka, Jitsuno, Nakata, Tsubakimoto, Morio, Kawasaki, Sawai, Tsuji, Murakami, Kanabe, Kondo, Sarukura, Shimizu, Mima and Azechi2011), an Au hollow cone is inserted into the fuel capsule, and the heating of the compressed fuel is achieved by the irradiation of an ultra-high-intense laser into the cone. High-energy electrons are generated at the tip of the cone by the interaction of the heating laser and the Au, and these high-energy electrons heat the compressed fuel. Experiments using cone-guided targets performed in 2002 at Osaka University showed that the neutron yield increased up to 1000 times by the injection of a heating laser (Kodama et al., Reference Kodama, Shiraga, Kodama, Shiraga, Shigemori, Toyama, Fujioka, Azechi, Fujita, Habara, Hall, Izawa, Jitsuno, Kitagawa, Krushelnick, Lancaster, Mima, Nagai, Naki, Nishimura, Norimatsu, Norreys, Sakabe, Tanaka, Youssef, Zepf and Yamanaka2002). Heating mechanism and efficiency by fast electron have been studied by many simulation analyses with PIC code for FIREX project (Johzaki et al., Reference Johzaki, Sakagami, Nagatomo and Mima2007). Especially, the generation mechanism of pre-formed plasma by pre-pulse of heating laser (Sunahara et al., Reference Sunahara, Johzaki, Nagatomo and Mima2012), the effects of pre-formed plasma on the heating efficiency (Sakagami et al., Reference Sakagami, Sunahara, Johzaki and Nagatomo2012), and the effect of laser profile on fast electron generation (Hata et al., Reference Hata, Sakagami, Johzalo and Nagatomo2013) have been actively investigated.
Fast ignition using a cone-guided target has the advantage for guiding the heating laser to the compressed fuel core not to be affected by the ablation plasma. On the other hand, the implosion process becomes increasingly complicated due to the presence of the cone. The fuel and shell interact with the cone during the implosion, which leads to the collapse of the cone and the disturbing of the formation of an optimum core shape (Stephens et al., Reference Stephens, Hatchett, Tabak, Stoeckl, Shiraga, Fujioka, Bonino, Nikroo, Petrasso, Sangster, Smith and Tanaka2005; Theobald et al., Reference Theobald, Solodov, Stoeckl, Anderson, Betti, Boehly, Craxton, Delettrez, Dorrer, Frenje, Glebov, Habara, Tanaka, Knauer, Lauck, Marshall, Marshall, Meyerhofer, Nilson, Patel, Chen, Sangster, Seka, Sinenian, Ma, Beg, Giraldez and Stephens2011). Radiation from the shell heated by the implosion lasers also interacts with the cone, which ablates the cone's surface and leads to the collapse of the cone (Nagatomo et al., Reference Nagatomo, Johzaki, Nakamura, Sakagami, Sunahara and Mima2007). To reduce such negative effects, coating the CH with the cone surface to tamp the Au vapor and the use of other materials such as diamond-like carbon for the tip have been proposed and demonstrated in many studies (Nagatomo et al., Reference Nagatomo, Johzaki, Sakagami, Sentoku, Sunahara, Taguchi, Shiraga, Azechi and Mima2009; Shay et al., Reference Shay, Amendt, Clark, Ho, Key, Koning, Marinak, Strozzi and Tabak2012). Meanwhile, the orientation of the implosion lasers is restricted not to irradiate the cone. In many cases, the implosion lasers are aligned asymmetrically. Many simulations and experimental studies of asymmetric implosions of the spherical capsule target have been performed (Li et al., Reference Li, Seguin, Frenje and Petrasso2004; Rygg et al., Reference Rygg, Frenje, Li, Seguin, Petrasso, Marshall, Delettrez, Knauer, Meyerhofer and Stoeckl2008; Hu et al., Reference Hu, Goncharov, Radha, Marozas, Skupsky, Boehly, Sangster, Meyerhofer and McCrory2010; Temporal et al., Reference Temporal, Ramis, Canaud, Brandon, Laffite and Garrec2011; Thomas and Kares, Reference Thomas and Kares2012). It is reported that the degree of illumination asymmetry is correlated directly with the ρR asymmetries (Li et al., Reference Li, Seguin, Frenje and Petrasso2004). Experimental results by the OMEGA Laser facility have shown that the fusion reaction rate is reduced significantly in the case of the asymmetric implosion, compared with the spherical one, where the asymmetric implosion was conducted by the target to be offset from the laser beam pointing center (Rygg et al., Reference Rygg, Frenje, Li, Seguin, Petrasso, Marshall, Delettrez, Knauer, Meyerhofer and Stoeckl2008).
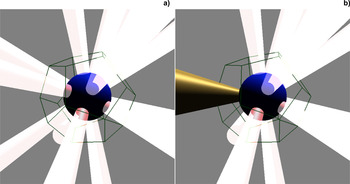
In FIREX, the Gekko XII laser system is used for the implosion, which has 12 lasers and is aligned with a dodecahedron orientation, as shown in Figure 1a (12-beam irradiation) (Heya et al., Reference Heya, Shiraga, Sunahara, Nakasuji, Nishikino, Honda, Fujita, Izumi, Miyanaga, Nishimura, Azechi, Naruo, Takabe, Yamanaka and Mima2001). However, in current experiments using the cone-guided target, the three beams on the cone side are not used, as illustrated in Figure 1b (nine-beam irradiation) for avoiding the irradiation to the cone (Shiraga et al., Reference Shiraga, Fujioka, Nakai, Watari, Nakamura, Arikawa, Hosoda, Nagai, Koga, Kikuchi, Ishii, Sogo, Shigemori, Nishimura, Zhang, Tanabe, Ohira, Fujii, Namimoto, Sakawa, Maegawa, Ozaki, Tanaka, Habara, Iwawaki, Shimada, Nagatomo, Johzaki, Sunahara, Murakami, Sakagami, Taguchi, Norimatsu, Homma, Fujimoto, Iwamoto, Miyanaga, Kawanaka, Jitsuno, Nakata, Tsubakimoto, Morio, Kawasaki, Sawai, Tsuji, Murakami, Kanabe, Kondo, Sarukura, Shimizu, Mima and Azechi2011). In the nine-beam case, the implosion process is strongly asymmetric and the momentum of the target is not balanced at the center. Therefore, the kinetic energy of the target is not efficiently converted into the internal energy and the compression ratio is degraded. In this paper, we estimate the nine-beam implosion of the cone-guided target compared with the 12-beam implosion by three-dimensional (3D) hydro simulation. Furthermore, it will be discussed that the compression ratio is enhanced by adjusting the laser intensity between each beams under the restriction of the nine-beam geometry.
Schematic diagram of Gekko XII laser irradiation orientation. (a) Twelve-beam irradiation. (b) Nine-beam irradiation.

The outline of the paper is as follows: Section 2 describes the numerical method and simulation conditions. Section 3 presents and discusses the simulation results of the 12-beam and the nine-beam implosions. Furthermore, we will show that the fuel compression ratio in the nine-beam implosion is enhanced by reducing the laser intensity of three beams on the opposite side of the cone side. Finally, Section 4 summarizes the conclusions.
2. SIMULATION CONDITIONS
To simulate the implosion of the cone-guided target, we used the pure hydrodynamic code IMPACT-3D (Sakagami & Nishihara, Reference Sakagami and Nishihara1990). IMPACT-3D solves the Euler equations in 3D Cartesian coordinates. Cartesian coordinates have no singular point at the origin and is appropriate for simulating asymmetric flow passing through the origin. In IMPACT-3D, an ideal gas law is used for the equation of state.
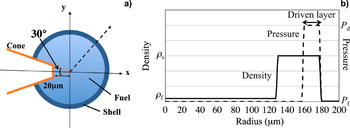
As for the target geometry, a simple shell capsule including fuel is assumed and the cone is inserted into the target as shown in Figure 2a. The cone is treated as a rigid body embedded in fluid in the simulation; namely, the cone is represented as a solid boundary, and therefore the cone is not moved and deformed. The apex of the cone is located at the target center, and the full opening angle and the distance between the tip and the target center are 30° and 20 μm, respectively. To treat the cone as a solid boundary, we have used Immersed Boundary (IB) method (Peskin, Reference Peskin1972). The IB method was developed and has been often used for simulating flow around the solid boundary in the Cartesian coordinates, in which any shape can be treated (Mittal & Iaccarino, Reference Mittal and Iaccarino2005; Chaudhuri et al., Reference Chaudhuri, Hadjadj and Chinnayya2011). This method has been applied to the implosion simulation of a cone-guided target in Cartesian coordinates and used to investigate the effects of the cone position and the opening angle on the compression efficiency (Yanagawa et al., Reference Yanagawa, Sakagami and Nagatomo2013).
(a) Target structure in the x–y plane. (b) Initial density and pressure distribution in the radial direction along the dashed arrow in (a). The solid and dashed lines are density and pressure, respectively. Fluid velocity is zero.

Figure 2b shows the initial radial profiles of the density and pressure along the dashed line in Figure 2a. IMPACT-3D is pure hydrodynamic code and does not treat the laser ablation. The implosion is driven by pressure gradient. A high-pressure region is introduced in a part of the shell (“driven layer” in Fig. 2b). ρ f, ρ s, P f, and P d are the density of the fuel, shell region, and the pressure of the fuel and the driven layer, respectively. ρ s/ρ f and P d/P f are the parameters to determine the compression ratio, and for simplicity, ρ f and P f are set to 1 g/cc and 1 Mbar, respectively. ρ s and P d are evaluated by one-dimensional simulation such that the radial convergence ratio is approximately 3.5, which correspond 45 g/cc and 3000 Mbar, respectively. The mesh size is equal to 1 μm and 4003 meshes are used for simulations. At the initial state, the fluid is at rest.
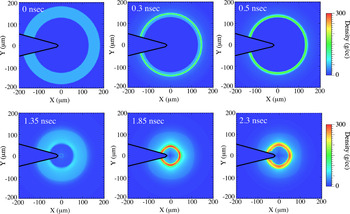
Figure 3 shows the time evolution of density profile in the x–y plane started with this initial condition. The shell is accelerated inward by the strong expansion of the driven layer (0.3 ns). At 0.5 ns when the first shock wave reaches the fuel–shell interface, the fuel is driven inward and initiates compression. At 1.35 ns, the first shock wave collides at the center of the target and is reflected outward. The shock wave reflection occurs several times and the inner pressure grows high. When the inner pressure exceeds the outer one, this time is the maximum compression time (1.85 ns). After the maximum compression time, the target turns expansion (2.3 ns).
Time evolution of the density profile in the x–y plane.

To distinguish the fuel and the shell, the material interface is tracked by solving the following equation in concurrence with fluid equations:
 $$\displaystyle{{\partial f\,({\bf r},t)} \over {\partial t}} + {\bf V}({\bf r},t) \cdot \nabla f\,({\bf r},t) = 0,$$
under the initial condition,
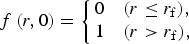 $$f\,(r,0) = \left\{ \matrix{ 0 & (r \le r_{\rm f} ), \hfill \cr 1 & (r \gt r_{\rm f} ),} \right.$$
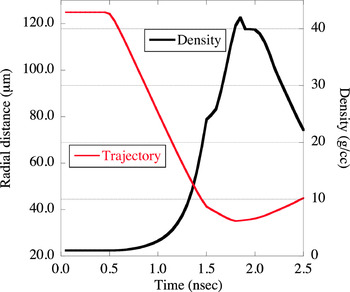
where V is the fluid velocity at each time and r f is the radius of the fuel–shell interface at the initial time; r f = 130 μm. Equation (1) with the initial condition of Eq. (2) means that the interface of the two values moves with fluid velocity. We have defined the fuel region where |f(r, t)| < 0.1. When the external shell interface is tracked, the same method has been used. In that case, r f is replaced to r s that equals 160 μm, where the driven layer is not included. Figure 4 shows the average density in the fuel region at each time step and the trajectory of the fuel–shell interface. The radial convergence ratio of 3.47 is achieved.
Trajectory of the fuel–shell interface and the time evolution of the average density in the fuel region.

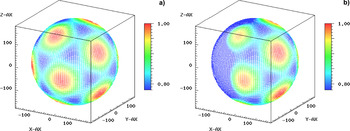
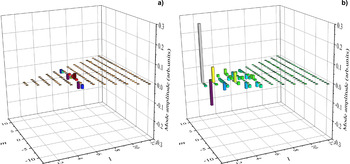
Adding perturbations on the pressure of the driven layer, we simulate the Gekko XII 12- and nine-beam implosions. Figure 5 shows the perturbation profile of one beam, which is estimated by laser absorption distribution on the target surface. The detail of the calculation and the incident condition is described in the Appendix. This perturbation profile is overlapped with each irradiation directions. Figure 6a and 6b show the perturbation profile in the case of the 12-beam and the nine-beam, respectively. These perturbation profiles are imprinted on the pressure profile of the driven layer. Figure 7a and 7b show the mode amplitude of spherical harmonics expansion of the pressure profile in the case of the 12-beam and the nine-beam, respectively. The amplitude is normalized by (0, 0) mode one that is corresponding to the average pressure. The (0, 0) mode is not put on these figures but the amplitude is unit. In the case of the nine-beam, the low mode less than 6 exists due to the asymmetry of the nine-beam irradiation.
Perturbation profile of one beam.

Perturbation profile on the driven layer. For contrast, the minimum level of color bar is set as 0.78. (a) Twelve-beam case. (b) Nine-beam case.

Mode amplitude of spherical harmonics expansion of pressure profile on the driven layer. (a) Twelve-beam case. (b) Nine-beam case. The amplitude is normalized by that of the (0, 0) mode; namely, average pressure. The (0, 0) mode is not drawn in these figures.

The average pressure value is adjusted to 3000 Mbar in both the 12-beam case and the nine-beam case. In an ideal gas, the internal energy is represented as P/(γ − 1), and therefore, the driving energy for implosion is identical in both the cases. Having done this, the difference between the 12-beam case and the nine-beam case is only the asymmetry of implosion. Simulations are conducted by inserting the cone with these profiles.
3. RESULTS AND DISCUSSION
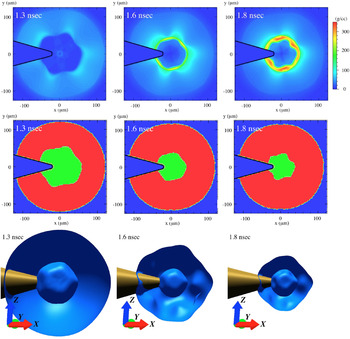
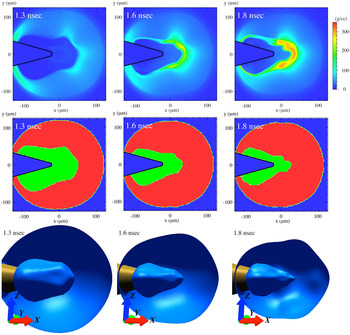
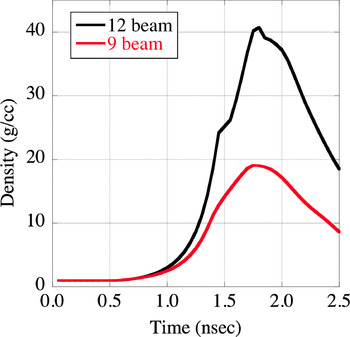
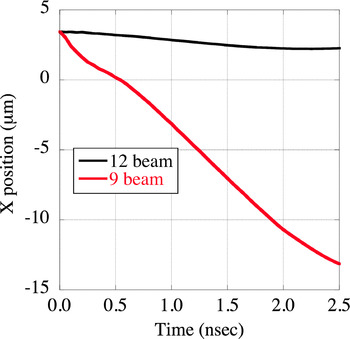
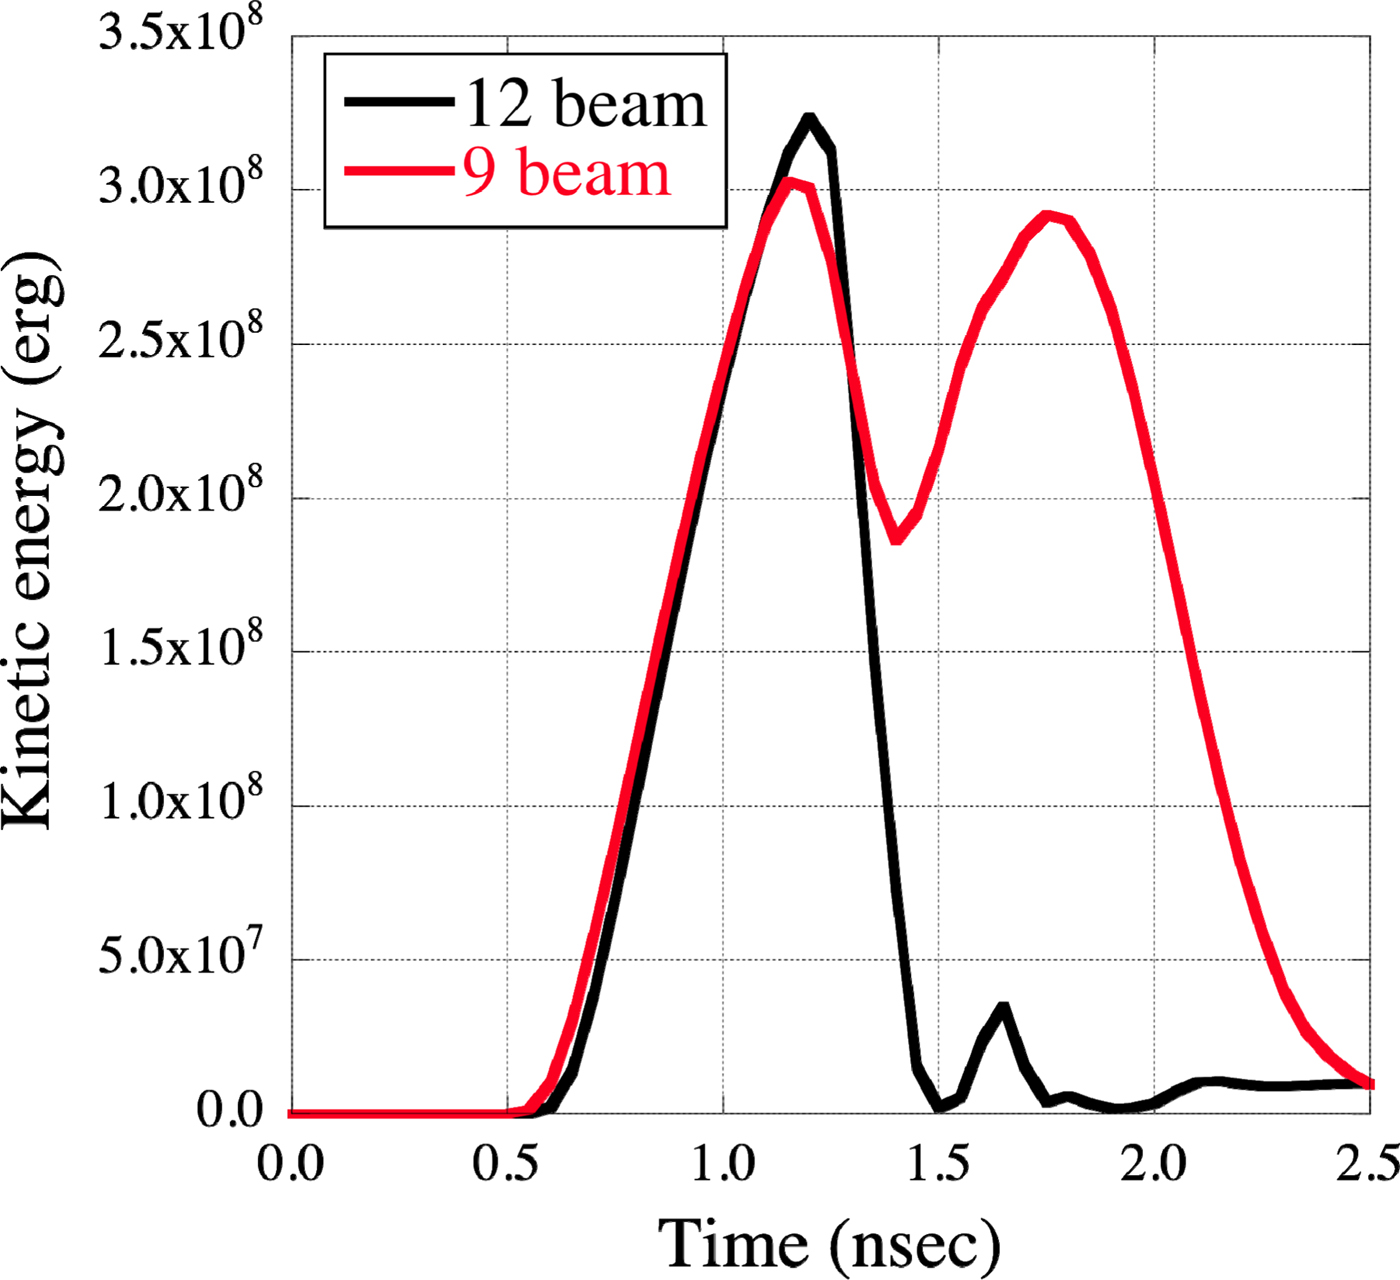
Figures 8 and 9 show the time evolution of the density profile near the maximum compression time in the case of 12- and nine-beam implosions, respectively. The upper figures are the density profile in the x–y plane. The middle figures show the results of material tracking where the red and the green areas correspond to the shell and the fuel regions, respectively. The lower figures are the isosurface corresponding to the fuel–shell interface. In the case of the 12-beam implosion, it is found that dodecahedral geometry originated from the irradiation pattern appears on the fuel–shell interface. On the other hand, in the case of the nine-beam implosion, frustum pyramid-like geometry appears, and furthermore, the shell largely expands in the negative x-direction. This expansion leads the increase of the volume in the fuel region. Thus the compression ratio is degraded. Figure 10 shows the time evolution of the average density in the fuel region. The black and the red lines indicate the 12-beam and the nine-beam cases. From these graphs, the maximum density decreases by approximately 50% in the case of the nine-beam implosion. In both cases, the driving energy for implosion is the same value since they have identical average pressure on the driven layer. The difference of the compression ratio is therefore due to the asymmetry of implosion. For the evaluation of the asymmetry of implosion, we computed the time evolution of the gravity center of the target. The computation area is in the region of the shell and the fuel; the red and the green areas of the middle figures of Figures 8 and 9. Figure 11 shows the gravity center of the target at each time step of the 12-beam case and the nine-beam case. The gravity center of the 12-beam case maintains the same point; on the other hand, the gravity center of the nine-beam case moves to the cone side at approximately 6.7 × 105 cm/s. The reason why the gravity center is at approximately 3 μm at the initial time is that the gravity center is shifted from the target center due to the presence of the cone.
Time evolution of density in the case of 12-beam implosion. Upper figures: The x–y plane. Middle figures: Results of material tracking. The red area and the green area correspond to the shell and the fuel, respectively. Lower figures: Isosurface corresponding to the fuel–shell interface. From the left side, 1.3, 1.6, and 1.8 ns.

Time evolution of density in the case of nine-beam implosion. Upper figures: The x–y plane. Middle figures: Results of material tracking. The red area and the green area correspond to the shell and the fuel, respectively. Lower figures: Isosurface corresponding to the fuel–shell interface. From the left side, 1.3, 1.6, and 1.8 ns.

Time evolution of the average density in the fuel region.

X-position of the gravity centers at each time.

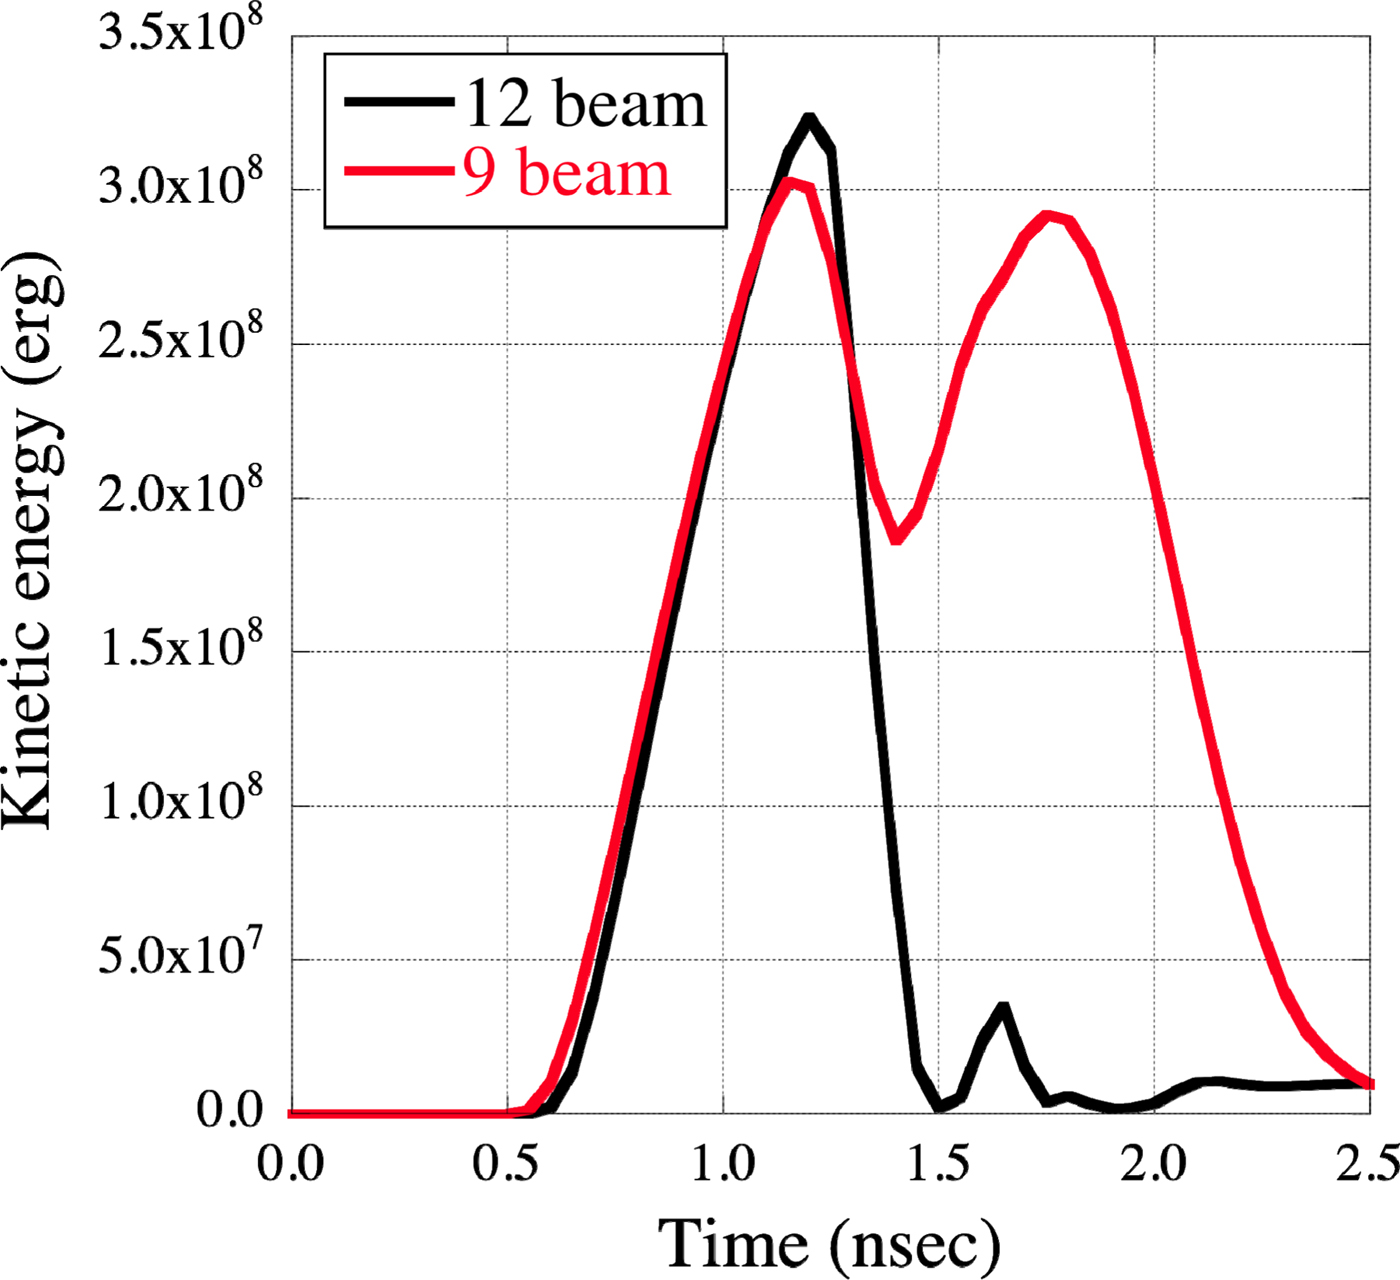
From the time evolution of the gravity center, it is found that strong asymmetric flow occurs in the case of the nine-beam implosion. This means that the kinetic energy remains even at the maximum compression time. In the case of spherical implosion, the kinetic energy is converted into the internal energy of the fuel region at the maximum compression time because the momentum of inward direction is balanced at the center. However, in the case of the asymmetric implosion, the momentum is not balanced at the center. As a result, the kinetic energy is not efficiently converted into the internal energy. This fact is found out in comparing the kinetic energy of the fuel region in the 12-beam case and the nine-beam case. Figure 12 shows the time evolution of the kinetic energy of the fuel region. In the case of the nine-beam implosion, the kinetic energy is remained and little converted to the internal energy even at the maximum compression time (t = 1.75 nsec). On the other hand, the kinetic energy of the 12-beam case is converted to the internal energy since the 12-beam implosion is done by approximately spherical symmetric process.
Time evolution of the kinetic energy of the fuel region.
Focusing on the energy conversion, to reduce the implosion asymmetry leads to efficiently convert the kinetic energy to the internal energy. The implosion asymmetry is expected to be improved by reducing the intensity of the three beams on the opposite side of the cone side. However, too reducing the intensity, for example zero intensity, the implosion process becomes cylindrical one, in which the volume compression is proportional not to the cube but the square of the radial convergence. Therefore the compression ratio is degraded. The trade-off of such geometrical effect and the reduction of the asymmetry of implosion are important.
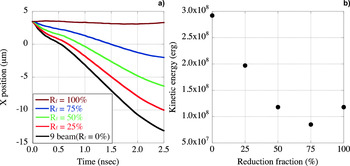
As for the simulation condition, the amplitude of perturbation on the opposite side of the cone side is reduced. We introduce a parameter R f (%) that is defined as the reduction fraction of the amplitude of pressure perturbation on the opposite side of the cone side. As R f increases, the average pressure on the driven layer decreases; namely, the input energy decreases.
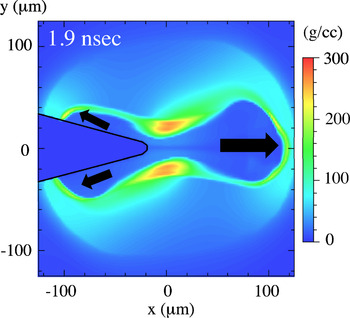
Figure 13a and 13b show the time evolution of the gravity center of the target and the kinetic energy of the fuel region versus R f. The R f of 100% means the six-beam implosion where the three beams on the opposite side of the cone side are not irradiated. From Figure 13a, the translational motion becomes smaller as the R f becomes larger. At R f = 100%, the velocity of the translational motion is almost zero, which means the global asymmetry is vanished. However, the kinetic energy of the fuel region is higher than the case of R f = 75%. This fact is explained as follows: When R f = 100%, the fuel is crushed in from the perpendicular side to the x-axis and is pushed to both positive and negative x-directions. Figure 14 shows the density profile in the x–y plane at the maximum compression time when R f = 100%. It is found that the top and bottom shells push out the fuel in the x-direction. The fuel region has the kinetic energy due to such fuel blow-off. Therefore, the kinetic energy increase when R f = 100%.
Results of the reduction of the pressure perturbation on the opposite side of the cone side. (a) Time evolution of the gravity center of the target. (b) Kinetic energy of the fuel region at the maximum compression time at each reduction fraction.

Density profile in the x–y plane at the maximum compression when R f = 100%.

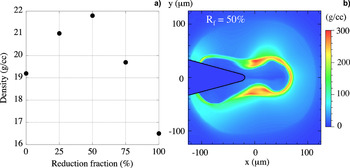
Figure 15a shows the average density of the fuel region at the maximum compression in each R f. Although the remaining kinetic energy was minimum around R f = 75%, the maximum compression density is most improved at R f = 50%. The conversion of the kinetic energy to the internal energy is highest at R f = 75%, but the geometrical effect as becoming cylindrical implosion cannot be neglected. Due to the balance between the increase of the geometrical effect and the reduction of the implosion asymmetry, the optimal R f is obtained as 50%. Figure 15b shows the density profile in the x–y plane at the maximum compression time in the case of R f = 50%. Comparing with Figure 14, the fuel blow-off on the opposite side of the cone is suppressed. From these results, in the restriction of the nine-beam geometry, the compression ratio can be enhanced by reducing the asymmetry of the implosion even if the total driving energy decreases.
(a) The maximum compression density of the fuel region versus the reduction fraction (= R f). The case of 0 and 100% in R f mean the pure nine-beam implosion and the six-beam implosion, respectively. (b) The density profile in the x–y plane at the maximum compression time in the case of R f = 50%.

4. CONCLUSION
We conducted implosion simulations of a cone-guided target with the 12-beam and the nine-beam irradiation orientation of the Gekko XII laser system. Compared with the 12-beam case, the compression efficiency decreases by approximately 50% for the nine-beam case. Furthermore, it was found that the strong asymmetric flow toward the cone side in the nine-beam case occurs and the kinetic energy of the fuel region mostly remains even at the maximum compression time, which means that the kinetic energy is scarcely converted into the internal energy. This is due to the asymmetric implosion. Thus, to reduce the asymmetry of implosion, implosion simulations where the laser intensity on the opposite side of the cone side is reduced were conducted. The simulation results showed that the compression ratio becomes improved until the reduction fraction of the laser intensity on the opposite side of the cone side is 50% and turns decreases in the case of greater than 50%. This result shows that there exists an optimal condition for the improvement of the compression ratio and the compression ratio can be enhanced by reducing the asymmetry of implosion even if the driving energy decreases.
ACKNOWLEDGMENT
This work was partially performed under the joint research project of the Institute of Laser Engineering, Osaka University.
APPENDIX
PERTURBATION PROFILE ON THE DRIVEN LAYER
In implosion, the target surface is filled with ablation plasma and the incident laser is absorbed in front of the critical density. Assuming the ablation process as iso-thermal expansion supported by the incident laser, the following scaling relations are obtained as for temperature and sound velocity (Atzeni and Meyer-ter-Vehn, Reference Atzeni and Meyer-ter-Vehn2004).
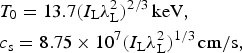 $$\eqalign{& T_0 = 13.7(I_{\rm L} \lambda _{\rm L}^2 )^{{2 / 3}} \,{\rm keV,} \cr & c_{\rm s} = 8.75 \times 10^7 (I_{\rm L} \lambda _{\rm L}^2 )^{{1 / 3}} \,{\rm cm/s,}}$$
where I L and λ L are the laser intensity and wavelength, which are taken in units of 1015 W/cm2 and in μm, respectively. The ablation plasma is assumed as fully ionized carbon plasma. T 0 and c s are approximately 1.17 keV and 2.56 × 107 cm/s on condition that I L and λ L are 1014 W/cm2 and 0.53 μm. The scale length of the plasma is estimated as 128 μm after 0.5 ns of the laser irradiation since c s × 0.5 nsec = 128 μm. Under this assumption, the following plasma profile is used for the estimation of laser absorption distribution on the target surface.
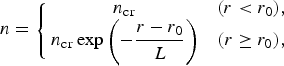 $$n = \left\{ \matrix{n_{{\rm cr}} & (r \lt r_0 ), \hfill \cr n_{{\rm cr}} \exp \left( { - \displaystyle{{r - r_0} \over L}} \right) & (r \ge r_0 ),} \right.$$
where n cr, r 0, and L are the critical density, target radius, and scale length, respectively. r 0 and L are set as 200 and 128 μm, respectively.
The laser absorption distribution on this profile is calculated by the ray trace method. The absorption process is assumed as collisional absorption process whose absorption coefficient is defined as the following equation:
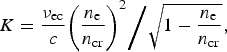 $$K = \displaystyle{{\nu _{{\rm ec}}} \over c}{{\left( {\displaystyle{{n_{\rm e}} \over {n_{{\rm cr}}}}} \right)^2} \bigg/ {\sqrt {1 - \displaystyle{{n_{\rm e}} \over {n_{{\rm cr}}}}}}},$$
where ν ec, c, and n e are the electron–ion collision frequency at the critical density, light speed, and electron density, respectively.
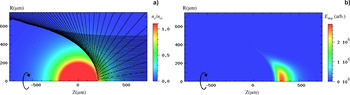
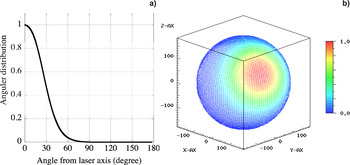
Figure A1(a) and A1(b) show the trajectory of ray and the deposited energy on the plasma, respectively. The laser is incident from right side with parallel. The laser profile is set so that the beam cover the target. The spatial profile is super Gaussian with α equals 3 and the half width at half maximum is 180 μm. Figure A2(a) shows the angular distribution of the deposit energy that is obtained by integrating and normalizing the energy distribution of Figure A1(b) in the radial direction of the target. The horizontal axis is the angle from the laser axis. Figure A2(b) is the perturbation profile using this angular distribution. In the 12- and nine-beam cases, this perturbation profile is overlapped with each irradiation directions.
The result of ray trace on the profile defined by Eq. (A2). The laser is incident from the left side with parallel. (a) The trajectory of ray. (b) Deposited energy.

(a) Angular distribution of the deposit energy from the laser axis obtained by integrating and normalizing the energy distribution of Figure A1(b) in the radial direction of the target. (b) The perturbation profile using this angular distribution.