Introduction
Organic farming and reduced tillage
Organic vegetable growers rely on tillage and cultivation as weed management tools, but reducing tillage can also improve soil qualityReference Fabrizzi, Rice, Amado, Fiorin, Barbagelata and Melchiori 1 , Reference Mazzoncini, Sapkota, Barberi, Antichi and Risaliti 2 , save fuelReference West and Marland 3 and reduce laborReference Weersink, Walker, Swanton and Shaw 4 . Organic growers may avoid adopting tillage reduction because of their concern over potential weed problems and lack of management optionsReference Bastiaans, Paolini and Baumann 5 , Reference Mulvaney, Price and Wood 6 ; thus research into these issues is necessary to increase adoption.
Cover crops and weeds
A weed management tool for organic reduced-tillage systems could be the conversion of cover crops grown over winter into mulchReference Creamer, Bennett, Stinner, Cardina and Regnier 7 , Reference Bilalis, Sidiras, Economou and Vakali 8 . Cover crops can help outcompete and manage weedsReference Mulvaney, Price and Wood 6 , Reference Bilalis, Sidiras, Economou and Vakali 8 – Reference Leavitt, Sheaffer, Wyse and Allan 11 through both physical and chemical mechanismsReference Moonen and Barberi 12 , in some cases providing weed suppression comparable to that of herbicidesReference Mischler, Duiker, Curran and Wilson 10 , Reference O'Reilly, Robinson, Vyn and Van Eerd 13 . Choosing appropriate cover crop varieties, termination times and termination methods may influence the success of cover crop mulch and the subsequent weed suppressive capacityReference Morse 14 – Reference Wortman, Francis, Bernards, Blankenship and Lindquist 16 . Cover crops that produce greater biomass result in mulch that better suppresses weed emergenceReference Teasdale, Beste and Potts 17 . Teasdale and MohlerReference Teasdale and Mohler 18 found that the amount of mulch necessary to control summer annual weeds varied significantly by weed species and mulch variety, and Ryan et al.Reference Ryan, Mirsky, Mortensen, Teasdale and Curran 19 found that to completely suppress weeds in rye (Secale cereale L.) mulch, more than 15 Mg ha−1 biomass is needed. In a recent study, Carr et al.Reference Carr, Horsley, Gunderson, Winch and Martin 20 concluded that weed management is one of the biggest obstacles for managing roller-crimped cover crops as mulch for growing cash crops.
Termination method
Rolling with a roller–crimper and mowing with a flail-mower are two mechanical methods to terminate cover crops; both can be as effective as termination with herbicidesReference Carrera, Abdul-Baki and Teasdale 21 . Flail-mowing ensures effective kill, provided that mowing does not happen so early that cover crops continue to growReference Creamer and Dabney 22 . However, with flail-mowing, achieving mulch uniformity can be difficult, resulting in weed emergence through thinly covered gaps in the mulch layerReference Teasdale, Coffman and Mangum 23 . Flail-mowing also results in small pieces of material that decompose faster and are less persistent as mulchReference Morse 14 , Reference Mohler and Teasdale 24 . MorseReference Morse 14 found a reduction in cash crop yield in flailed cover crop mulch compared with that in rolled mulch. Compared with flailing, rolled cover crops decompose less quickly and may provide more thorough ground coverReference Creamer and Dabney 22 , but fully killing cover crops with a roller–crimper can be challengingReference Mulvaney, Price and Wood 6 , Reference Mischler, Duiker, Curran and Wilson 10 .
Termination timing
Killing a cover crop for a mulch is important because ineffectively terminated cover crops regrow and act as weeds themselvesReference Morse 14 , Reference Teasdale, Coffman and Mangum 23 , Reference Luna, Mitchell and Shrestha 25 . Phenological stage determines the best time to terminate cover crops when roller-crimpingReference Kornecki, Arriaga and Price 15 , Reference Ashford and Reeves 26 – Reference Carr, Mäder, Creamer and Beeby 28 . Terminating after the early milk stage is effective for killing ryeReference Ashford and Reeves 26 , Reference Carr, Anderson, Lawley, Miller and Zwinger 29 and the mid-to-late bloom stage is effective for vetches when terminated with an undercutterReference Creamer, Bennett and Stinner 30 . In a study relating rye phenological growth stage with growing degree days (GDD), Mirsky et al.Reference Mirsky, Curran, Mortensen, Ryan and Shumway 27 concluded that GDD could be used to predict when cover crops would approach appropriate termination stages.
Cover crops need to produce adequate biomass before termination because more biomass means thicker mulch, which hinders emergence of weedsReference Bilalis, Sidiras, Economou and Vakali 8 , Reference Luna, Mitchell and Shrestha 25 , Reference Carr, Anderson, Lawley, Miller and Zwinger 29 , Reference Wagger 31 . Cover crops also need to achieve sufficient maturity to be roller-crimped effectively, without growing so much as to produce viable seedReference Kornecki, Arriaga and Price 15 . However, cover crop termination should not be delayed so much that cash crop planting is delayedReference Mischler, Duiker, Curran and Wilson 10 , Reference Luna, Mitchell and Shrestha 25 , Reference Teasdale, Mirsky, Spargo, Cavigelli and Maul 32 . Delaying termination beyond early or mid-flowering in hairy vetch (Vicia villosa R.) will not increase the amount of N input from N fixation, but will increase vetch biomassReference Wagger 31 , Reference Decker, Meisinger and Clark 33 , Reference Drinkwater, Janke and Rossoni-Longnecker 34 .
Cover crop variety
Competitive cover crops that produce plentiful biomass help combat weedsReference Bilalis, Sidiras, Economou and Vakali 8 , Reference Luna, Mitchell and Shrestha 25 , Reference Gruber and Claupein 35 , thus it is important to determine successful varieties for a region. This study focuses on varieties of grains and vetches and a grain–vetch mix. Mulched rye lasts longer over the season than does mulched vetchReference Mohler and Teasdale 24 . With a higher cellulose concentration than vetch, mulched rye is more resistant to decompositionReference Wagger 31 . Compared with rye, higher weed populations have been observed in hairy vetch cover cropsReference Carr, Horsley, Gunderson, Winch and Martin 20 , Reference Davis 36 , especially when flail-mowedReference Morse 14 . Mixes of grains and legumes often can produce more biomass than either aloneReference Cline and Silvernail 37 – Reference Campiglia, Radicetti and Mancinelli 39 , with plant tissue N concentrations between that of both constituentsReference Cline and Silvernail 37 , and can effectively reduce weedsReference Leavitt, Sheaffer, Wyse and Allan 11 , Reference Teasdale, Mirsky, Spargo, Cavigelli and Maul 32 , Reference Parr, Grossman, Reberg-Horton, Brinton and Crozier 40 .
Soil nitrate–N
The majority of plant-available N released by mulched vetch is released within 4–6 weeks after cover crop terminationReference Sullivan and Andrews 41 (WAT), which may increase density and biomass of weedsReference Teasdale and Daughtry 42 – Reference Kumar, Bellinder and Brainard 44 . MorseReference Morse 14 attributes higher weed biomass in hairy vetch mulch, compared with rye mulch, to the N-input from the vetch. Although some studies have explored the connection between soil N and weed dynamics using controlled levels of NReference Wortman, Davis, Schutte and Lindquist 45 , more work is needed to understand the relationship between weeds and soil nitrate–N derived from legume cover crops.
Objectives
The objectives of this study were to: (1) compare cover crop biomass production and plant N, termination effectiveness, soil nitrate–N and weed dynamics among cover crop varieties and a variety-blend (50:50 by seed weight); (2) determine if termination time (Early versus Late) and termination method (roller–crimp versus flail) influence post-termination weed percent cover; and (3) determine if a correlation exists between weed emergence and cover crop N or soil nitrate–N. The goal is to identify specific cover crop varieties and management strategies that suppress weeds and are suitable for use in Western Washington.
Materials and Methods
The study design was a split-plot randomized complete block repeated over 2 years, with plot locations re-randomized each year. The main plot factor was cover crop variety and the split-plot factor was termination timing. A split–split-plot factor of the termination method was applied only to the three grain cover crops. Main plots were 12 × 9 m, split-plots were 6 × 9 m and split–split-plots 3 × 9 m.
Site description
The Washington State University Puyallup Research and Extension Center (47°19′28′N 122°33′31′W) is on alluvial soils used for high-value crop production. Mean annual temperature is 11 °C, with a January mean of 4 °C and a July mean of 18 °C. Mean annual precipitation is 1020 mm, with wet winters and dry summers. The soil is mapped as a Briscot loam (coarse-loamy, mixed, superactive, non-acid, mesic Fluvaquentic Endoaquepts). The site was in organic transition for 3 years before the study began, with winter and/or summer cover crops grown during the transition period, but no other soil amendments or cash crops.
Cover crops
Cover crop varieties were chosen to represent previously successful varieties in the region and from our preliminary trials. Rye is adapted to cool climatesReference Dabney, Delgado and Reeves 9 , Reference Odhiambo and Bomke 46 and suppresses weedsReference Moonen and Barberi 12 . We included ‘Aroostook’ rye, a variety used frequently in the Eastern USAReference Ryan, Mirsky, Mortensen, Teasdale and Curran 19 , Reference Mirsky, Curran, Mortenseny, Ryany and Shumway 47 , Reference Nord, Ryan, Curran, Mortensen and Mirsky 48 , and common rye (variety not stated), typically used by Northwest growers, as a comparison. Barley (Hordeum vulgare L.) is adapted to cool humid climates and no-tillage systemsReference Legere and Bai 49 and the variety ‘Strider’ (certified organic seed from Washington Crop Improvement Association) performed well in preliminary trials in Western Washington. Hairy vetch fixes nitrogen (N), has a resulting low carbon (C) to N ratio (C:N)Reference Parr, Grossman, Reberg-Horton, Brinton and Crozier 40 , Reference Odhiambo and Bomke 46 and tolerates cold temperaturesReference Dabney, Delgado and Reeves 9 . We included three other vetches adapted to Western Washington: ‘Purple Bounty’, an early-maturing variety of hairy vetch, ‘Lana’ vetch (V. villosa spp. Dasycarpa) and common vetch (V. sativa L. ssp. nigra L.).
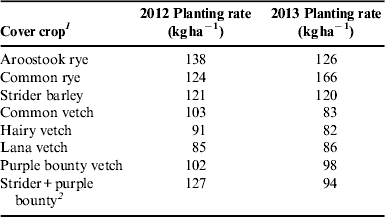
Cover crops were planted Sep. 21, 2011 and Sep. 20, 2012 using a John Deere grain drill (model FB-B, setting 14) with 15 cm row spacing (Table 1). Target planting rates for each cover crop were the same both years, but actual rates varied from year to year. Cover crops were terminated using a roller–crimper (I & J Roller Crimper, Gap PA) or flail-mower (IH-9049 in 2012 and John Deere 370 in 2013). The roller–crimper mounted on the front of a John Deere 4700 tractor made two passes in each split–split-plot, with an approximate 60 cm swath of overlap. The flail-mower cut the cover crop to leave stubble no higher than 20 cm, at estimated 2.4 km h−1 ground speed. Previous observations at this site (unpublished data) indicated that roller–crimping vetch was not effective, so only grains were roller–crimped. Hairy vetch was not included in any analyzes following termination because it could not be effectively mowed in 2013; its stems were so long that they clogged the flail-mower. We did not plant a cash crop into the cover crop mulch and weeds grew without management.
Cover crop planting rates in 2012 and 2013 for cover crop varieties.

1 Cover crops were planted Sep. 21, 2011 and Sep. 20, 2012.
2 The Strider+purple bounty mix was a 50:50 blend by seed weight.
Cover crop biomass and C:N ratios of the cover crops were determined from samples collected at the time of termination. Biomass was clipped into two half m2 quadrats per split-plot at ground level just before termination. Vetches, grains and weeds were separated, dried at 56 °C until reaching a constant weight, and weighed to determine dry matter. Subsamples of cover crop biomass were ground and C and N were determined by the combustion analysisReference Nelson and Sommers 50 .
Termination timing
Cover crop termination time was determined using the Zadoks and Mischler scalesReference Mischler, Duiker, Curran and Wilson 10 , Reference Zadoks, Chang and Konzak 51 for grains and vetches, respectively (Table 2). The Early target stage was Zadoks 67 (late anthesis) for grains and 60% flowering (Mischler stage 4) for vetch, and the Late target date was Zadoks 70 (early milk) and 100% flowering (Mischler stage 6). Termination time for the barley–vetch mix was determined based on the stage of the barley, which reached the target termination stage first. Termination effectiveness was assessed at 4 WAT by visually estimating percent cover crop upright after termination. We also calculated GDD from planting to the Early and Late termination dates for each cover crop, using 2.6 °C as the base temperature for the grains and 1.4 °C as the base temperature for the vetches (Table 2)Reference Angus, Cunningham, Moncur and Mackenzie 52 .
Cover crop termination date, cover crop growth stage and growing degree days at two termination times for eight cover crops in 2012 and 2013.

1 Growth stage is Zadoks grain maturity scale and/or Mischler vetch maturity ratingReference Mischler, Duiker, Curran and Wilson 10 , Reference Zadoks, Chang and Konzak 51 .
2 GDD is growing degree days. Base temperature for grains=2.6 °C and for vetches=1.4 °C.
3 Mix GDD is reported for the grain component.
We chose Early timing as ZadoksReference Zadoks, Chang and Konzak 51 stage 67 based on what others have found to achieve sufficient cover crop kill with a roller–crimperReference Ashford and Reeves 26 , Reference Carr, Anderson, Lawley, Miller and Zwinger 29 . In preliminary experiments, we observed that rolling common rye at Zadoks 67 was ineffective, so we chose Zadoks stage 70 for Late to determine how much flexibility farmers might have in choosing termination times. Waiting past Zadoks stage 70 increases the likelihood of viable seed production and volunteer cover crop establishment and pushes back cash crop planting. The difference between Early and Late termination ranged from 3 to 27 days (33 to 345 GDD) across years, depending on the cover crop variety and maturation rate.
Soil nitrate–N
Soil samples for nitrate–N were taken 2, 4 and 6 WAT from flailed Late treatments in all cover crop varieties. Soil was cored to a 30 cm depth using a 2.5 cm diameter hand probe; six subsamples were combined from each split-plot and air-dried at 30 °C. Soil nitrate–N was extracted with 1 M KCl, and determined by an automated cadmium reduction methodReference Gavlak, Horneck and Miller 53 .
Weed assessment
Cover crop mulches were visually assessed for percent weed cover in flailed plots at 4 WAT and weeds were considered to be ‘weed cover’ if they were visible above the surface of mulch. At 6 WAT the three most abundant weed species in each split–split-plot were recorded to examine weed demography.
Data analysis
All analyses were performed in R 54 using packages nlmeReference Pinheiro, Bates, DebRoy and Sarkar 55 and agricolaeReference Mendiburu 56 . The following response variables were analyzed: cover crop biomass, biomass of weeds growing in the live cover crop (‘winter weed biomass’), plant N concentration and shoot N content (harvested cover crop biomass×N concentration), C:N ratio, soil nitrate–N, percent cover crop upright at 4 WAT and weed percent cover at 4 WAT. For each response variable, a mixed-effects model was applied with year and rep as random effects using the Restricted Maximum Likelihood MethodReference Pinheiro, Bates, DebRoy and Sarkar 55 . The Likelihood Ratio Test using the Maximum Likelihood Method determined the significance of the random effect year (and for nitrate–N analysis the random effect WAT).
If year was significant or a year by treatment interaction occurred, data within each year were analyzed separately with split-plot ANOVAs. Response variables were log, square root, arcsine or arcsine-square root transformed if not meeting the assumption of normality of residuals, and were back transformed for reporting. Tukey's HSD test determined mean separation at the P=0.05 significance level.
Spearman correlations determined the strength of the relationship at 4 WAT for (1) weed cover and cover crop plant N concentration; and (2) weed cover and soil nitrate at the P=0.01 significance level. Spearman correlations were used because data were non-normal, even when transformed.
Results and Discussion
Cover crop biomass production and termination time
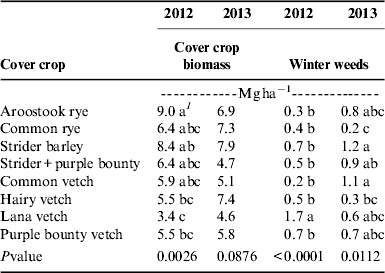
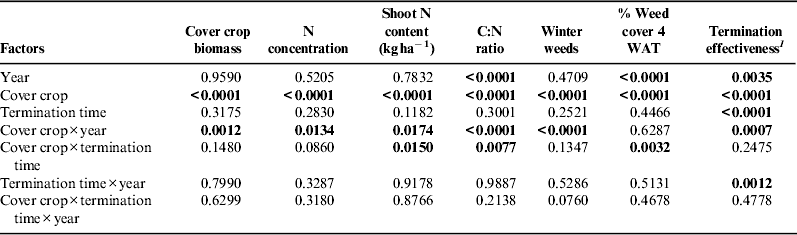
Cover crop biomass production in 2012 ranged from 3.4 to 9.0 Mg ha−1 and in 2013 from 4.6 to 7.9 Mg ha−1 (Table 3). Cover crop variety and the interaction between year and cover crop influenced cover crop biomass (Table 4). The interaction occurred because some crops (Aroostook rye and the barley–vetch mix) produced more biomass in 2012 than in 2013, and there was less variability across cover crop biomass production in 2013 than in 2012. Although differences in biomass production among some cover crop varieties were statistically significant in 2012 (P<0.05), differences were not statistically significant in 2013 (Table 3). Given the observed annual variability, additional years of biomass data may be needed to identify with greater certainty the most productive cover crops for Western Washington.
Cover crop and winter weed biomass for eight cover crops over 2 years.

1 Values in columns followed by same letter are not significantly different at P=0.05 by Tukey's HSD test.
Significance levels for year, cover crop and termination time on seven response variables for eight cover crops in 2012 and 2013.

1 Termination effectiveness applied only to three grain varieties.
Bold indicates P values that are statistically significant above the P=0.05 level.
Cover crop varieties were terminated in similar order both years (Table 2). Strider barley reached the target termination earliest, whereas common rye was latest among the grains. Lana vetch and common vetch were earliest among the vetches, whereas hairy vetch was the latest. Cover crops generally reached the target termination times earlier in 2013 than in 2012, although more GDD had accumulated at the time of termination in 2013 compared with 2012 (Table 2). Although this study did not include cash crops, a cover-cropped cash crop study in a neighboring field had similar termination dates, which were within the target window for planting main-season cash crops.
Termination timing did not have a statistically significant effect on biomass production (P=0.32), indicating that biomass did not increase between Early and Late termination. In contrast to this, Mirsky et al.Reference Mirsky, Curran, Mortenseny, Ryany and Shumway 47 found that delaying Aroostook rye termination both increased rye biomass and decreased weed biomass in the following mulch. Nord et al.Reference Nord, Ryan, Curran, Mortensen and Mirsky 48 found the average gain from waiting 10 days for termination in Pennsylvania in May increased Aroostook rye biomass by 1.79 Mg ha−1. However, Parr et al.Reference Parr, Grossman, Reberg-Horton, Brinton and Crozier 40 observed that the effect of termination timing on legume biomass depended on the species and variety, with many varieties showing no significant increase in biomass or N accumulation between mid-April and mid-May in North Carolina.
As biomass did not generally increase between anthesis and early milk for grains or between late flowering and full flowering for vetches, other factors, such as termination effectiveness or percent weed cover, should instead drive the choice of termination timing. Earlier termination would be desirable under the conditions of our study, as it enables earlier cash crop establishment. In some areas, waiting for rye to reach anthesis can push back vegetable planting time and reduce cash crop yieldsReference Davis 36 .
Plant N concentration
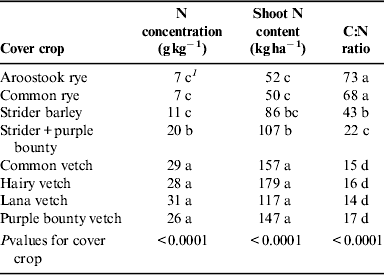
Cover crop variety and the interaction between year and cover crop variety significantly influenced biomass N concentration, shoot N content (plant N concentration×biomass), and C:N ratio (Table 4). Vetches had the highest N concentration (29 g N kg−1), followed by the mix (20 g N kg−1) and the grains (8 g N kg−1) (Table 5). Mean C:N ratio for the vetches was 16, compared with 22 for the mix and 61 for the grains. The interaction between year and cover crop variety occurred because the grains had slightly higher N concentration in 2013 than in 2012 (0.3 g N kg−1 difference, data not shown).
Above-ground biomass N concentration, shoot N content and C:N ratio for eight cover crops at termination across termination times and years.

1 Values in columns followed by same letter are not significantly different at P=0.05 by Tukey's HSD test.
Plant N concentration, shoot N content, and C:N ratio were similar between the Early and the Late termination timings when averaged over all cover crops, but there was a significant cover crop by termination time interaction for shoot N content and C:N ratio (Table 4). Late terminated grains had lower N concentration than the Early terminated grains (P<0.0001, data not shown), likely due to loss of N as leaves began to senesce. Because N concentration was low at both termination timings this between Early and Late was not biologically significant.
Among vetch varieties, waiting to terminate legume cover crops from 60% flowering to 100% flowering did not increase N concentration, except for hairy vetch. Hairy vetch matured slowly and had between 13 and 17 days to gain N between Early and Late termination. In the interval of 13–17 days, hairy vetch accumulated an average of 91 kg ha−1 more N at its Late termination compared with Early (data not shown).
Termination effectiveness
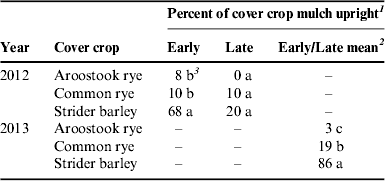
Termination timing, year and cover crop variety influenced percent of grain cover crop mulch upright at 4 weeks after rolling (Table 6). Percent of cover crop mulch upright ranged between 0 and 86% (Table 6). Aroostook rye was similar to or better than common rye at remaining prostrate after roller–crimping. In contrast, up to 86% of Strider barley plants returned upright (Table 6). The difference in rolling effectiveness between rye and barley may result from differences in plant architecture. As rye is substantially taller with thinner stems than barley it is more likely to remain flattened after roller–crimping.
Percentage of cover crop mulch upright at 4 WAT by Early and Late termination timings for three grain varieties in 2 years for roller–crimped plots.

1 Year and cover crop significantly influenced percent of cover crop mulch upright (P<0.0001), termination timing was significant in 2012 (P<0.0001) and the interaction between year and cover crop was significant (P=0.0012).
2 In 2013, no difference between Early and Late occurred, thus values are pooled for this year.
3 Values in columns followed by same letter are not significantly different at P=0.05 Tukey's HSD test.
An interaction between year and cover crop (P=0.0007) occurred, likely because Strider barley and common rye had less effective kill in 2013 than in 2012, while Aroostook rye was similar between years (Table 6). The year by termination timing interaction (P=0.0012) suggests that the effectiveness of a particular variety rolled Early or Late depended on year. In 2013 there was no difference between Early and Late termination timings in percent cover crop upright. However, in 2012 cover crops terminated Early were less effectively rolled than those terminated Late (Table 6).
Maturation is important for termination effectiveness; timely termination of a cover crop is essential to successful killing and subsequent mulchReference Kornecki, Arriaga and Price 15 . Termination timing should be determined by the stage of maturation, and if cover crops develop at a rapid rate during the termination stage it may be difficult to terminate at the correct time. Ideally, cover crop development would slow as it approaches the target termination stage, thus leaving a larger window to manage termination. Rye allows for more flexibility in coordinating field operations because post-anthesis rye matures more slowly than does barleyReference Legere and Bai 49 (Fig. 1). If cover crops mature to the point of producing viable seed, the reseeded cover crop can be a weed in the cash crop.
Vetch and grain development May–June in 2012 and 2013 using the Zadoks development scale for three grainsReference Zadoks, Chang and Konzak 51 and Mischler et al.Reference Mischler, Duiker, Curran and Wilson 10 scale for four vetches. Zadoks stages are: 50–60 inflorescence emergence, 60–70 anthesis and 70–80 milk development. Vetch stages are: 4=60% flowering, 6=100% flowering and 7=Early pod set.

Termination by flailing was effective for all cover crops except hairy vetch at the Late termination stage in 2013. The large biomass and long stems of the hairy vetch clogged the flail-mower, resulting in ineffective flailing.
Soil nitrate–N
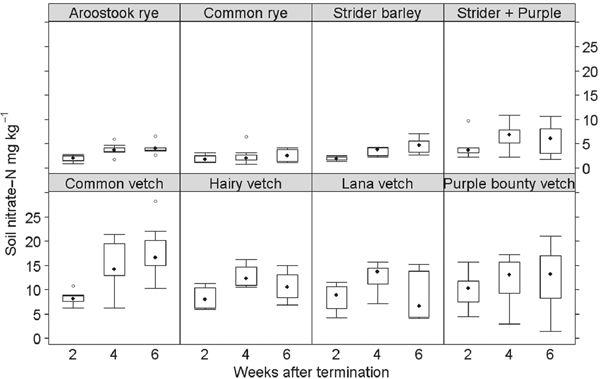
Soil nitrate–N was similar across years, but did vary over the field season at 2, 4 and 6 WAT (P<0.0001). Soil nitrate–N ranged from 3 to 20 mg N kg−1 soil (9–66 kg ha−1) in the 0–30 cm depth at 6 WAT (Fig. 2). Cover crop variety also influenced soil nitrate–N (P<0.0001): vetches resulted in more soil nitrate–N than the barley–vetch mix, which had more than the grains (Fig. 2). An interaction occurred between cover crop variety and year (P=0.0102), because grains had slightly higher mean soil nitrate–N in 2013 than in 2012 (3.5 versus 2.3 mg nitrate–N kg−1 soil), whereas the vetches had slightly lower mean soil nitrate–N in 2013 than in 2012 (10.6 versus 12.1 mg nitrate–N kg−1 soil). Soil nitrate–N was similar across grain varieties (Fig. 2). Soil nitrate–N was also similar across vetch varieties except that common vetch had significantly higher soil nitrate–N concentrations than did Lana at 6 WAT.
Soil nitrate–N, years 2012 and 2013 combined, over three sampling dates for eight cover crop varieties.

Mid-season soil nitrate levels indicated insufficient N for cash crops in both 2012 and 2013, based on a sufficiency level of 25 mg kg−1 soil nitrate–N developed for manured systems in the maritime Pacific NorthwestReference Marx, Christensen, Hart, Gangwer, Cogger and Bary 57 . The low soil nitrate–N levels do not appear to be the result of leaching or denitrification loss, as rainfall from May to July was less than 150 mm both years. Parr et al.Reference Parr, Grossman, Reberg-Horton, Brinton and Crozier 40 reported that corn following rolled legume cover crops generally had lower yield than control corn fertilized at optimum levels (112 kg N ha−1), although some cover crop-termination date combinations did have equivalent yields to the fertilized corn, indicating the potential for N sufficiency in some circumstances.
Overwintering weed populations
Winter weed biomass indicates the vigor of cover crop biomass and stand establishment because higher cover crop biomass production results in fewer winter weeds due to competition with the growing cover cropReference Hayden, Brainard, Henshaw and Ngouajio 58 . Although we did not enumerate winter weeds, chickweed (Stellaria media), shepherd's purse (Capsella bursa-pastoris) and annual bluegrass (Poa annua) were the most apparent in the plots. Low-growing non-mustard species such as chickweed and annual bluegrass can be problematic in following crops if they survive mechanical terminationReference Hayden, Brainard, Henshaw and Ngouajio 58 . Winter weed biomass ranged between 0.3 and 1.7 Mg ha−1 in 2012 and 0.2 and 1.2 Mg ha−1 in 2013 (Table 3). In 2012 weed biomass production was similar among cover crop varieties, except for Lana vetch. In 2013, Strider barley and common vetch had significantly more weed biomass than common rye and hairy vetch (Table 3). Other research has shown that rye cover crops have less winter weed biomass than do vetch cover cropsReference Hayden, Brainard, Henshaw and Ngouajio 58 .
Winter weed biomass was similar at the Early and Late termination timings, akin to what was observed for cover crop biomass. This suggests that both cover crops and winter weeds had reached full biomass potential by the Early termination date, with little change occurring thereafter.
An interaction between year and cover crop occurred (Table 4) because Lana vetch had markedly fewer weeds in 2013 than in 2012 (0.6 and 1.7 Mg ha−1, respectively); Lana vetch had a poor stand in 2012 and a healthy stand in 2013. This is consistent with Brennan et al.Reference Brennan, Boyd, Smith and Foster 59 who found that cover crops with poor canopy closure and limited ground cover early in the season had more weeds.
Summer weeds
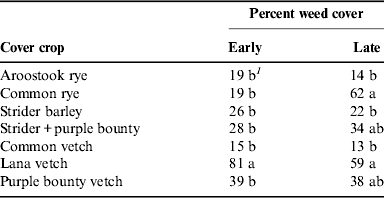
Cover crop variety significantly influenced summer weed cover, and there was a termination timing by cover crop interaction (Table 4). Percentage of summer weed cover was significantly higher in 2013 (44%) than in 2012 (23%). Of the cover crops terminated at the Early stage, Lana vetch had the most weeds (Table 7). At the Late termination stage Lana vetch and common rye had significantly more weed cover than Aroostook rye, Strider barley and common vetch (Table 7). Others have reported Aroostook rye mulch to perform well blocking weedsReference Ryan, Mirsky, Mortensen, Teasdale and Curran 19 , Reference Mirsky, Curran, Mortenseny, Ryany and Shumway 47 .
Percent weed cover at 4 WAT by cover crop for two termination times in flail-mowed plots.

1 Values in columns followed by same letter are not significantly different at P=0.05 by Tukey's HSD test.
Our weed cover results may represent a worst case scenario because no cash crops were grown in the mulch; the presence of a cash crop would provide canopy to help block weeds, so this situation would be improved in systems with a summer cropReference Ryan, Mirsky, Mortensen, Teasdale and Curran 19 . In a study on soybeans planted in rye mulch, soybean density accounted for 70–85% of the influence on weed biomassReference Ryan, Mirsky, Mortensen, Teasdale and Curran 19 .
Grasses, sowthistles (Sonchus spp.), and common chickweed (S. media L) were the most prevalent weeds at 4 WAT. Grass weeds can be difficult to control in reduced-tillage systems, but adequate cover crop biomass reduces grass competitionReference Mulvaney, Price and Wood 6 .
The worst performing cover crop mulches were Late common rye, and Early and Late Lana vetch, all of which had greater than 50% weed cover at 4 WAT. The poor performance of the Lana vetch was likely due to its low biomass production (Table 3), thus we would not recommend growing Lana vetch as a cover crop in this region. The poor performance of the Late flailed common rye occurred both years and was unexpected.
Termination type was applied only to grains to determine the effect of rolling versus flailing on weed cover. Termination type influenced weed cover (P=0.007); flailed grains had significantly more weed cover than did rolled grains. Rolled grain treatments had on average 19% weed cover at 4 WAT, whereas flailed grain treatments had 27% (data not shown). Rolled mulch has been shown to be more persistent than flailed mulchReference Morse 14 , Reference Teasdale and Daughtry 42 and we would expect longer mulch persistence would decrease weed cover. Also, flail-mowed mulch can be less uniform than rolled mulch; weeds take advantage and emerge through thin placesReference Teasdale, Coffman and Mangum 23 .
Weeds and nitrate–N and plant N correlations
Soil nitrate–N did not significantly correlate with weed cover at 4 WAT (n=28, Spearman's r s=0.17, P=0.2524), although there was a weak but significant correlation between weed cover and plant N concentration (Spearman's r s=0.18, n=28, P=0.0104). Increased plant N concentration and soil nitrate–N did not explain much of the variability in weed pressure from the legume N additions. Other factors associated with cover crops, such as mulch thicknessReference Mohler and Teasdale 24 , allelopathyReference Wang, Feng, Liang, Xu, Su, Song and Zeng 60 , fungal pathogensReference Kruidhof, Gallandt, Haramoto and Bastiaans 61 and soil moistureReference Kruidhof, Gallandt, Haramoto and Bastiaans 61 , may also have influenced the relationship between N concentration and weed cover.
Other researchers controlled levels of N fertilizer and did find relationships between N and weedsReference Moonen and Barberi 12 , Reference Blackshaw, Brandt, Janzen, Entz, Grant and Derksen 62 , Reference Brainard, Bellinder and Kumar 63 and Teasdale and PillaiReference Teasdale and Pillai 64 found that ammonium from mineralized vetch stimulated small-seeded weeds such as pigweed. Our study measured rather than controlled N inputs and our soil nitrate–N levels were low across all treatments. Also, our study did not account for germinated weeds that had not yet emerged, thus treatment differences were harder to detect. Brainard et al.Reference Brainard, DiTommaso and Mohler 43 reported that response of Powell amaranth (Amaranthus powellii S. Wats.) to N varied widely by farm location and year. This suggests that 2 years of data at one location may not be sufficient to draw robust conclusions on the relationship between weeds and nitrate-N.
Conclusions and management recommendations
The results of this study indicate that cover crop variety influences cover crop biomass, soil nitrate–N and subsequent weed cover at 4 WAT, while termination timing only influences the effectiveness of termination by rolling. Variation in cover crop N or soil nitrate–N did not have a major influence on weed cover.
The lack of influence of termination timing on biomass production is an important finding for growers because it shows that delaying termination beyond anthesis for grains or mid-flowering for vetches is not beneficial in flailed systems. Delaying termination does offer benefits in increased roller–crimping effectiveness but does not increase cover crop biomass. In rolled plots, termination timing did significantly influence termination effectiveness, with roller–crimping at early milk providing more effective kill than termination during anthesis. Termination time did not influence plant N concentration, kg ha−1 of plant N, or C:N ratio in vetches (except hairy vetch), thus there is no gain in vetch N contribution from waiting to terminate until 100% flowering. Finally, planting early-season vegetables would be too late for even the Early termination dates in this study; however, terminating at these dates would be adequate for main-season vegetable crops in Western Washington.
Most promising of the grain varieties was Aroostook rye. Advantages of Aroostook rye are high biomass production, good weed suppression and roller–crimping kill success. But Aroostook rye, as any other grain crop, does not provide N to the following cash crop. Additionally, Aroostook rye seed is expensive and may not be readily available in the Pacific Northwest.
Like Aroostook rye, Strider barley produced plentiful biomass in both years, and only had between 22 and 26% weed cover at 4 WAT, but up to 86% of its mulch returned upright again 4 weeks after rolling. Because Strider is difficult to roll effectively, rolling Strider cannot be recommended until better rolling strategies are developed. Aroostook rye performed better than Strider barley because of termination effectiveness and biomass production.
Common vetch had the best overall performance among vetches. It had weed cover between 13 and 15% at 4 WAT, and by 6 WAT had equivalent or greater soil nitrate–N than the other vetch varieties. Common vetch grows vigorously, matures early, is easy to terminate by flail-mowing, and its seed was the least expensive among the vetches. However, weed suppression from common vetch is less than that from Aroostook rye.
Ultimately, choosing and managing cover crop varieties for weed suppression is about trade-offs for weed management, mulch effectiveness, soil nitrate–N inputs, maturation rate and biomass production.
Managing cropping systems to optimize cover crop biomass is an important future research need for reduced-tillage organic farming systems in the maritime Northwest. Research in the Eastern USA showed that optimal management of rye could double biomassReference Ryan, Mirsky, Mortensen, Teasdale and Curran 19 , thus increasing effectiveness as a mulch. The challenge is improving conditions for cover crop growth within the context of the cash crop system.
Other future research to benefit growers includes: (1) investigating cover crop mulch effects on soil moisture and resulting cash crop and weed response; and (2) evaluating cover crop blends composed of the most promising varieties (such as Aroostook rye and common vetch).
Acknowledgements
This project was funded by the Western Sustainable Agriculture Research and Education Program (project number: SW11-072), the Washington State University Biologically Intensive Agriculture and Organic Farming Program, the Washington State University Department of Crop and Soil Sciences and the Agricultural Research Center at Washington State University (Hatch Project 0722). Thanks to Liz Myhre for field assistance and organizational expertise.