Implications
The difference in the natural abundance of 15N between an animal and its diet (Δ15Nanimal-diet) is a good biomarker for predicting the efficiency of N utilization. Our results in dairy cows fed diets not exceeding recommended protein levels demonstrate that digestion processes contribute little to the relationship between Δ15Nanimal-diet and milk N efficiency (MNE; milk N/N intake). In these conditions, animal’s metabolism seems to be the most important factor in causing differences in 15N between animal and diet. This biomarker could serve to predict MNE if most of variation is owing to differences in the metabolic N partitioning.
Introduction
The efficiency with which feed N is converted into animal proteins, or efficiency of N utilization (ENU; animal N gain or milk N yield/N intake), is an important concern in livestock production, because it may impact on both farm economy (Godden et al., Reference Godden, Lissemore, Kelton, Leslie, Walton and Lumsden2001) and environmental pollution (Castillo et al., Reference Castillo, Kebreab, Beever, Barbi, Sutton, Kirby and France2001). However, in practice, assessing this efficiency is laborious, costly and not always possible for all animals, because it requires accurate measurements of individual feed N intake and animal body N gain or milk N yield over a long period of time. In recent years, there has been an increased interest in finding biomarkers for the prediction and evaluation of feed efficiency, and in particular ENU (Bertrand et al., Reference Bertram, Yde, Zhang and Kristensen2011; Cheng et al., Reference Cheng, Kim, Merry and Dewhurst2011). Although blood or milk urea-N have classically been used as a predictor of ENU in different species (Kohn et al., Reference Kohn, Kalscheur and Russek-Cohen2002), they are not well suited to assessing variations at the individual level (Jonker et al., Reference Jonker, Kohn and Erdman1998; Huhtanen et al., Reference Huhtanen, Cabezas-Garcia, Krizsan and Shingfield2015) or accounting for variations in the efficiency of use of absorbed amino acids (AA) (Hof et al., Reference Hof, Vervoorn, Lenaers and Tamminga1997).
An alternative predictor of feed (N) efficiency in ruminants is based on N isotopic fractionation (Cheng et al., Reference Cheng, Sheahan, Gibbs, Rius, Kay, Meier, Edwards and Roche2013; Cantalapiedra-Hijar et al., Reference Cantalapiedra-Hijar, Ortigues-Marty, Sepchat, Agabriel, Huneau and Fouillet2015). It has been shown across a variety of conditions that 15N natural abundance (δ 15N; 15N/14N ratio relative to atmospheric N2) in animal proteins is higher than in the diet consumed (DeNiro and Epstein, Reference DeNiro and Epstein1981) and that variations in this isotopic N fractionation (∆15Nanimal-diet = δ 15Nanimal−δ 15Ndiet) are closely and negatively correlated with ENU in different species (Gaye-Siessegger et al., Reference Gaye-Siessegger, Focken, Muetzel, Abel and Becker2004; Cheng et al., Reference Cheng, Sheahan, Gibbs, Rius, Kay, Meier, Edwards and Roche2013; Cantalapiedra-Hijar et al., Reference Cantalapiedra-Hijar, Ortigues-Marty, Sepchat, Agabriel, Huneau and Fouillet2015). The more efficiently the animals assimilate dietary N, the closer are the δ 15N values in animal proteins and diet (i.e. lower Δ15Nanimal-diet), and this may apply at the individual animal level (Gaye-Siessegger et al., Reference Gaye-Siessegger, Focken, Muetzel, Abel and Becker2004; Poupin et al., Reference Poupin, Mariotti, Huneau, Hermier and Fouillet2014; Wheadon et al., Reference Wheadon, McGee, Edwards and Dewhurst2014). Therefore, Δ15Nanimal-diet could be used to classify individuals receiving the same diet by their ENU.
Different enzymes, such as transaminases and deaminases, have been shown to react more readily with AA containing 14N than with those containing 15N (Macko et al., Reference Macko, Estep, Engel and Hare1986; Weiss et al., Reference Weiss, Chen, Cleland and Cook1988), resulting in the greater excretion of the isotopically lighter 14N and greater retention of the isotopically heavier 15N (Ganes et al., Reference Gannes, Martinez del Rio and Koch1998), and causing an isotopic N fractionation between the animal and its diet (∆15Nanimal-diet). As of its role in AA catabolism, the liver has been proposed as a key organ contributing to this isotopic N fractionation (Sick et al., Reference Sick, Roos, Saggau, Haas, Meyn, Walch and Trugo1997; Cantalapiedra-Hijar et al., Reference Cantalapiedra-Hijar, Ortigues-Marty, Sepchat, Agabriel, Huneau and Fouillet2015). In addition, previous findings in ruminants suggest an important role of rumen bacteria in the natural 15N enrichment of animal proteins relative to diet (Δ15Nanimal-diet; Sutoh et al., Reference Sutoh, Koyama and Yoneyama1987 and Reference Sutoh, Obara and Yoneyama1993; Wattiaux and Reed, Reference Wattiaux and Reed1995). However, to date, the potential contribution of rumen digestion to natural 15N bioaccumulation and thus its impact on the relationship between ENU and the animal isotopic N fractionation (i.e. ∆15Nanimal-diet) has been discussed (Cabrita et al., Reference Cabrita, Fonseca and Dewhurst2014; Cantalapiedra-Hijar et al., Reference Cantalapiedra-Hijar, Ortigues-Marty, Sepchat, Agabriel, Huneau and Fouillet2015) but not properly assessed. The aim of this study was to evaluate to what extent the relationship between Δ15Nanimal-diet and ENU was impacted by digestive processes, in contrast to metabolism, in dairy cows fed diets similar to those previously tested (Cantalapiedra-Hijar et al., Reference Cantalapiedra-Hijar, Ortigues-Marty, Sepchat, Agabriel, Huneau and Fouillet2015), and in which duodenal flow of N fractions were measured. A second objective was to assess the relationship between rumen N metabolism and isotopic N fractionation of rumen bacteria.
Material and methods
This experiment was conducted in compliance with national legislation on animal care (Certificate of Authorization to Experiment on Living Animals, No. 004495, Ministry of Agriculture, France). To achieve the objectives of this study, samples and unpublished data from one previous experiment (Fanchone et al., Reference Fanchone, Nozière, Portelli, Duriot, Largeau and Doreau2013) were used.
Animal and diets
Four Holstein cows in mid-lactation, averaging 662±62 kg BW and 71±10 days in milk at the onset of the experiment were used in a 4×4 Latin square design (Fanchone et al., Reference Fanchone, Nozière, Portelli, Duriot, Largeau and Doreau2013). Permanent ruminal and duodenal (T-shape) cannulas were surgically implanted under general anesthesia. Four iso-NEL diets were formulated to test the effects of metabolizable protein level (MP expressed in proteins digestible in the small intestine (PDI); 80% v. 110% of requirements (INRA, 2007)) and dietary energy source (E; 310 g starch and 361 g NDF/kg DM (dry matter) (starch diets), and 152 g starch and 490 g NDF/kg DM (fiber diets)). Diets were distributed as total mixed rations twice daily at 0900 h (60% of the diet) and 1700 h (40% of the diet) and at restricted intake levels based on 95% voluntary intake. Diet composition is detailed in Fanchone et al. (Reference Fanchone, Nozière, Portelli, Duriot, Largeau and Doreau2013). The dairy cows were subjected to four experimental periods lasting 28 days each and consisted of 22 days for animals to adapt to the diets and 6 days for measurements. Original data obtained by Fanchone et al. (Reference Fanchone, Nozière, Portelli, Duriot, Largeau and Doreau2013) were used to calculate rumen, digestive, metabolic and milk N efficiency (MNE; milk N yield/N intake) as detailed in calculations, whereas samples were used for isotopic N analysis.
Sampling and measurements
A sample of each feed ingredient (around 100 g) was collected daily from day 24 to day 28, dried at 60°C for 48 h, pooled by period and ground at 1 mm before isotopic analysis. Two kg samples representative of ruminal content at the different sampling times (0900, 1130 and 1400 h) were collected on day 24 for two cows and on day 27 for the other two cows. Solid and liquid phases of these ruminal contents were separated to obtain samples of solid-associated rumen bacteria (SAB) and liquid-associated rumen bacteria (LAB), as described in Bauchart et al. (Reference Bauchart, Legay-Carmier, Doreau and Gaillard1990). Duodenal samples were collected day and night at 1.5-h intervals from day 25 to day 27 (around 250 ml) providing representative samples of duodenal contents. These samples were pooled per animal and per period and frozen at −20°C. Blood samples from all animals were collected by jugular venipuncture on day 27 using 10 ml blood vacutainer tube containing sodium heparin. Blood samples were immediately stored on ice until centrifugation (2500×g for 20 min at 4°C) to separate the plasma, which was stored at −80°C until plasma protein isolation. Upon thawing at 4°C overnight, protein fraction was isolated by precipitation with sulfosalicylic acid (200 µl into 2 ml of sample; 1 g/ml). After 1-h storage at 4°C and centrifugation (4500×g for 20 min at 4°C), the supernatant and pellet were separated. The pellet was rinsed three times with milliQ water (Millipore, Bedford, MA, USA). Bacterial, duodenal, fecal and plasma protein samples were freeze-dried and stored until isotopic analysis.
N stable isotope natural abundance analysis
Individual feed ingredients, rumen bacterial pellets (SAB and LAB), duodenal digesta, feces and plasma proteins were analyzed for N stable isotope composition (δ 15N, i.e. natural relative abundance of the rare stable isotope of N) by using an isotope-ratio mass spectrometer (Isoprime, VG Instruments, Manchester, UK) coupled to an elemental analyzer (EA Vario Micro Cube, Elementar, Germany). Tyrosine was used as internal standard and included in every run to correct for possible variations in the raw values determined by the mass spectrometer. Typical replicate measurement errors for these reference materials were±0.1‰. Results were expressed using the delta notation according to the following equation:
 $$\delta ^{{15}} {\rm N}=\left[ {\left( {{{R_{{{\rm sample}}} } \over {R_{{{\rm standard}}} }}} \right){\minus}1} \right]{\times}1000$$
where R sample and R standard are the N isotope ratio between the heavier isotope and the lighter isotope (15N/14N) for the sample being analyzed and the internationally defined standard (atmospheric N2, R standard=0.0036765), respectively, and δ the delta notation in parts per 1000 (‰) relative to the standard.
Calculations and statistical analysis
The isotopic N fractionation (Δ15Nanimal-diet) was calculated as δ 15N of the considered animal N pool (rumen bacteria (SAB and LAB), duodenal digesta, feces or plasma proteins) minus δ 15N of the diet, the latter calculated as the average of δ 15N of each ingredient weighted by the percentage of N the ingredient represents in the diet. For comparison with the measured δ 15N value, a theoretical δ 15N value of duodenal digesta was estimated from the contribution (%) of feed and microbial N to duodenal flow of non-ammonia N (NAN) previously measured in this same experiment (average 30% and 59%, respectively; Fanchone et al., Reference Fanchone, Nozière, Portelli, Duriot, Largeau and Doreau2013) and the theoretical contribution of endogenous N to duodenal NAN flow (2.27 g endogenous N/kg dry matter intake (DMI) (Sauvant and Nozière, Reference Sauvant and Nozière2013), accounting in the present experiment for 11% of duodenal flow of NAN). Each of these contributions (feed, microbial and endogenous) were multiplied by the δ 15N values of diet, bacterial reference sample (assuming a SAB : LAB=3 : 1) and plasma proteins, respectively, the latter considered as a proxy of δ 15N value of endogenous protein. Rumen N efficiency was calculated as proposed by Bach et al. (Reference Bach, Calsamiglia and Stern2005) as bacterial N per rumen available N. Bacterial N was calculated as detailed by Fanchone et al. (Reference Fanchone, Nozière, Portelli, Duriot, Largeau and Doreau2013), whereas rumen available N was calculated as follows: measured N intake – measured non-ammonia and non-microbial N flowing to the duodenum – theoretical endogenous N flow to the duodenum (Sauvant and Nozière, Reference Sauvant and Nozière2013). Digestive ENU was calculated as the measured flux of apparently digested AA in the small intestine (here assumed as MP supply) divided by the measured CP intake. Metabolic ENU was calculated as milk CP yield divided by measured MP supply. Finally, the MNE was calculated as milk N yield divided by N intake.
A mixed model was fitted using the lme procedure within the nlme package of the R software (version 3·0·1). Statistical analyses were carried out as a 4×4 Latin square, following the model: Y ijkl =µ+P i +C j +MP k +E l+MP×E kl +ε ijkl ; where Y ijkl is the dependent variable; µ the overall mean; P i the fixed effect of the experimental period i=1−4; C j the random effect of cow j=1−5; MP k the fixed effect of MP content (80% v. 110%); E l the fixed effect of dietary energy source (starch v. fiber); MP×E kl the fixed effect of the interaction between MP and E; and ε ijkl the random residual error. When the interaction between main effects was significant, the dietary treatment means were compared using Tukey’s honest significant difference multiple comparison. The δ 15N mean values from different N pools were compared within animal×treatment through a paired Student’s t test. The significance of treatment effect was set at P<0·05, whereas the tendency was set at 0.05⩽P⩽0.10. Regression analysis between observed (non-adjusted) data of Δ15N measured in different N pools and N partitioning indices was performed using the lm procedure in R software (version 3.0.1.).
Results
Natural 15N abundance in diets and different animal N pools
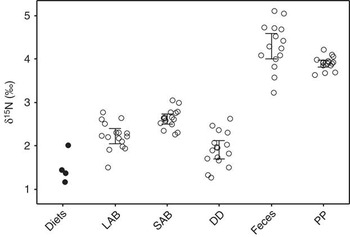
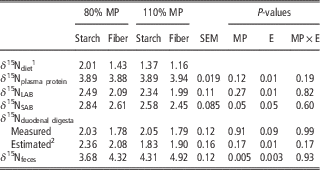
The δ 15N values of diets ranged from 1.16‰ to 2.01‰ (Table 1). The δ 15N mean values were different (P<0.001) among the different analyzed N pools and were ranked from the highest to the lowest as follows (Figure 1): feces (4.30‰), plasma proteins (3.90‰), SAB (2.62‰), LAB (2.23‰) and duodenal digesta (1.91‰). The largest variability in terms of δ 15N values for a same N pool was noted for duodenal digesta and feces (CV=10% and 6.7%, respectively), whereas plasma proteins showed the smallest variability (CV=2.1%). Estimated δ 15N values for duodenal digesta (mean value=2.05‰) were not different (P=0.21) from those actually measured.
Natural abundance of 15N (δ 15N, ‰) measured in liquid rumen-associated bacteria (LAB), solid rumen-associated bacteria (SAB), duodenal digesta (DD), feces and plasma proteins (PP) from lactating dairy cows fed the experimental diets. Bars indicate confidence intervals at 95%.

Natural abundance of 15N (δ 15, ‰) in different N pools of dairy cows fed diets differing in metabolizable protein supply (MP; 80% v. 110% of requirements) and energy source (E; starch v. fiber)

LAB=liquid-associated rumen bacteria; SAB=solid-associated rumen bacteria.
1 n=1.
2 Estimated according to the contribution of N fractions flowing to the duodenum and their δ 15N values. See Material and methods section for more details.
As expected and in line with δ 15N values of diets, all analyzed N pools showed, on average, higher δ 15N values for starch v. fiber diets (P⩽ 0.09). On the other hand, 80% MP diets promoted higher (P=0.05) δ 15N values in SAB but lower (P=0.003) in feces compared with 110% MP diets, with no changes (P⩾0.12) for δ 15N values of plasma proteins, LAB and duodenal digesta.
Isotopic N fractionation and ENU
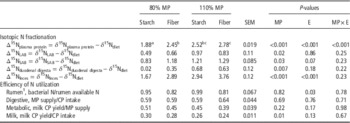
The isotopic N fractionation (Table 2) of rumen bacteria (Δ15N=δ 15Nbacteria−δ 15Ndiet) was relatively small, ranging from 0.49‰ to 0.97‰ for LAB and from 0.83‰ to 1.29‰ for SAB, likewise that of duodenal digesta (Δ15N=δ 15Nduodenal digesta−δ 15Ndiet), which ranged between 0.02‰ and 0.68‰. In contrast, the isotopic N fractionation of animal proteins (Δ15N=δ 15Nplasma protein−δ 15Ndiet) and feces (Δ15N=δ 15Nfeces−δ 15Ndiet) were higher, ranging from 1.88‰ to 2.78‰ and from 1.67‰ to 3.76‰, respectively.
Isotopic nitrogen fractionation in different N pools and efficiency of N utilization in dairy cows fed diets differing in metabolizable protein supply (MP; 80% v. 110% of requirements) and energy source (E; starch v. fiber)

LAB=liquid-associated rumen bacteria; SAB=solid-associated rumen bacteria.
a,b,cValues within a row with different superscripts differ significantly at P=0.05.
1 Rumen N efficiency is calculated as g of microbial N flowing to the duodenum (mixed bacteria (SAB : LAB=3 : 1) as the reference microbial pellet) divided by the rumen available N (N intake – non-ammonia and non-microbial N flowing to the duodenum – endogenous N). See Material and methods section for more details.
Starch diets resulted in lower isotopic N fractionation in feces (P<0.001) and SAB (P=0.07) compared with fiber diets as well as in plasma proteins (P<0.001), but only at low N levels (N×E; P<0.001). No changes were found when the isotopic N fractionation was measured in either LAB (P=0.86) or duodenal digesta (P=0.18). As expected, as dietary MP increased the isotopic N fractionation increases (P≤0.03) for all analyzed N pools.
Similar digestive and metabolic ENU were found across dietary treatments (P⩾0.17). However, rumen N efficiency utilization (microbial N/available N) was higher (P=0.03) for starch v. fiber diets, and not affected (P=0.82) by the dietary MP level. Conversely, MNE (milk N yield/N intake) was higher (P=0.01) for 80% MP (mean value of 0.28) v. 110% MP (mean value of 0.25) diets and not affected by the energy source (P=0.13).
Relationships between N isotopic fractionation and N utilization
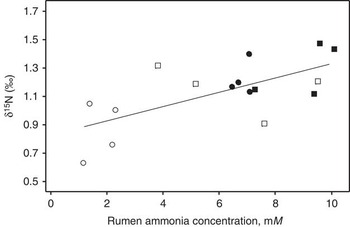
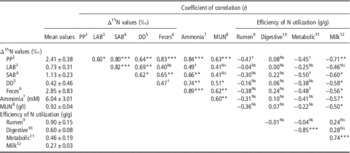
All analyzed animal N pools were positively correlated or tended to be correlated (P<0.10) with each other in terms of Δ15N (Table 3), except for a non-significant relationship between feces and LAB (P⩾0.10). Rumen ammonia concentration and milk urea-N were positively correlated with each other (P<0.01) and both with Δ15N values of all analyzed samples, except for a non-significant relationship between Δ15N values of rumen bacteria (LAB and SAB) and milk urea-N (P⩾0.10). A modest (r=0.66) and significant (P<0.01) relationship was noted between rumen ammonia concentration and Δ15N values of SAB (Figure 2).
Relationship between 15N natural abundance (δ 15N, ‰) of solid-associated rumen bacterial and rumen ammonia concentration in dairy cows. Experimental diets were 80% MP starch (○), 80% MP fiber (□), 110% MP starch (●) and 110% MP fiber (■). Fitted equation: δ 15N=0.83(±0.10)+0.050(±0.02)×rumen ammonia concentration.

Relationships between N isotopic fractionation (Δ15Nanimal-diet) of animal N pools, efficiency of N utilization and criteria of N status in lactating dairy cowsFootnote 1

1 n=16.
2 Plasma proteins (PP): δ 15Nplasma protein−δ 15Ndiet.
3 Liquid-associated rumen bacteria (LAB): δ 15NLAB−δ 15Ndiet.
4 Solid-associated rumen bacteria (SAB): δ 15NSAB−δ 15Ndiet.
5 Duodenal digesta (DD): δ 15Nduodenal digesta−δ 15Ndiet.
6 Feces: δ 15Nfeces−δ 15Ndiet.
7 Rumen ammonia concentration (mM) reported in Fanchone et al. (Reference Fanchone, Nozière, Portelli, Duriot, Largeau and Doreau2013).
8 Milk urea-N (MUN) (mg/dl) reported in Fanchone et al. (Reference Fanchone, Nozière, Portelli, Duriot, Largeau and Doreau2013).
9 Rumen N efficiency (microbial N flowing to the duodenum/rumen available N).
10 Digestive N efficiency (metabolizable protein (MP) supply/CP intake).
11 Metabolic N efficiency (milk CP yield/MP supply).
12 Milk N efficiency (milk CP yield/CP intake).
***P<0.001, **P<0.01, *P<0.05, † P⩽0.10, Ns P>0.10.
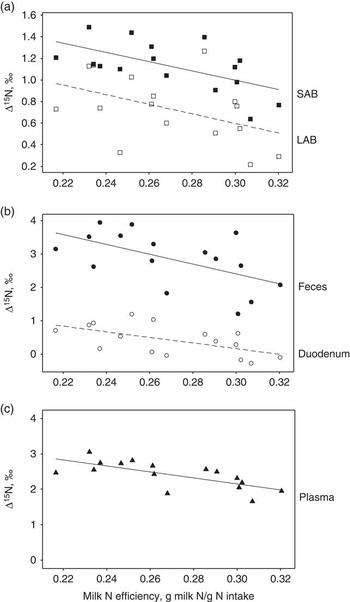
None of the Δ15N values of analyzed samples were correlated (P⩾0.10) with either rumen or digestive N efficiency, except for a tendency for Δ15Nplasma protein to be correlated to rumen N efficiency (P<0.10). The Δ15N values of plasma proteins, SAB and feces showed a tendency to be negatively correlated with metabolic N efficiency. The Δ15N values of almost all analyzed N pools were negatively correlated with MNE (P<0.05) and positively correlated (Figure 3) with rumen ammonia concentration (P<0.01). Only in the case of LAB there was no significant correlation with MNE (P⩾0.10) and only a tendency (0.05⩽P⩽0.10) to be correlated with rumen ammonia concentration.
Relationship between isotopic N fractionation (Δ15N, ‰) of different animal N pools and milk N efficiency (MNE). (a) Solid-associated rumen bacteria (SAB, ■) and liquid-associated rumen bacteria (LAB, □), (b) duodenal digesta (○) and fecal content (●) and (c) plasma proteins (▲). Fitted equations: LAB: Δ15N=0.30(±0.19)−0.047((±0.24)×MNE (r 2=0.21); SAB: Δ15N=0.36(±0.03)−0.082((±0.03)×MNE (r 2=0.36); duodenum: Δ15N=0.29(±0.009)−0.040((±0.02)×MNE (r 2=0.34); feces: Δ15N=0.33(±0.025)−0.022((±0.008)×MNE (r 2=0.31); plasma: Δ15N=0.41(±0.04)−0.059((±0.02)×MNE (r 2=0.51).

Rumen ammonia concentration and milk urea-N were negatively correlated (P<0.05) with MNE, but unexpectedly not with rumen and digestive ENU or with metabolic ENU (P⩾0.10). Finally, a negative and significant (P<0.001) relationship was noted between digestive and metabolic ENU (r=−0.85), only the latter being positively correlated (P<0.001) with MNE (r=0.74).
Discussion
Animal tissues are generally 15N enriched relative to their diet (DeNiro and Epstein, Reference DeNiro and Epstein1981), the natural 15N abundance (δ 15N) being higher in body proteins than in the diet. We measured this difference, termed isotopic N fractionation (Δ15Nanimal-diet), in different body pools (including rumen bacteria, duodenal digesta, feces and plasma proteins) under different nutritional conditions. Our results showed that Δ15Nanimal-diet was negatively correlated with MNE (Figure 3) in all pools measured (except for LAB), with the strongest correlation found for plasma proteins. This confirms previous findings in dairy cows fed diets similar to those of this experiment (Cantalapiedra-Hijar et al., Reference Cantalapiedra-Hijar, Ortigues-Marty, Sepchat, Agabriel, Huneau and Fouillet2015). Moreover, the present results showed (Figure 1) a very weak 15N enrichment in duodenal digesta (Δ15Nduodenal digesta-diet mean value=0.42) compared with the one observed in plasma proteins (Δ15Nplasma protein-diet mean value=2.41). As further discussed below, these data suggest that most of the isotopic N fractionation observed in plasma proteins is of metabolic origin, with very little direct impact of the overall digestion process on the relationship between Δ15Nplasma protein-diet and MNE.
Nitrogen partitioning into anabolic (leading to protein synthesis) and catabolic (leading to N excretion) pathways, and thus the ENU, is mainly dictated in ruminants by the fate of N at three different levels: (i) the rumen (microbial protein synthesis v. positive rumen protein balance (ammonia absorption)), (ii) the intestine (true digestibility v. endogenous N secretion) and (iii) tissue metabolism (protein synthesis v. AA catabolism (mainly in the liver)). Current knowledge suggests that the isotopic N fractionation in ruminants occurs mainly during rumen bacterial protein synthesis (Wattiaux and Reed, Reference Wattiaux and Reed1995) and hepatic AA catabolism (Cantalapiedra-Hijar et al., Reference Cantalapiedra-Hijar, Ortigues-Marty, Sepchat, Agabriel, Huneau and Fouillet2015). Samples representing these important pools (bacterial pellets (rumen), duodenal digesta and feces (intestine) and plasma proteins (liver)) were analyzed for natural abundance of 15N relative to diet and the ENU at the three different levels (rumen, digestive and metabolic) were calculated. Finally, the relationship between rumen N efficiency and isotopic N fractionation of rumen bacteria was evaluated.
Isotopic N fractionation of rumen bacteria
Our results showed that LAB and SAB were only slightly enriched in 15N relative to the ruminant diet (Δ15N=0.73 and 1.13‰, respectively), and so contributed little to the enrichment of plasma proteins in 15N.
Heterotrophic bacteria, such as rumen bacteria, can markedly change both the isotopic composition of organic matter (OM) they have access to and their own isotopic composition (Macko and Estep, Reference Macko and Estep1984). In the present study, rumen bacteria were 15N enriched relative to diets (average of 0.93‰) in agreement with in vivo studies (Sutoh et al., Reference Sutoh, Koyama and Yoneyama1987 (average of 2.17‰) ; Sutoh et al., Reference Sutoh, Obara and Yoneyama1993 (average of 3.29‰)), but not with in vitro assays (Wattiaux and Reed, Reference Wattiaux and Reed1995 (rumen bacteria depleted in 15N relative to substrates)). Isotopic N fractionation in bacteria may occur during assimilation, synthesis, transfer and excretion of N compounds (Macko et al., Reference Macko, Fogel, Hare and Hoering1987). However, fractionation during AA assimilation seemed minimal in pure culture bacteria (Macko and Estep, Reference Macko and Estep1984) and mixed cultures of rumen bacteria (Wattiaux and Reed, Reference Wattiaux and Reed1995). On the other hand, a large isotopic N fractionation has been reported during ammonia uptake by rumen bacteria and to a lesser extent during ammonia production (Wattiaux and Reed, Reference Wattiaux and Reed1995).
Ammonia is the primary N source of rumen bacteria (Cotta and Russell, Reference Codron, Sponheimer, Codron, Hammer, Tschuor, Braun, Bernasconi and Clauss1982), and bacterial enzymes involved in ammonia uptake (mainly glutamine synthetase and glutamate dehydrogenase; Wang et al., Reference Wang, Tan, Guan, Tang, Zhou, Han, Kand and He2015) and production (AA deaminases; Macko and Estep, Reference Macko and Estep1984) have been demonstrated to be highly discriminant toward N isotopes (Weiss et al., Reference Weiss, Chen, Cleland and Cook1988). This would imply a preferential uptake of 14N over 15N ammonia by rumen bacteria to synthesize their own proteins (Wattiaux and Reed, Reference Wattiaux and Reed1995) and a preferential release of 14N over 15N ammonia during AA deamination and catabolism. In this scenario, 15N enrichment of rumen bacteria relative to diet would only occur if ammonia production from AA catabolism were much higher than bacteria ammonia uptake. In fact, in most ruminant feeding situations the ammonia dynamics would probably lean toward ammonia production from protein catabolism v. ammonia incorporation into microbial cells (Nolan and Leng, Reference Nolan and Leng1972), which may explain why rumen bacteria are generally enriched in 15N relative to diet (Sutoh et al., Reference Sutoh, Koyama and Yoneyama1987 and Reference Sutoh, Obara and Yoneyama1993). However, as the percentage of rumen ammonia N taken up by rumen bacteria increases and the ammonia production by rumen bacteria decreases (i.e. improvement in rumen N efficiency), the rumen ammonia pool becomes smaller and 15N enriched (Sutoh et al., Reference Sutoh, Obara and Yoneyama1993; Wattiaux and Reed, Reference Wattiaux and Reed1995), whereas that of rumen bacteria becomes larger and more 15N depleted (Wattiaux and Reed, Reference Wattiaux and Reed1995). This brought us to hypothesize that the 15N enrichment of rumen bacteria relative to diet might reflect the ENU at the rumen level. Unfortunately, the present results did not allow testing of this. The 15N enrichment of rumen bacteria relative to diet was not correlated with rumen N efficiency, despite a significant but modest relationship between Δ15N measured in SAB and rumen ammonia concentration. The lack of relationship between Δ15N of rumen bacteria (LAB or SAB) and rumen N efficiency (g bacterial N/g available N; Bach et al., Reference Bach, Calsamiglia and Stern2005) observed in our experiment may be owing to the way the rumen N efficiency was estimated. As multiple variables (measured NAN, calculated microbial and theoretical endogenous N flowing to the duodenum) were used to estimate the rumen N efficiency, errors of measurement and assumptions may accumulate. Another possible explanation is that rumen available N only takes into account degradable feed N and not urea-N recycled to the rumen, which has been demonstrated to be affected by dietary CP level (Sarraseca et al., Reference Sarraseca, Milne, Metcalf and Lobley1998). As plasma urea (Sutoh et al., Reference Sutoh, Obara and Yoneyama1993; Sick et al., Reference Sick, Roos, Saggau, Haas, Meyn, Walch and Trugo1997) and therefore urine (Cheng et al., Reference Cheng, Kim, Merry and Dewhurst2011; Cantalapiedra-Hijar et al., Reference Cantalapiedra-Hijar, Ortigues-Marty, Sepchat, Agabriel, Huneau and Fouillet2015) are consistently depleted in 15N relative to diet, urea recycled to the rumen and taken up by rumen bacteria would favor both 15N depletion of rumen bacteria cells and rumen N use efficiency. Hence, the positive relationship between Δ15N of rumen bacteria and MNE found in this experiment (Figure 3a) could also be explained by the link between endogenous urea-N capture by rumen microorganisms (resulting in 15N depletion of rumen bacteria) and the AA flowing to the duodenum (Al-Dehneh et al., Reference Al-Dehneh, Huber, Wanderley, Theurer, Pessarakli and DeYoung1997). Finally, the relatively low variability of rumen N efficiency estimated here (CV=17%; data not shown) was probably not large enough to detect correlations with other measured variables. This low variability in rumen N efficiency was, however, compatible with a similar rumen fermentable OM across dietary treatments (Fanchone et al., Reference Fanchone, Nozière, Portelli, Duriot, Largeau and Doreau2013).
Our consistently higher δ 15N values in SAB v. LAB obtained from the same animal might result from a different N metabolism between these two bacteria groups. SAB mostly comprise bacteria attached to particles, especially fiber, and this fraction is richer in cellulolytic species than LAB (Michalet-Doreau et al., Reference Michalet-Doreau, Fernandez, Peyron, Millet and Fonty2001). Microbes degrading structural carbohydrate (cellulolytic) use ammonia N as their main N source and so may fractionate N isotopes to a greater extent than microorganisms degrading non-structural carbohydrate (amylolytic), which use ammonia, peptides and AA as N sources (Russell et al., Reference Russell, O’connor, Fox, Van Soest and Sniffen1992). In this respect, despite a close correlation between the two rumen bacteria fractions (r=0.82), the expected negative relationship between rumen ammonia concentration and δ 15N values of rumen bacteria (Wattiaux and Reed, Reference Wattiaux and Reed1995) was only significant for SAB. Finally, it is important to note that the sample extracted in SAB is considered as representing the total attached microbial population (Martin et al., Reference Martin, Williams and Michalet-Doreau1994), and not exclusively composed of bacteria. As rumen protozoa show higher δ 15N values than rumen bacteria (Sutoh et al., Reference Sutoh, Koyama and Yoneyama1987), compatible with a classical diet eater isotopic relation (trophic shift), an increase in δ 15N of SAB may arise from a small contribution of protozoa to this fraction.
Isotopic fractionation in duodenal digesta and feces
In ruminants, NAN flowing to the small intestine has three different origins (microbial, rumen non-degraded feed protein and endogenous N), all contributing to the synthesis of animal proteins through the supply of digestible AA to the small intestine. Digestible AA once absorbed into the mesenteric vein become metabolically available for anabolic/catabolic purposes but nitrogenous compounds present in duodenal digesta other than AA, such as purine and pyrimidic bases, are being absorbed concurrently. Given that AA contribution to duodenal flow averaged 85% on a N basis in this experiment (Fanchone et al., Reference Fanchone, Nozière, Portelli, Duriot, Largeau and Doreau2013), and no big changes in δ 15N values were expected between duodenum and ileum (Sutoh et al., Reference Sutoh, Koyama and Yoneyama1987), δ 15N values of duodenal digesta were assumed in our conditions to be a good indicator of δ 15N values of absorbed AA. On that basis, the average metabolic contribution to the isotopic N fractionation between plasma proteins and diet (Δ15Nplasma protein-diet) was calculated at 83% ((δ 15Nplasma protein (2.41‰)−δ 15Nduodenal digesta (0.42‰))/δ 15Nplasma protein (2.41‰)), which confirms the small effect of the digestion processes, and the predominant effect of metabolism, on isotopic N fractionation between plasma proteins and diet. This is in line with previous findings using indirect approaches in dairy cows (Cantalapiedra-Hijar et al., Reference Cantalapiedra-Hijar, Ortigues-Marty, Sepchat, Agabriel, Huneau and Fouillet2015) fed diets similar to those of this experiment. Previous studies found that the liver is an important site for isotopic N fractionation (Sick et al., Reference Sick, Roos, Saggau, Haas, Meyn, Walch and Trugo1997; Cantalapiedra-Hijar et al., Reference Cantalapiedra-Hijar, Ortigues-Marty, Sepchat, Agabriel, Huneau and Fouillet2015), because hepatic enzymes involved in transamination and deamination have been shown to react preferentially with AA containing 14N over 15N (Macko et al., Reference Macko, Estep, Engel and Hare1986; Weiss et al., Reference Weiss, Chen, Cleland and Cook1988). As the measured metabolic efficiency of AA utilization (milk CP yield/apparently digested AA in the small intestine) was quite variable in our study (CV=40%), a large variation in liver AA catabolism and thus in AA transamination/deamination was expected to cause differences in isotopic N fractionation. Sutoh et al. (Reference Sutoh, Koyama and Yoneyama1987) pointed out that because similar Δ15N values were observed in plasma between cattle and pigs, changes in natural 15N abundances during digestion processes could be of similar magnitude between ruminant and monogastric species. The unexpectedly low Δ15N values found in duodenal digesta in the present experiment (mean value=0.42) compared with others (Sutoh et al., Reference Sutoh, Koyama and Yoneyama1987 (Δ15N values>3.5‰)) was however consistent with the theoretical Δ15N values of duodenal digested (mean value=0.57) calculated from the contributions of the three origins of duodenal N flow and their respective δ 15N values (see Material and methods section for details).
Fecal N results from the excretion of undigested feed N, undigested microbial N and endogenous N. Feces from ruminants usually have higher δ 15N values than the diet (approximately 3‰ to 4‰; Sutoh et al., Reference Sutoh, Koyama and Yoneyama1987; Cheng et al., Reference Cheng, Kim, Merry and Dewhurst2011; Codron et al., Reference Cotta and Russell2012). As animal tissues are enriched in 15N relative to diet, it is reasonable to expect that animal secretions into the small intestine may add to the indigestible N as it flows through the intestine. Moreover, microorganisms fermenting the non-digestible OM in the hindgut could further contribute to the 15N enrichment of feces as occurs for N leaving the rumen. A decline in δ 15N values from small intestine content to feces has, however, been previously reported (Sutoh et al., Reference Sutoh, Koyama and Yoneyama1987), but the increase or decrease in feces relative to intestinal content may depend on diet type (Codron et al., Reference Cotta and Russell2012). However, changes in δ 15N values across the hindgut would not affect Δ15Nplasma protein-diet because no AA absorption occurs at this level. As it may reflect both digestive and metabolic (through endogenous secretions) isotopic N fractionation and it is easy to sample, fecal content could be a useful pool for practical conditions.
Relationship between isotopic N fractionation and ENU
Our conclusion pointing to a relatively low impact of digestion on the isotopic N fractionation of animal proteins may apply only to diets not exceeding recommended protein levels, where individual variations in MNE may be driven mostly by the partitioning of absorbed AA.
In our conditions, 60% of N intake, on average, was used to supply a useful N source (MP) to the animal with small variations between individuals (CV=13%). On the other hand, only 46% of that MP supply was, on average, used for milk protein yield with higher variations between individuals (CV=41%). It is noteworthy that this wide variation in the metabolic ENU (milk CP/MP supply) explained >50% of the variation in MNE (milk CP/CP intake; mean value=0.27) with, however, no significant relationship between digestive (or rumen) N efficiency and MNE. The low contribution of digestion to variation in MNE found in our study may mostly result from using diets not exceeding recommended protein levels (rumen protein balance ranging from −14.6 to 10.6 g CP/kg DMI (Fanchone et al., Reference Fanchone, Nozière, Portelli, Duriot, Largeau and Doreau2013)), and thus leading to a minimal wastage of N at the rumen level (Tamminga, Reference Tamminga1992; INRA, 2007). When theoretical minimal N losses were estimated for dairy cows (Dijkstra et al., Reference Dijkstra, Reynolds, Kebreab, Bannink, Ellis, France and Van Vuuren2013), metabolism (including urinary loss of rumen microbial nucleic acids) contributed (0.53) as much as digestion (0.47) to the calculated maximum MNE in that study, underlining the importance of metabolism in the overall ENU when diets are well formulated. In our conditions, the digestive and metabolic efficiencies of N use were negatively correlated, which is by construction (see Material and methods section for calculations) the consequence of comparing individuals fed similar N levels. This relationship was not disturbed by the use of different N levels in our study, probably because factors affecting the ENU at these two levels are different (i.e. balance between degradable N and energy available for microbial synthesis v. balance between MP requirements and MP supply).
The weaker correlation (r 2=0.29) between Δ15N and MNE found by Cabrita et al. (Reference Cabrita, Fonseca and Dewhurst2014) in dairy cows fed diets differing mainly in the amount and quality of rumen degradable protein compared with that (r 2=0.83) found by Cheng et al. (Reference Cheng, Sheahan, Gibbs, Rius, Kay, Meier, Edwards and Roche2013) was ascribed to a high contribution of rumen N efficiency, in contrast to liver metabolism, to MNE. That is, a strong relationship between MNE and this isotopic marker would be evident provided that metabolism contributes to a high proportion of this overall N efficiency. Present results argue for the metabolism being the most important factor contributing to the relationship between Δ15N and MNE. When ruminants were fed diets high in rumen degradable N (80% of silage in the ration) the relationship between Δ15N and MNE was not confirmed (Cheng et al., Reference Cheng, Kim, Merry and Dewhurst2011), suggesting that high N wastage at ruminal level could result in unpredictable Δ15N values. However, the same authors also using diets with high levels of rumen degradable N observed a strong relationship between Δ15N and MNE in another trial (Cheng et al., Reference Cheng, Sheahan, Gibbs, Rius, Kay, Meier, Edwards and Roche2013), suggesting that a predominant contribution of rumen digestion to the relationship between Δ15N and MNE when feeding high rumen degradable N diets cannot be excluded.
Conclusions
This study makes two important points. First, when using diets not exceeding recommended protein levels, the contribution of rumen bacteria and digestion to the isotopic N fractionation of animal proteins relative to diets (Δ15Nplasma protein-diet) is low. In our conditions, most of the isotopic N fractionation could have a metabolic origin (estimated at about 80%). Second, the isotopic N fractionation of rumen bacteria was not found to be related to the ENU at the rumen as hypothesized, probably owing to small variations and inaccuracy in calculations. Further studies are now needed to evaluate the contribution of digestion v. metabolism to the isotopic N fractionation when using high N diets.
Acknowledgments
The authors thank the Commission of the European Communities (Brussels, Belgium; project FP7-KBBE-2007-1 ‘Rednex’) and INRA’s Phase division (CI-Phase ‘Emergence’ 2013) for financial support. The authors thank J. Portelli, V. Largeau and N. Khodorova for technical assistance.