





The gut microbiome plays a critical role in human health via diverse mechanisms, including food digestion, the production of SCFA and other health-associated metabolites, maintenance of gastrointestinal health and the regulation of immune function(Reference Valdes, Walter and Segal1,Reference Zmora, Suez and Elinav2) . Consequently, the gut microbiome represents an attractive target for interventions seeking to improve health.
The gut microbiome is shaped largely by environmental and lifestyle factors(Reference Rothschild, Weissbrod and Barkan3). Diet is an influential modulator of the gut microbiome through provision of substrates required for microbial proliferation. The adoption of a healthy dietary pattern such as the Mediterranean diet (MedDiet) – rich in fruit and vegetables, nuts, fish, pulses and olive oil – has been proposed as a potential strategy to favourably alter gut microbiome composition and, consequently, health. For example, in the NU-AGE project, which is one of the largest studies of its kind to date (n 612), higher adherence to a MedDiet increased the abundance of specific bacterial taxa (e.g., Faecalibacterium prausnitzii, Eubacterium spp. and Roseburia spp.) that were associated with lower inflammation, a reduced risk of frailty and improved cognitive function(Reference Ghosh, Rampelli and Jeffery4). However, several other studies have reported limited or inconsistent effects of a MedDiet intervention on the gut microbiome(Reference Kimble, Gouinguenet and Ashor5). These discrepancies may relate to methodological differences between studies, including differences in the nature of the intervention, and highlight the need for further research into the effects of this dietary pattern on the gut microbiome.
Regular physical activity (PA) has been associated with greater diversity of the gut microbiome and increased relative abundance of health-related bacteria, such as those which produce short-chain fatty acids (e.g., Faecalibacterium prausnitzii and Roseburia hominis)(Reference Mailing, Allen and Buford6). Potential mechanisms underpinning these effects include modulation of immune cells in the gut, altered gut barrier function, increased gut motility and changes in the bile acid pool(Reference Mailing, Allen and Buford6).
As diet and PA influence the gut microbiome, at least in part, through different mechanisms, it is possible they may have additive effects on the gut microbiome. However, few studies to date have explored the effects of combined diet and PA interventions on the composition and metabolism of the gut microbiome(Reference Cheng, Wang and Le7,Reference García-Gavilán, Atzeni and Babio8) . Therefore, using data from the recently completed 24-week MedEx-UK randomised controlled trial(Reference Jennings, Shannon and Gillings9), we aimed to explore the impact of a MedDiet intervention alone, or in addition to increased PA, on the composition and selected metabolites of the gut microbiome.
Methods
Registration and ethical approval
MedEx-UK (ClinicalTrials registration: NCT03673722; https://clinicaltrials.gov/study/NCT03673722) was a 24-week randomised controlled trial conducted at three sites in the UK (University of East Anglia [UEA], Newcastle University, University of Birmingham) between March 2019 and September 2020. The study was conducted according to the guidelines laid down in the Declaration of Helsinki, and all procedures involving human subjects/patients were approved by the National Research Ethics Committee Northern Ireland (18/NI/0191). Written informed consent was obtained from all participants. Data, analytic code and other study materials may be obtained by contacting the study authors.
Participants and study design
MedEx-UK focused on the feasibility, acceptability and cognitive effects of a MedDiet alone or in addition to increased PA. The protocol for the study including details on patient and public involvement and adaptations made due to the COVID-19 pandemic(Reference Shannon, Lee and Bundy10) and the primary results(Reference Jennings, Shannon and Gillings9) have been published elsewhere. This study reports data on the effects of the MedEx-UK intervention on the gut microbiome and selected metabolites in a sub-sample of participants who provided faecal samples before and after the intervention. Participants were aged 55–74 years and had a QRISK2 score ≥10 (reflecting a ≥ 10 % risk of having a cardiovascular event in the next 10 years). Participants had a baseline MedDiet adherence score on the Mediterranean diet adherence screener (MEDAS) scale(Reference Schröder, Fitó and Estruch11) of <9 out of 14 and self-reported PA levels <90 min/week self-reported moderate intensity PA (see ‘Diet and PA assessment’ for further details). In addition, participants were required to be free from mild cognitive impairment, dementia or other severe neuropsychological complaints and to have normal cognitive function, as reflected by a Montreal Cognitive Assessment score ≥23(Reference Carson, Leach and Murphy12). Full details of the inclusion/exclusion criteria can be found elsewhere(Reference Shannon, Lee and Bundy10).
Intervention
Participants were randomised to one of three parallel arms for 24 weeks: (1) Control, (2) MedDiet and (3) MedDiet + PA. The control group was given publicly available diet and PA advice (leaflets from the British Heart Foundation and links to relevant National Health Service websites). They attended a single, one-hour group session during which they received a presentation on the importance of control groups in research, and they received shopping vouchers (£240) at the end of the study for their participation. Meanwhile, the intervention arms were provided with personalised behaviour change support via group sessions led by a trained facilitator, a web-based intervention platform (LEAP2), and the provision of £30/week shopping vouchers to support food purchasing or delivery. Intervention participants were invited to attend four group sessions at weeks 0, 2, 4 and 12. These sessions were informed by the COM-B model and evidence-based behaviour change techniques(Reference Michie, van Stralen and West13,Reference Michie, Wood and Johnston14) and supported goal setting, action planning, problem-solving and maintenance of behaviour change. Trained facilitators delivered the sessions. The group sessions were complemented by the LEAP2 web-based intervention platform. LEAP2 included a diet focused module (‘Eating Well’), which provided participants with feedback on their MEDAS score, identified MedDiet goals already being met and supported selection of additional dietary goals based on current dietary/food preferences. The MedDiet + PA group also had access to a PA focused module (‘Moving More’), which supported participants to assess their PA levels, set weekly activity goals and receive tailored suggestions based on preferences. Participants in the MedDiet and MedDiet + PA groups were encouraged to use the weekly shopping vouchers to purchase foods contributing towards their MedDiet targets. Participants were encouraged to improve their MEDAS score by a minimum of three points and to increase their PA levels to 150 min/week moderate or 75 min/week vigorous, activity. Participants self-selected which dietary components to focus on in order to increase their MEDAS scores and also self-selected their preferred PA modalities, allowing personalisation around individual preferences.
Dietary and physical activity assessments
Adherence to the MedDiet was determined during screening and pre- and post-intervention using an online version of the MEDAS questionnaire (our primary dietary outcome measure(Reference Shannon, Lee and Bundy10)). This tool captures information on current habitual dietary intake using daily and weekly intake thresholds for key MedDiet components, with scores between 0 and 14 awarded depending on level of adherence this dietary pattern (higher scores = greater adherence)(Reference Schröder, Fitó and Estruch11). Dietary data were also collected using repeated 24 h recalls (Intake24)(Reference Foster, Lee and Imamura15) at baseline and week 24, although these data were not available in all participants. The present analysis therefore focused on the MEDAS questionnaire dietary data to avoid further restricting sample size. PA levels were assessed via the International Physical Activity Questionnaire(Reference Craig, Marshall and Sjöström16) for screening purposes. PA levels were also recorded pre and throughout the entire intervention period using a wrist-worn activity tracker (Vivosmart 3, Garmin). Moderate intensity PA minutes were calculated as: moderate minutes (40–59 % heart rate reserve) + (vigorous minutes (≥ 60 % heart rate reserve)*2)(17).
Faecal sample collection and storage
Faecal samples were obtained by participants at home using a commercially available collection kit (EasySampler, GP Medical Devices) prior to the study baseline and endpoint assessments. Stool samples were stored in untreated, airtight plastic containers and were refrigerated prior to transfer to a study researcher, after which they were frozen at −80 °C (within 24 h of collection). Samples from our study sites at the University of Birmingham and UEA were transferred to Newcastle University on dry ice and then stored at −80 °C. Frozen stool samples were thawed once and subsequently aliquoted for microbiome, SCFA and metabolomic analyses. Samples allocated for microbiome analysis were homogenised by vortex mixing in standard aerobic laboratory conditions, immediately prior to DNA extraction. Samples for SCFA and metabolomic analyses were refrozen prior to shipping on dry ice to the University of Glasgow and University of Aberdeen, respectively.
DNA extraction and sequencing
DNA was extracted from the faecal samples using the DNeasy PowerLyzer PowerSoil Kit (Qiagen, Germany) following the manufacturer’s instructions. Targeted sequencing of the V4 region of the 16S rRNA gene was performed by NU-OMICS (Northumbria University, Newcastle upon Tyne, UK) on the Illumina MiSeq platform using V3 2x250 chemistry and primers 515f and 806r(Reference Kozich, Westcott and Baxter18,Reference Walters, Hyde and Berg-Lyons19) . One positive (Zymobiomics Microbial Mock community DNA standard) and one negative control sample were included with samples. Paired-end fastq files were merged, quality filtered and aligned to the SILVA reference database (v132) using Mothur (v1.48)(Reference Schloss, Westcott and Ryabin20,Reference Quast, Pruesse and Yilmaz21) . Chimeric and non-bacterial sequences were removed before clustering remaining reads into operational taxonomic units at 97 % similarity then annotated taxonomically with the RDP database (v18)(Reference Cole, Wang and Fish22) for downstream analysis. After taxonomic annotation, rarefaction was performed to adjust for differences in sequencing depth across samples. Rarefaction curves were examined to assess sequencing saturation, and a rarefaction depth of 17 800 reads was selected. This threshold captured the plateau of the Shannon diversity rarefaction curve and ensured the removal of all kit negative controls (Supplementary Figure 1).
Impact of the MedDiet and PA interventions on gut microbiome diversity, composition and metabolite profiles among participants in the MedEx-UK study (n 47). There were no significant between-group differences in changes in α-diversity from pre- to post-intervention (A), in overall microbial community composition post-intervention (B), or in the rarefied abundance of bacterial taxa post-intervention (C). Where the family name is presented, this was unclassified at the genus level. Similarly, no significant differences were observed in NMR metabolite (D) or bile acid (E) profiles at the study endpoint. PA, physical activity.

Figure 1. Long description
Panel A: A box plot shows the changes in Shannon diversity (Δ Shannon diversity) among three groups: Control, MD, and MD-PA. The y-axis represents the change in Shannon diversity, and the x-axis lists the groups. Panel B: A scatter plot with ellipses represents the overall microbial community composition post-intervention. The axes are labeled Axis.1 and Axis.2, with percentages indicating the variance explained. Different colors represent Control, MD, and MD-PA groups. Panel C: A box plot displays the rarefied abundance of various bacterial taxa post-intervention. The y-axis shows rarefied abundance, and the x-axis lists different bacterial taxa. Panel D: A scatter plot with ellipses shows the NMR metabolite profiles at the study endpoint. The axes are labeled MDS1 and MDS2. Different colors represent Control, MD, and MD-PA groups. Panel E: A scatter plot with ellipses depicts the bile acid profiles at the study endpoint. The axes are labeled MDS1 and MDS2. Different colors represent Control, MD, and MD-PA groups.
Metabolite extraction and analysis
Faecal metabolites were extracted using established protocols for NMR spectroscopy and liquid chromatography-MS analysis. For1H NMR spectroscopy, metabolites (for list, see Supplementary Table 1) were extracted from 150 mg aliquots of faecal samples using a methanol–chloroform–water (2:2:1) method. Aqueous fractions were dried, reconstituted in D2O with internal standard and analysed on a 600 MHz NMR spectrometer using solvent suppression pulse sequences(Reference Jenkins, Formenti and Castro23). Spectra were processed using TopSpin, and metabolite identification was conducted using the Chenomx spectral database (Chenomx). For the analysis of bile acids, metabolites were extracted from 50 mg faecal aliquots using methanol with ammonium formate, followed by solid-phase extraction cleanup. liquid chromatography-MS analysis was conducted using UPLC coupled with triple quadrupole mass spectrometry using a multiple reaction monitoring approach. Separation was achieved on a C18 UPLC column using a water–methanol/acetonitrile gradient, with electrospray ionisation in negative mode and internal standard normalisation for quantification(Reference Han, Liu and Wang24). Further details of the methods are provided in Supplementary Text 1.
Faecal SCFA analyses
Faecal SCFA concentrations were quantified via GC equipped with a flame ionisation detector as described by Svolos et al.(Reference Svolos, Hansen and Nichols25). Results were presented per gram of dry mass of faecal material (µmol/g).
Statistical analyses
Statistical analyses and data visualisation were conducted using R v4.1.3. Impact of the intervention on MedDiet scores and PA levels (at week 24) was evaluated using ANCOVA, conducted using the car (Reference Fox and Weisberg26) and emmeans (Reference Lenth, Banfai and Bolker27) packages, adjusting for pre-intervention values, baseline BMI and study site. Covariate adjustment strategy across analyses was consistent with that adopted in the analysis of the main outcomes of the MedEx-UK study(Reference Jennings, Shannon and Gillings9). The inclusion of baseline BMI – a pre-randomisation prognostic factor with an established role as a determinant of gut microbiome structure – improves the precision of the estimated intervention effect by accounting for within-group variability(Reference Streiner28). Study site was included as a covariate to control for potential operational or environmental confounding. Shannon diversity was calculated using the vegan package v2.5-7 (https://CRAN.R-project.org/package=vegan). A linear model was fitted to the change in Shannon diversity pre-to-post study to evaluate the impact of intervention groups, whilst adjusting for baseline BMI and study site. The same model was fitted to the calculated Shannon diversity at baseline only, to evaluate the impact of level of adherence to the MedDiet (high [>6 points] v. low [≤6 points] adherence, which was determined by the group median MEDAS score). Principle coordinate analysis based on weighted UniFrac distances of the microbiome data was performed using the phyloseq package v1.38.0(Reference McMurdie and Holmes29). For the metabolite data, a non-metric multidimensional scaling plot was produced based on Bray–Curtis dissimilarity (as metabolite data was proportional) using the vegan package. P values were based on permutational analysis of variance using the ‘adonis’ function from the vegan package. Homogeneity of group dispersions was assessed using the ‘betadisper’ function from the vegan package and showed no evidence of differences between groups. Partial least squares discriminant analysis and orthogonal partial least squares discriminant analysis were applied to scaled metabolite, SCFA and bile acid data at the endpoint to assess group separation, complementing the unsupervised ordination approaches. The Maaslin2 package v1.2.0(Reference Mallick, Rahnavard and McIver30) was used to investigate associations between the relative abundance of specific taxa and intervention/timepoint. Relative abundance data were transformed using arcsine square-root transformation, and P values were adjusted for multiple testing using the Benjamini Hochberg false discovery rate procedure. Post-intervention total and individual SCFA concentrations were compared between groups using ANCOVA, conducted using the car (Reference Fox and Weisberg26) and emmeans (Reference Lenth, Banfai and Bolker27) packages, controlling for pre-intervention values, baseline BMI and study site. Exploratory cross-sectional analyses were undertaken using baseline samples only to investigate whether higher v. lower habitual MedDiet adherence, or adherence to individual MedDiet components, was associated with gut microbiome composition or faecal metabolite profiles. These exploratory analyses focused on diet because MedDiet adherence was the principal behavioural exposure of interest for the microbiome-specific analyses and was the main behavioural change achieved in this sub-study. Baseline samples were used to maximise the available sample size and to examine dietary pattern before intervention-related dietary change. The sample size for the MedEx-UK intervention study was determined based on the number of participants required to detect a three-point change in MEDAS score, with 90 % power and 5 % error. It revealed that ninety participants (thirty per study arm) was required. This was increased to 108 participants to allow for 20 % subject drop out. The sample size for this secondary analysis was determined based on sample availability.
Results
The primary analyses, exploring the impact of the MedEx-UK interventions on the gut microbiome and associated metabolites, included data from forty-seven participants (Control: 13 female/2 male; MedDiet: 13 female/2 male and MedDiet + PA: 16 female/1 male) for whom paired pre- and post-intervention samples were available. At baseline, participants reported stable use of various medications including metformin by 1, 1 and 0 participants; calcium channel blockers by 3, 5 and 3 participants; proton pump inhibitors by 2, 5 and 6 participants and statins by 5, 8 and 2 participants in the control, MedDiet and MedDiet + PA groups, respectively. There were no significant differences in participant characteristics at baseline between the three study arms (Table 1; all P > 0·05). Secondary analyses, exploring associations between the level and nature of habitual adherence to the MedDiet, used baseline data only from ninety-three participants. Supplementary Table 2 shows that the characteristics at baseline for this subset (n 93) are comparable to those of the whole MedEx-UK cohort (n 104). A CONSORT flow chart of eligible participants can be found in Supplementary Figure 2. Similar to the findings from the overall MedEx-UK study (n 104(Reference Jennings, Shannon and Gillings9)), in the sub-set of participants used for our primary analyses, the intervention was effective at increasing MedDiet adherence, with the adjusted means for the post-intervention MEDAS scores ∼4 points higher in the MedDiet (Adj.mean difference: 3·94, 95 % CI: 2·15–5·73, p < 0·001), and MedDiet + PA (Adj.mean difference: 3·86, 95 % CI: 2·11–5·62, p < 0·001) conditions v. control, with no difference between the two intervention arms (MedDiet + PA v. MedDiet Adj.mean difference: –0·08, 95 % CI: –1·86 to 1·71, p = 0·99). Although PA levels appeared to increase numerically in the MedDiet + PA group and decrease in the control and MedDiet groups, variability was large and the between-group comparison revealed that PA was not significantly impacted by the intervention (p for between-group comparison = 0·17, Table 1).
Participant characteristics for the primary analyses (n 47) exploring impact of the MedEx-UK intervention on the gut microbiome and associated metabolites

Table 1. Long description
A table comparing participant characteristics across three groups: Control, MedDiet, and MedDiet + PA. The table has 11 rows and 7 columns. Column headers are Control (n 15), MedDiet (n 15), and MedDiet + PA (n 17), each with Mean and SD subheaders. Row labels include Age, BMI, QRISK2 score, MEDAS score Pre and Post, and Moderate activity Pre and Post. Row 1: Age, years, Control Mean 66.2, SD 4.7; MedDiet Mean 67.5, SD 3.9; MedDiet + PA Mean 69.9, SD 4.2. Row 2: BMI, kg/m2, Control Mean 28.1, SD 4.1; MedDiet Mean 29.2, SD 4.8; MedDiet + PA Mean 27.9, SD 4.1. Row 3: QRISK2 score, Control Mean 16.2, SD 5.4; MedDiet Mean 17.1, SD 5.1; MedDiet + PA Mean 16.6, SD 4.2. Row 4: MEDAS score Pre, Control Mean 6.6, SD 1.9; MedDiet Mean 5.9, SD 2.4; MedDiet + PA Mean 6.7, SD 2.2. Row 5: MEDAS score Post, Control Mean 6.9, SD 2.0; MedDiet Mean 10.6, SD 2.2; MedDiet + PA Mean 10.9, SD 1.9. Row 6: Moderate activity Pre, min/wk, Control Mean 193.4, SD 233.5; MedDiet Mean 284.6, SD 197.9; MedDiet + PA Mean 169.6, SD 135.0. Row 7: Moderate activity Post, min/wk, Control Mean 150.8, SD 96.3; MedDiet Mean 258.0, SD 190.4; MedDiet + PA Mean 207.5, SD 136.3.
MEDAS = Mediterranean Diet Adherence Screener. QRISK2 = estimated risk of developing CVD in the next 10 years.
a Baseline data are presented except for MEDAS scores and moderate intensity physical activity minutes, which are presented for pre (baseline) and post (endpoint)-intervention. QRISK2 data for n 45, MEDAS for n 44 and PA data for n 40 participants, respectively. There were no significant differences between the three groups at baseline for age, sex (displayed in text), BMI, QRISK2 score or pre-intervention MEDAS and moderate activity minutes as indicated by one-way ANOVA and χ 2 analyses.
* Indicates significantly different post-intervention MEDAS scores in the MedDiet and MedDiet + PA groups v. control, from ANCOVA controlling for pre-intervention values, BMI and study site.
Impact of MedDiet and physical activity interventions on the gut microbiome and metabolites of participants in the MedEx-UK study
Our primary analyses showed no overall impact of the MedEx-UK interventions on the gut microbiome and associated metabolites. Specifically, there was no significant difference in the pre-to-post intervention change in α diversity (Shannon index) between the three study arms (Figure 1a, p = 0·185). There was no significant difference in overall microbial community composition between the intervention arms at the study endpoint (Figure 1b, p = 0·487), nor were there any significant differences pre-to-post intervention within any of the trial arms (all p > 0·05). Maaslin2 analysis showed that the relative abundance of specific genera was not changed significantly by any of the trial arms post-intervention whilst controlling for baseline BMI and study site (Figure 1c, all p > 0·05). Similarly, there were no pre-to-post intervention effects for any of the trial arms (all p > 0·05). Additionally, there was no significant difference in NMR metabolite profiles or bile acid profiles between the intervention arms at the study endpoint (Figure 1d and e, p = 0·280 and p = 0·677, respectively), nor were there any pre-to-post intervention differences for any of the trial arms (all p > 0·05). Similarly, supervised multivariate analyses (partial least squares discriminant analysis and orthogonal partial least squares discriminant analysis) did not show significant between intervention group differences for metabolite, SCFA, or bile acid data at the end of intervention. This remained true when comparing control with both intervention groups combined (all p > 0·05; Supplementary Figure 3). Total and individual faecal SCFA concentrations post-intervention were not significantly different between study arms (all p > 0·05, Supplementary Table 3).
Impact of level and nature of adherence to the MedDiet
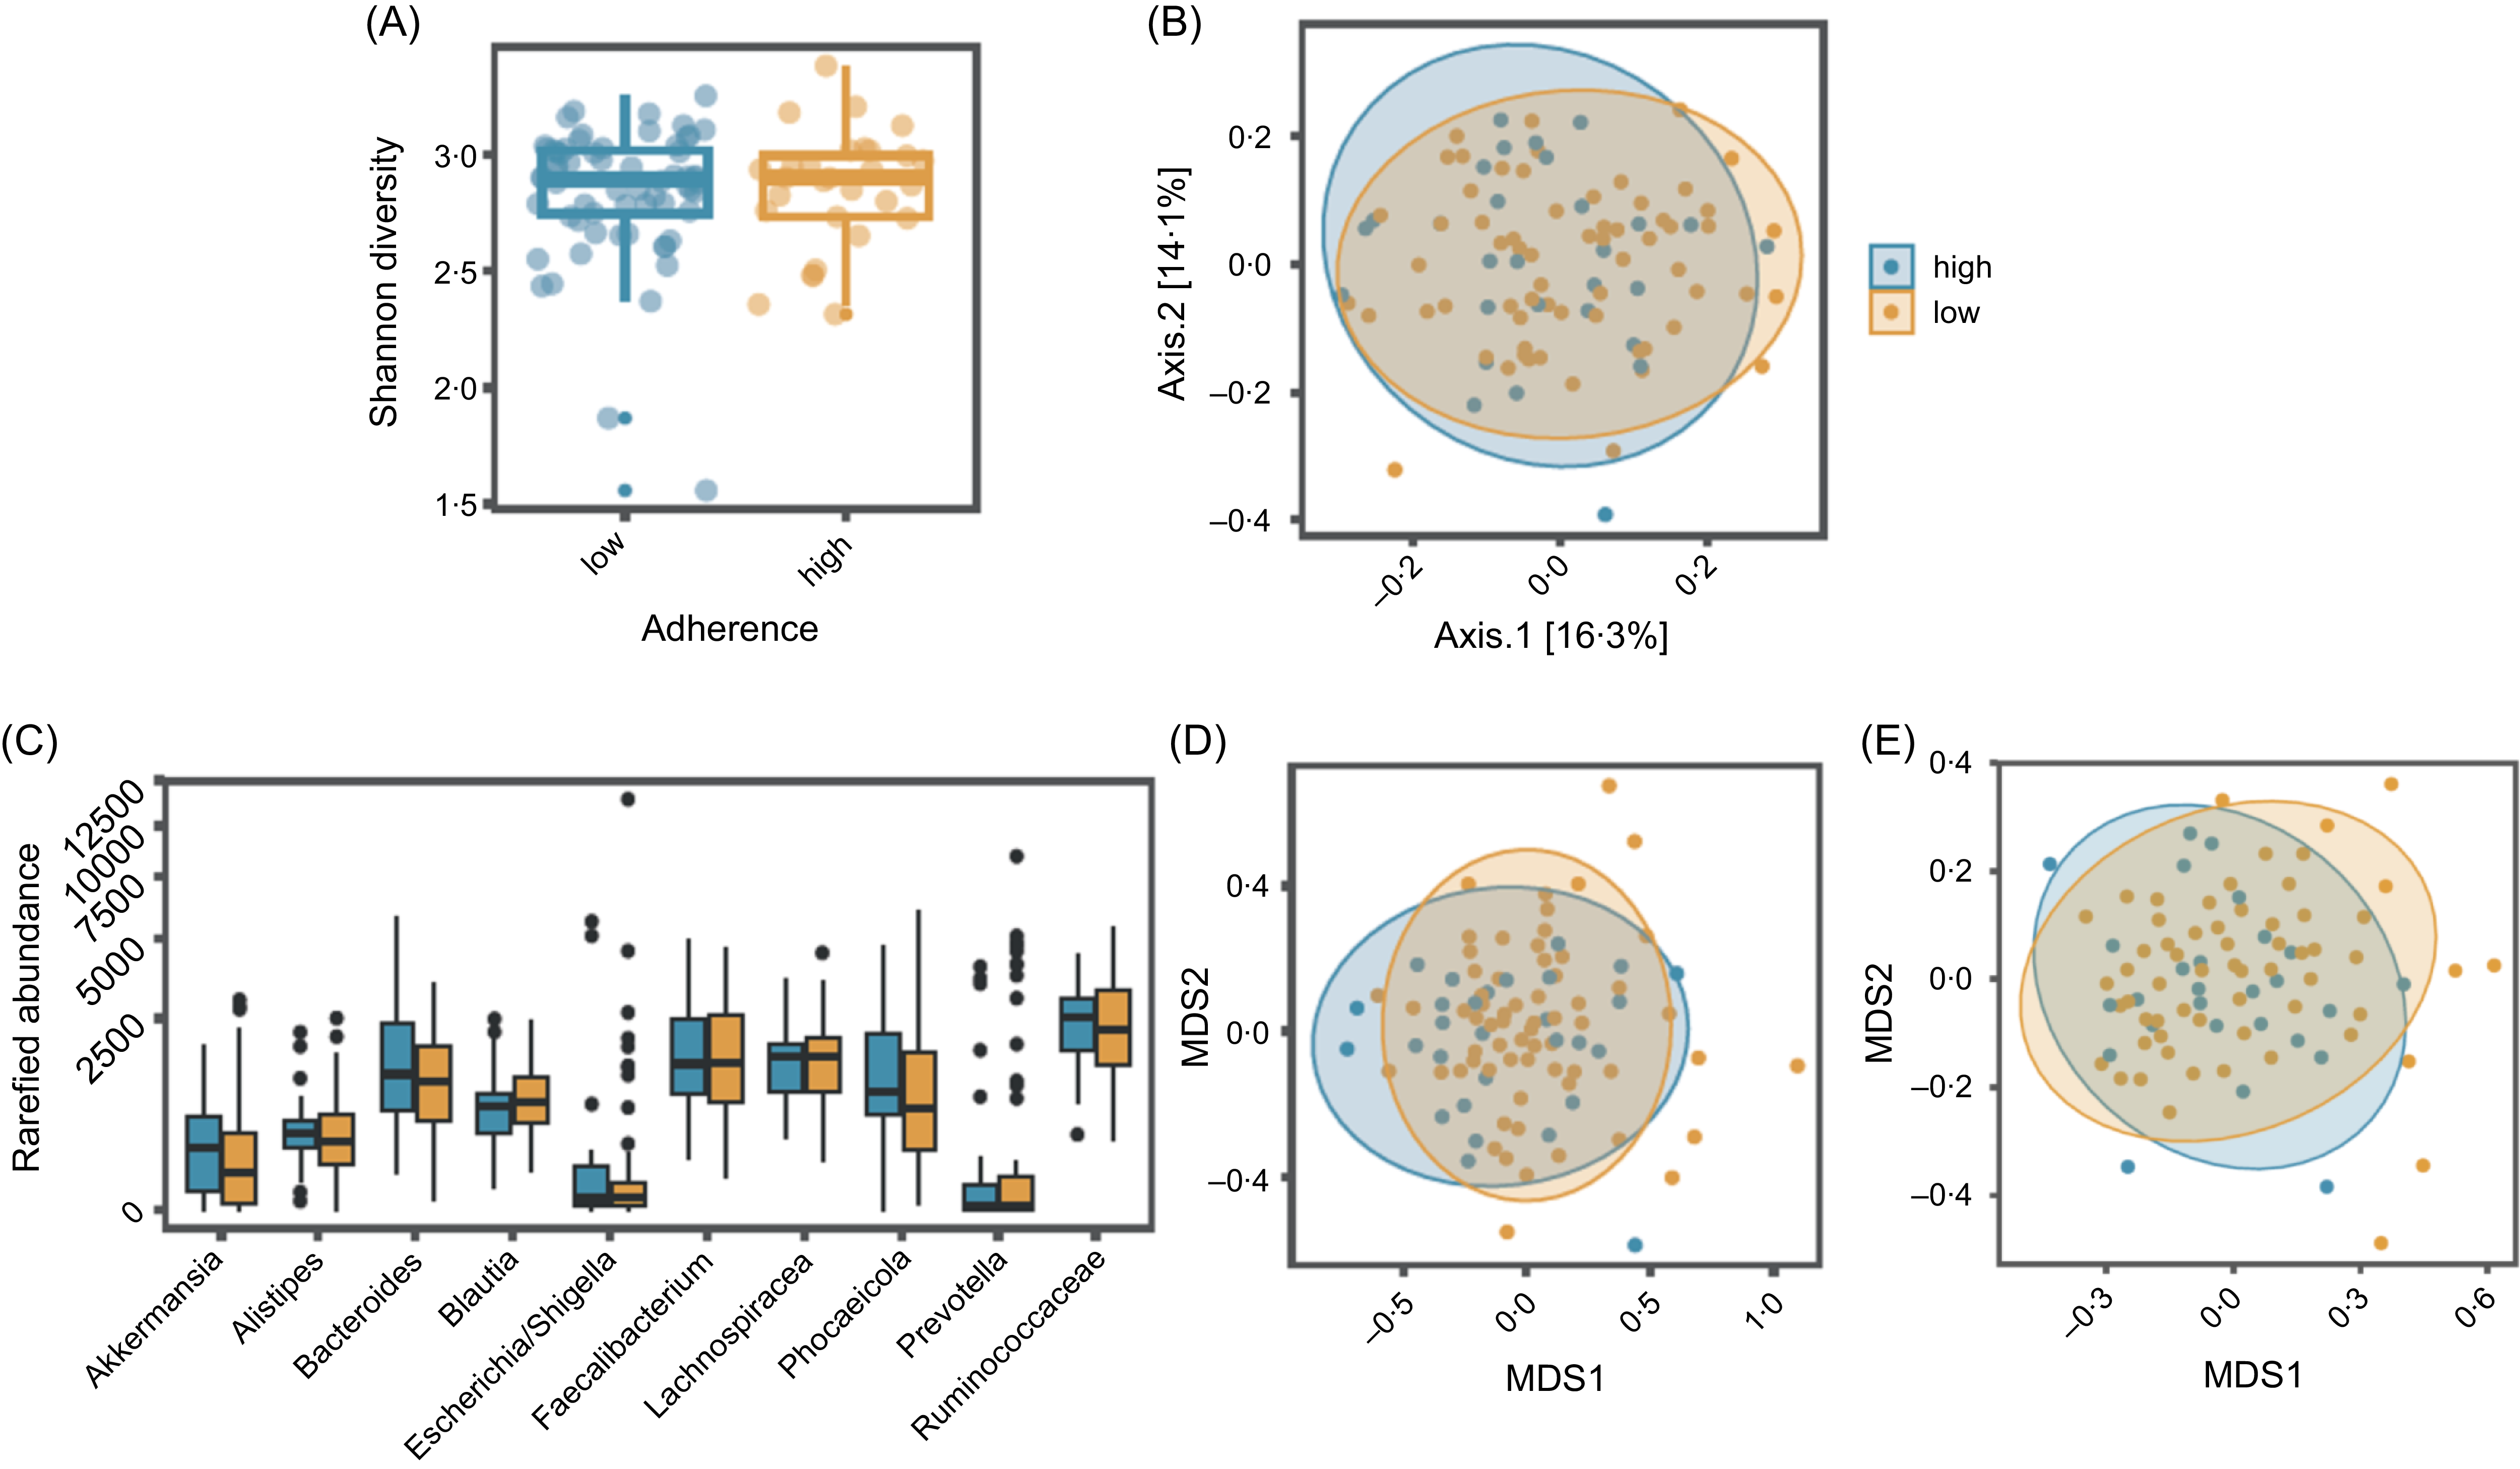
In our secondary analyses, we sought to investigate whether level of adherence to the MedDiet (which varied notably within and between groups at baseline) was associated with the overall gut microbiome profile (β-diversity) by categorising our samples into individuals with higher and lower MEDAS scores. These analyses were restricted to the baseline measurement point to maximise sample size (n 93). We found no significant difference in Shannon diversity (Figure 2a, p = 0·544) or overall microbial composition between those with higher or lower adherence to the MedDiet (Figure 2b, p = 0·711). Maaslin2 analysis revealed no taxonomic features that were significantly associated with higher or lower adherence whilst controlling for baseline BMI and study site (Figure 2c, all p > 0·05). There was also no significant difference in NMR metabolite profiles or bile acid profiles between those with higher or lower adherence (Figure 2d and e, p = 0·522 and p = 0·988, respectively). In addition, there were no differences in SCFA concentrations between adherence groups (Supplementary Table 4).
Impact of level of adherence to the MedDiet on gut microbiome diversity, composition and metabolite profiles at baseline only (n 93). There were no significant differences in α-diversity (A), overall microbial composition (B), or rarefied abundance of bacterial taxa (C) between those with higher or lower adherence to the MedDiet. Where the family name is presented, this was unclassified at the genus level. Similarly, no significant differences were observed between NMR metabolites (D) or bile acid (E) profiles between those with higher or lower adherence at baseline.

Figure 2. Long description
Panel A: A box plot shows Shannon diversity on the y-axis and adherence levels (low and high) on the x-axis. The plot compares the diversity between low and high adherence groups, with no significant differences observed. Panel B: A scatter plot with ellipses representing confidence intervals displays Axis 1 and Axis 2 on the x and y axes, respectively. It compares overall microbial composition between high and low adherence groups, showing no significant differences. Panel C: A box plot illustrates the rarefied abundance of various bacterial taxa on the y-axis and different bacterial families on the x-axis. It compares the abundance between high and low adherence groups, with no significant differences noted. Panel D: A scatter plot with ellipses representing confidence intervals shows MDS1 and MDS2 on the x and y axes, respectively. It compares NMR metabolites between high and low adherence groups, indicating no significant differences. Panel E: A scatter plot with ellipses representing confidence intervals displays MDS1 and MDS2 on the x and y axes, respectively. It compares bile acid profiles between high and low adherence groups, showing no significant differences.
We also explored whether any individual components of the MedDiet score (e.g. whether participants were awarded a MEDAS point for consumption of fish, nuts, vegetables, etc.) were associated with the gut microbiome, again using baseline data only to maximise sample size. We found no significant difference in Shannon diversity or overall microbial composition for any of the dietary components (Supplementary Figures 4 and 5, all p > 0·05). Maaslin2 analysis revealed no features that were significantly associated with individual components of the MedDiet (Supplementary Figure 6, all p > 0·05).
Discussion
This study explored the effects of a MedDiet intervention alone or alongside an intervention designed to increase PA on the composition of the gut microbiome and faecal metabolites. We found no effects of our interventions on α-diversity, β-diversity or the relative abundance of specific bacteria. Likewise, we observed no effects on the NMR-derived faecal metabolite profile nor concentrations of the microbial-derivates SCFA and bile acids. Collectively, these null findings suggest that a MedDiet, at least under the conditions of our study, does not elicit substantial/consistent shifts in these indices. In addition, there were no differences between our MedDiet and MedDiet + PA groups. This is as expected because the intervention did not result in significant changes in PA levels. This lack of a significant increase in PA is likely due to constraints on outdoor activity and PA opportunities during the COVID-19 pandemic(Reference Elsworthy, Jong and Hanson31). The pandemic may also have influenced other behaviours and exposures relevant to the gut microbiome, including alcohol consumption, stress, medication use and sedentary behaviour(Reference Nindenshuti and Caire-Juvera32), alongside logistics of sample collection, which may have added further variability to our microbiome and metabolite outcomes.
Our findings align with most of the extant literature on MedDiet interventions and the gut microbiome. For example, Kimble et al.(Reference Kimble, Gouinguenet and Ashor5) conducted a systematic review, including seventeen randomised controlled trial and seventeen observational studies, exploring the impact of a MedDiet on the gut microbiome and associated metabolites. They observed no effect of a MedDiet intervention v. control on α or β-diversity in any of the eleven randomised controlled trial which reported these data, which is consistent with our findings here. Only one out of six of the identified randomised controlled trial, which reported data at the phylum level identified an effect of a MedDiet intervention. Specifically, a crossover study by Di Iroko et al.(Reference Di Iorio, Rocchetti and De Angelis33), which included sixty participants with chronic kidney disease, reported an increased relative abundance of Firmicutes and decreased Bacteroidetes with a MedDiet intervention v. a habitual diet control. Changes in the gut microbiome were more apparent at lower taxonomic levels (e.g. genera and species level) in the review by Kimble et al.,(Reference Kimble, Gouinguenet and Ashor5) but there was very little consistency in the pattern of change in response to MedDiet intervention between studies. Our analysis was based on 16S rRNA data, which provides useful community-level data, but it is possible that we may have missed effects of the intervention at the species or functional pathway level, which may been apparent using more advanced approaches (e.g. shotgun metagenomic sequencing).
Several other methodological factors may have contributed towards, and could explain, our null findings. A critical challenge is the large inter-individual variation in microbiome responses to dietary interventions, which can obscure group-level treatment effects. Whilst some studies have reported that gut microbial changes to dietary intervention are reproducible responses(Reference David, Maurice and Carmody34), this was not observed in our recent intervention with resistant starch and polydextrose (two different forms of dietary fibred)(Reference Malcomson, Louca and Nelson35). Such inter-individual variability in the gut microbiome response to dietary change makes it difficult to detect consistent group-level changes, particularly in studies with modest sample sizes like ours(Reference Healey, Murphy and Brough36). This challenge is illustrated by findings from two prospective cohort studies exploring associations between MedDiet adherence and gut microbiome composition in healthy adults in the USA(Reference Maskarinec, Hullar and Monroe37,Reference Wang, Nguyen and Li38) . Only the larger of the two studies (n 1735 v. 307) reported significant associations with α diversity (Reference Maskarinec, Hullar and Monroe37,Reference Wang, Nguyen and Li38) . In comparison, the MedEx-UK trial was relatively small, with faecal samples collected in a sub-set of participants only (partly due to COVID-19 lockdown restrictions during the data collection period).
The personalised nature of our intervention – a deliberate feature to address participants’ dietary preferences and increase the likelihood of achieving the behavioural targets, which is likely to enhance scalability, behaviour change and public health benefit in real world interventions(Reference Celis-Morales, Lara and Mathers39,Reference Celis-Morales, Livingstone and Marsaux40) – creates significant heterogeneity in the dietary changes made between participants and therefore likely associated heterogeneity in response. Unlike studies with pre-defined dietary protocols that are similar for all participants, such as Meslier et al.(Reference Meslier, Laiola and Roager41), who reported effects of a 2-month MedDiet intervention on abundance of key gut bacteria in eighty-two overweight/obese individuals, our participants were free to choose which foods to change to achieve a higher MEDAS score. Such personalisation means that participants could achieve the same increase in MEDAS score using many permutations of addition/removal of foods (with different types and amounts of individual foods/nutrients), which could impact differently on the gut microbiome. For example, increasing intakes of fruits, vegetables, wholegrains, nuts and pasta will increase supply of dietary fibre (the key substrate for growth of large bowel bacteria), whereas replacement of meat, eggs and dairy products with fish would have no effect on fibre intake. Future studies with larger samples of individuals with granular dietary data could examine whether specific clusters of Mediterranean diet changes are associated with distinct microbiome responses. Similarly, trials could prospectively compare different versions of Mediterranean diet interventions, such as fibre-rich v. versions focused on improving fat quality or replacing red and processed meat, to determine whether microbiome responses are driven by specific dietary features. Another relevant factor is that the day-to-day variation in dietary choices permitted by our personalised interventions may have masked treatment effects. Since the gut microbiome responds rapidly (within hours or days) to dietary change(Reference David, Maurice and Carmody34), it is likely that the specific combinations of foods consumed in the 1–2 days immediately preceding stool collection will have influenced the microbiome of each participant and so militate against the detection of overall treatment effects.
In addition to methodological considerations, the biological characteristics of the gut microbiome itself may also limit the ability to detect diet-related effects. The gut microbiome is known to exhibit resilience, often reverting to its original baseline composition despite dietary modifications. This is exemplified by a study by Fragiadakis et al.(Reference Fragiadakis, Wastyk and Robinson42), which tracked gut microbiota composition over a 12-month dietary intervention. Microbiome shifts were observed within the first 3 months. However, the gut microbiome largely returned to baseline composition for the remainder of the intervention period, even when participants maintained their dietary changes and weight loss. This suggests that transient dietary effects on the microbiome, occurring within days/weeks, may not necessarily translate into long-term alterations. This may be due to physiological homeostatic mechanisms(Reference Fragiadakis, Wastyk and Robinson42) or wider lifestyle factors which contribute towards longer-term shaping of the gut microbiome(Reference Pedroza Matute and Iyavoo43). Since we did not collect interim samples during our 6-month intervention period, we do not know whether there were any initial microbiome alterations that reverted subsequently to baseline. In the systematic review by Kimble et al.(Reference Kimble, Gouinguenet and Ashor5), no consistent differences in gut microbiome responses were observed between short-term and medium-to-longer-term MedDiet interventions. However, interpreting this comparison is challenging, given the multiple methodological differences between studies which could have masked any potential effects of study duration.
We explored whether participants who adhered to each of fourteen MedDiet components according to the MEDAS score showed differences in the gut microbiome. We also categorised participants into those with higher and lower MEDAS scores to see if the level of adherence (i.e., higher v. lower adherence), rather than group allocation, as per the primary analysis, impacted the gut microbiome and metabolome. In these cross-sectional analyses, we also found no associations between specific MedDiet components or by level of adherence to the diet and gut microbiome diversity or abundance measures. This finding is consistent with most other observational analyses, which have shown limited or inconsistent associations between level of adherence to the MedDiet and diversity or abundance of gut bacteria(Reference Kimble, Gouinguenet and Ashor5).
Our findings highlight the complexity of diet–microbiome interactions in healthy populations taking part in pragmatic, real world trials and highlight several important directions for future research. First, future research would benefit from larger sample sizes to ensure they are adequately powered to detect microbiome changes against the background of substantial inter-individual variation in response.
Second, because the gut microbiome responds rapidly to dietary change and, therefore, results in day-to-day variation in the faecal microbiome among individuals eating freely-chosen diets, repeated faecal sampling over two or more days pre- and post-intervention is likely to improve the ability to detect effects of intervention. In addition, given the inherent stability of the gut microbiome, future studies could benefit from more frequent sampling to understand better the temporal nature of any alterations in the gut microbiome and capture any transient changes that may revert to baseline. Longer-term studies using more advanced multi-omics (e.g., integrating metagenomics, metabolomics and host transcriptomics) approaches may also provide greater sensitivity for detecting subtle but potentially meaningful changes.
Third, future studies may benefit from evaluating whether certain individuals are more/less likely to experience microbiome changes in response to dietary interventions (e.g. due to differences in baseline microbial profile, genotype, background diet, broader lifestyle factors, age or by type, dose and duration of medication use). The generalisability of our study was particularly limited by including mostly female participants, and further studies with a more balanced sex distribution would be useful to improve representativeness of the findings and could help elucidate whether there are sex-specific differences in the gut microbiome response to dietary and lifestyle interventions. Such investigations would require large sample sizes to ensure these analyses are sufficiently powered but could help with developing personalised approaches and informing targeted public health strategies.
Conclusion
In this study, we did not find any effect of a 6-month MedDiet intervention alone, or alongside a PA intervention, on the composition or metabolism of the gut microbiome. We propose that the lack of overall effect of the treatments is due to multiple, interconnected factors, including 1) the complexity of individual participant dietary change achieved by this personalised intervention resulting in large inter-individual differences in gut microbiome responses relative the overall (mean) effect of the interventions; 2) the inherent stability of the gut microbiome and 3) methodological limitations of our study including the small sample size (such that the study is likely underpowered for the microbiome/metabolome analyses) and the timepoints (i.e. pre- and post-intervention only) at which our biological samples were collected. These findings underscore the challenges inherent in detecting diet-induced alterations in the gut microbiome and support the need for further, more sophisticated studies exploring the impact of the MedDiet on the gut microbiome and human health.
Supplementary material
For supplementary material/s referred to in this article, please visit https://doi.org/10.1017/S0007114526108551
Data availability statement
Data, analytic code and other study materials may be obtained by contacting the study authors.
Acknowledgements
None.
This study was conceptualised by OMS, CJS and JCM, whilst the wider MedEx-UK study was conceptualised by WH, SH, SA, MS, AMM and JCM. Funding was acquired for this analysis by OMS, CJS and JCM, with funding for the wider MedEx-UK study acquired by WH, SH, SA, MS, AMM and JCM. AMM was the PI for the MedEx-UK study. The investigation was carried out by OMS, LB, CC, AJ, RG, VL, RE, MG, TL, CB, AN, WH, SH, AN, MS, SA, BW, KG, JLG, AMM, CJS and JCM. Data analysis was carried out by LB and OMS, with LB taking a lead role. Methodology for this study was developed by OMS, LB, CC, JLG, BW, KG, CJS and JCM. JCM and CJS provided supervision. Visualisation of data was by LB. OMS and LB led the writing of the original draft, with further input from CJS and JCM. All authors contributed towards reviewing and editing of the manuscript.
This research was funded by the NIHR Newcastle Biomedical Research Centre awarded to the Newcastle upon Tyne Hospitals NHS Foundation Trust and Newcastle University. The main trial funding for MedEx-UK was from Alzheimer’s Research UK Prevention and Risk Reduction Fund (ARUK-PRRF2017-006) with additional support provided by the UK Nutrition Research Partnership (UK NRP), an initiative supported by the Medical Research Council (MRC), Biotechnology and Biological Sciences Research Council (BBSRC) and the National Institute for Health Research (NIHR) (MR/T001852/1) as part of the NuBrain Consortium work programme.
The authors declare none.




 Open access

