I. INTRODUCTION
Titanium dioxide (TiO2), a nontoxic and a low-cost material, has received significant attention of materials scientists, being extensively investigated (especially as thin films) for its unique physical and chemical properties (high oxidation power, high optical transmittance in the visible range, high refractive index, good mechanical and chemical stability in adverse environments, etc.). These remarkable properties, which make it suitable for a variety of applications (photodegradation, gas sensors, solar cells, self-cleaning, etc.Reference Quan, Zhao, Tan, Sang, Wang and Dai1–Reference Euvananont, Junin, Inpor, Limthongkul and Thanachayanont5), can be further improved by doping titania materials with various impurities. Since Matsumoto et al.Reference Matsumoto, Murakami, Shono, Hasegawa, Fukumura, Kawasaki, Ahmet, Chikyow, Koshihara and Koinuma6 have discovered room-temperature ferromagnetism in Co-doped TiO2 films, many attempts have been made to dope TiO2 with transition metals. Among various dopants (Cr, Mn, Fe, Co), iron atom is the most favorable substituent for titanium in the TiO2 lattice, due to close values of Fe3+ and Ti4+ ion radii.Reference Singh, Kumari, Shrivastav, Dass and Satsangi7 Therefore, it is known for long that Fe/TiO2 thin films exhibit room-temperature ferromagnetism.Reference Fan, Dongmei, Yan and Xueming8 As for the controversial role of Fe dopant in enhancing the photocatalytic activity of the TiO2 films, we have established the beneficial role of Fe3+ impurities in the electron–hole separation processesReference Mardare, Iacomi and Luca9 for the case of low dopant concentration (1–3 at.%).
Extended x-ray absorption fine structure (EXAFS) and x-ray absorption near-edge structure (XANES) are nondestructive techniques for studying the local structure around a selected element contained in a material and the chemical environment, respectively. We have used it to derive information on the local environment around impurity atoms introduced in the matrix hostReference Gurman10 by monitoring the absorption spectrum of the material in a synchrotron facility upon gradually increasing the energy of the incident x-ray photons. Actually, we focus in the current paper on the structural, elemental, and electrical characterization of TiO2 thin films with increasing Fe content, concentrating on the local structure around iron atoms, with the aim to explain the mechanism of the electrical conduction in these thin films.
II. EXPERIMENTAL DETAILS
Titania thin films with increasing iron content have been prepared by RF magnetron sputtering (13.56 MHz) on microscope glass substrates heated at 300 °C, placed at 6 cm in front of the target, in a 30-L deposition chamber (base pressure 1.5 × 10⁻⁵ mbar). A mosaic target arrangement has been used with 1–3 sintered Fe2O3 disks (3.5 mm in diameter) placed on the ceramic TiO2 target (76.2 mm in diameter) in the high-rate sputtering area of the target. The Fe/TiO2 thin films were accordingly denoted as Sample 1/3, Sample 2/3, and Sample 3/3. A reference sample was also prepared with no iron content in it, under the same experimental conditions. Argon at 7 × 10⁻³ mbar was used as the sputtering gas.
The crystalline structure of the films was studied with a Bruker D8 Advantage diffractometer (Bruker AXS Inc., Madison, WI; CuKα radiation, λ = 1.540591 Å) at 4° grazing incidence angle of the incident beam with respect to film surface.
Survey and narrow-scan x-ray photoelectron spectroscopy (XPS) spectra were recorded to derive the elemental composition and chemical state in the films’ surface region by using a Physical Electronics-ULVAC (PHI 5000 VersaProbe, ULVAC-PHI, Inc., Kanawaga, Japan) XPS instrument. A monochromatic AlKα x-ray radiation (hν = 1486.7 eV) was used as excitation source and a take-off photoelectron angle of 45°.
The XANES and the EXAFS measurements were performed in the fluorescence mode at the Doris storage ring facility in the Hasylab synchrotron facility in Hamburg, Germany. The measurements were made using the beamline E4 (EXAFS II) of this research facility using a double crystal Si(111) monochromator, preceded by a focusing mirror for intensity enhancement. Ti and Fe K-edge spectra were measured in Kα-fluorescence yield mode, using a 7-pixel Si(Li) detector. As reference samples, metal foils of Fe and Ti or Fe2O3, Fe3O4, TiO2, and TiO powders (pressed in pellets) were used.
To perform electrical conductivity versus temperature measurements, two parallel thin-film Ag electrodes (0.8 mm spacing) have been grown by thermal evaporation on top of films surfaces. These measurements have been done during two heating and cooling cycles between 391 and 500 K.
III. RESULTS AND DISCUSSION
All the as-deposited Fe/TiO2 films are amorphous, as confirmed by the x-ray diffraction data.
The deconvolution of the narrow-scan XPS spectra showed that the Fe/Ti atomic ratios in Sample 1/3 to 2/3 to 3/3 increased in the sequence 0.3 to 0.5 to 0.8, respectively. All the as-prepared samples, including the reference one, are oxygen deficient since sample deposition has been done in an oxygen-free atmosphere, thus favoring the occurrence of oxygen vacancies in the films.Reference Strunk, Vining and Bell11 The high-resolution XPS spectrum of the O 1s peak shows a “surface” component at a binding energy (BE) of 533.3 eV and second component related to the oxygen bound to Ti, at BE = 532.5 eV.
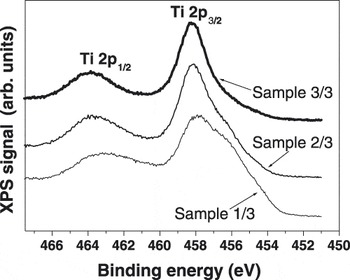
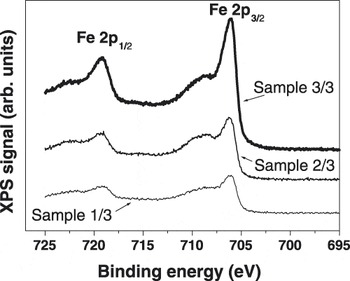
Figures. 1 and 2 present the Ti 2p and the Fe 2p XPS spectra of the investigated films, respectively.
The Ti 2p XPS spectra of the investigated films.

The Fe 2p XPS spectra of the investigated films.

The peak analysis of the Ti 2p 3/2 XPS spectra indicated a main Ti4+ component and gradually less significant amount of Ti3+ and Ti2+ species. The ratio of the Ti3+/Ti4+ components peak area decrease monotonically upon increasing the Fe content in the samples from 0.4 (Sample 1/3) to 0.3 (Sample 2/3) to 0.1 (Sample 3/3), while the ratio of the Ti2+/Ti4+ components peak area decrease from 0.7 to 0.2 to 0.1 for the corresponding samples.
The Fe 2p 3/2 XPS peak contained three components: (i) one corresponding to nonreacted iron (Fe0), weighting about 25% from to the total amount of Fe in the Sample 1/3 and 20% in the Sample 3/3; (ii) a Fe2+ component weighting constantly about 15% in all samples; and (iii) the main Fe3+ component accounts for the balance. The O/Ti atomic ratio in the reference sample is 1.8, while the O/(Ti + Fe) concentration ratio decreased from 1.2 to 1.1 to 0.8 upon increasing the Fe content in the samples.
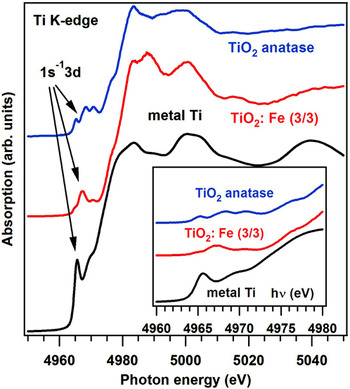
The Ti K-edge XANES (Fig. 3) exhibits from the very beginning a noticeable difference with respect to the corresponding spectrum of pure anatase. The insert in Fig. 3 presents the preedge region of the XANES spectra, which is normally attributed to a mixture of 1s → 3d quadrupole transitions (at lower energies) and dipole transitions from 1s to 4p states hybridated with the 3d states in noncentrosymmetric phases (at higher energies).Reference Farges, Brown and Rehr12–Reference de Groot, Vankó and Glatzel15 The film analyzed (Sample 3/3) seems to present only the quadrupole transition, thus evolution toward placement in centrosymmetric sites of Ti atoms is highly possible. A similar effect was reported in xerogel Fe-doped titania.Reference Matsuo, Sakaguchi and Wakita16
Ti K-edge XANES spectra of anatase TiO2, the sample with the largest Fe content (3/3), and metal Ti. The insert presents a zoom of the preedge region.

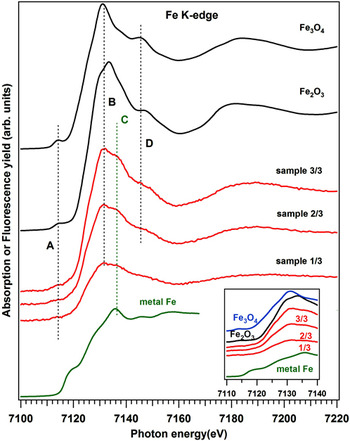
The Fe K-edge XANES (Fig. 4), on contrary, presents features quite similar to that of iron oxides (hematite α-Fe2O3 and magnetite Fe3O4). However, the small preedge peak of common iron oxides is almost completely quenched in the case of Fe–Ti oxide samples. Though no systematic investigation of the preedge peak in Fe K-edge XANES has been reported, as in the case of titanium compounds, this decrease suggests a similar behavior of the Fe 3d states as that of Ti 3d, namely a weaker hybridation with the 4p states.
Fe K-edge XANES spectra of Fe-doped titanium oxide, together with reference spectra of metal Fe and of α-Fe2O3 and Fe3O4. Insert: edge region.

Another remark is the absence of features related to both metal Fe and FeO in XANES.Reference Sakurai, Sasaki, Okube, Ohara and Toyoda17 Since fluorescence detected XANES is much more bulk sensitive as compared with XPS owing to a considerably larger penetration/escape depth of x-rays (micrometers) as compared with the electron escape depth (nanometers), from this observation, one must conclude that Fe0 metal aggregates and Fe2+ compounds are agglomerated in the neighborhood of the film surface for all samples. This is probably connected also to the observed oxygen vacancies and to the presence of Ti3+. Actually, most oxide layers prepared by both magnetron sputtering and pulsed laser deposition exhibit oxygen depletion at the surface, going up to the stabilization of new phases.Reference Dragoi, Gheorghe, Lungu, Trupina, Ibanescu and Teodorescu18 Consequently, the “true” Fe concentration in the bulk of all investigated layers may be recomputed from the XPS data as taking into account the Fe3+ concentration only. This yields 0.18, 0.32, and 0.52 for the ratio Fe/Ti for Samples 1/3, 2/3, and 2/3, respectively.
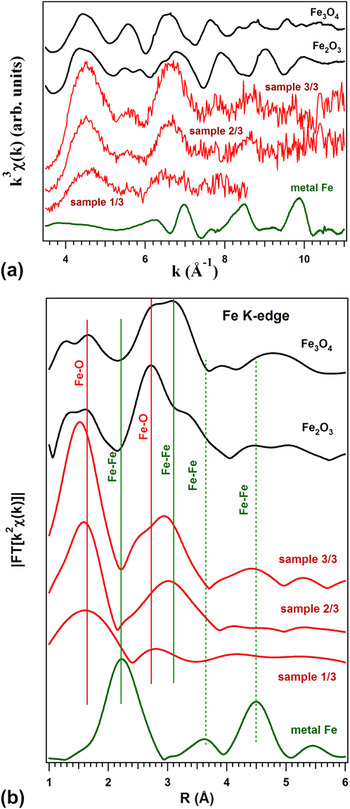
Figure 5 presents the results of the investigation of the EXAFS region at the Fe K-edge. In Fig. 5(a), the EXAFS functions are plotted. An increase of the local order around Fe atoms is quite visible as function on the Fe content (from Sample 1/3 to Sample 3/3). Actually, statistics did not allow a recording of suitable EXAFS spectrum for Sample 1/3, whereas for Sample 3/3, one can easily identify the occurrence of structures (8–9 Å−1) typical of magnetite. Formation of metal (Fe) clusters is precluded from the EXAFS spectra. The Fourier transforms presented in Fig. 5(b) show, indeed, the increase of the ordering and formation of units close to bulk iron oxides with the increase of Fe content, shown by the progressive occurrence of large distance well-defined features. However, the low distance Fe–O peak remains the dominant one and this suggests the coexistence of two phases, an amorphous and a nanocrystalline one, with the latter close of Fe3O4 structures. Note also that the distance R from Fig. 5(b) is not the true interatomic distance; it has to be corrected by the appropriate EXAFS phase shifts, as those discussed in Ref. Reference Gheorghe, Husanu, Lungu, Costescu, Macovei, Popescu and Teodorescu19. Thus, the vertical lines are not “true” bond lengths but “apparent” ones, as derived from the EXAFS Fourier analysis. The amorphous phase is represented by a strong increase of the first Fe–O peak.
(a) EXAFS functions k 3χ(k) recorded at the Fe K-edge, for the same samples as in Fig. 4. (b) The moduli of the Fourier transforms of the EXAFS spectra. Vertical lines denote typical Fe-neighboring apparent lengths.

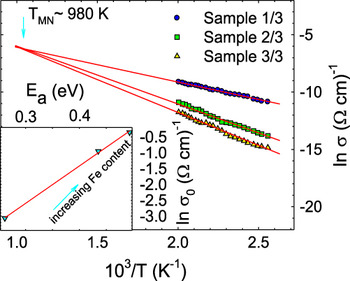
To investigate the charge transport mechanism in the amorphous Fe/TiO2 films, the temperature dependence of the electrical conductivity (σ) was monitored during the variation of the temperature between 391 and 500 K. As shown in Fig. 6, a semiconductor-like increase of σ versus temperature is specific for the investigated materials. The electrical conductivity decreases significantly with the increasing Fe content. This could be explained by the decrease in the electron concentration since Fe impurities act as acceptor impurities.Reference Yildiz, Iacomi and Mardare20
Temperature dependence of the electrical conductivity plotted as ln(σ) versus 103/T for the studied samples. Solid lines are the best-fit lines with Eq. (1). The insert represents the relationship between the preexponential factor (σ0) and the activation energy (E a). Solid line is the best-fit line with Eq. (2).

In semiconductors, the main conduction mechanism is related to the excited carriers beyond the mobility edge into the nonlocalized or extended states, and the electrical conductivity is expressed by the Arrhenius relation:

where σ0 is a preexponential factor, E a is thermal activation energy, and k B is Boltzmann’s constant.
To obtain a better insight in the charge transport in our samples, we should focus on the Arrhenius relation [Eq. (1)]. The values of E a and σ0 are calculated from the slopes and ordinate intercepts of the straight lines in Fig. 6. The magnitude of σ0 in Eq. (1) depends on the sample nature and does not usually depend on E a.Reference Mardare and Rusu21 There are, however, situations like the one first described by Meyer and Neldel,Reference Meyer and Neldel22 where σ0 varies with E a. We have here such a situation (see the insert in Fig. 6), which is known as the Meyer–Neldel rule (MNR). One can easily notice that the activation energy increases upon increasing the Fe content in the films, fact related to the charge carrier depletion and the corresponding decrease of localized state density in the band gap.Reference Yildiz, Iacomi and Mardare20 The MNR has been observed in a wide range of materials including polycrystalline,Reference Coutts and Pearsall23 amorphous,Reference Stabler and Wronski24 and organic materials.Reference Rosenberg, Bhowmik, Harder and Postow25 This rule describes an exponential relation between σ0 and E a:
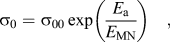
where σ00 and 1/E MN are the MNR preexponential factor and MNR slope, respectively.Reference Meyer and Neldel22 In the insert presented in Fig. 6, the solid line indicates the best fit to the experimental data. It can be seen that our experimental data can be well described by the MNR. The estimated values of σ00 and E MN from Eq. (2) are 2.17 × 10⁻³ Ω−1/cm and 84.7 meV, respectively, which are typical values for a variety of disordered materials.Reference Shimakawa and Abdel-Wahab26
Substituting Eq. (2) into Eq. (1) yields:

which gives a single crossing point for different activation energies at a temperature (T MN) given by:
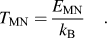
It is clear that σ becomes independent of the activation energy at this temperature. T MN can be estimated from Eq. (4) to be 983 K for our investigated samples.
Although several models have been proposed,Reference Crandall27–Reference Yelon and Movaghar29 the origin of the MNR is still unclear. The temperature dependence of the conductivity in the presence of the MNR seems more complicate. It is important to consider the values of σ00 and E a to clearly distinguish which model is appropriate to describe the experimental data. It can be seen that the value of E a is significantly large compared to hν 0 (ν 0—the optical phonon frequency), which is of the order of the Debye energy. Recently, Han et al.Reference Han, Bergqvist, Dederichs, Müller-Krumbhaar, Christie, Scandolo and Tangney30 found a value of 781.6 K for the Debye temperature (θD) of TiO2, by ab initio calculations, which yields hν 0 = k BθD = 67.4 meV. Yelon and MovagharReference Yelon and Movaghar29 supposed that the optical phonons are the source of the excitation energy in this process. An additional substantiation of the nature of the conductivity in our films can be deduced from the value of σ00, which provides valuable information on the charge transport mechanism. The relatively low value of σ00 (2.17 × 10⁻³ Ω−1/cm) confirms that the transport is rather due to the hopping of carriers stimulated by optical phonons and to a lesser extent to the transport above the mobility edge.Reference Mott31 Therefore, the value of σ00 is again consistent with the picture proposed by Yelon and Movaghar.Reference Yelon and Movaghar29
As the temperature decreases (T < θD/2), the process involves only a single polaron. Unlike this, in the high temperature range, T > θD/2 (in our case, T > 391 K), the polaron motion predominates by thermal-activated jumps between neighboring sites, each accompanied by multiple-phonon emission and absorption.
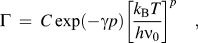
Within the phonon-assisted hopping, two different types of conductivity can be distinguished. If there is a sufficiently strong electron–phonon interaction, small polarons are formed, and the electrical conduction occurs by the hopping of small polarons between the ions of low and high valence states of the transition metal ions.Reference Yildiz, Iacomi and Mardare20, Reference Emin and Holstein32 We have recently reported that the conduction mechanism in the undoped and low Fe-doped TiO2 polycrystalline films can be described by small polaron hopping (SPH) for T > θD/2. On the other hand, if the strength of the electron–phonon interaction is sufficiently weak, no small polaron can be formed.Reference Emin33 In such a case, one can expect a different temperature dependent of conductivity as explained below. In the present films, the fit with the multiphonon-assisted hopping (MPH) model is better than the SPH fit.Reference Kemeny and Rosenberg34 When we have tried to fit to our data utilizing the SPH fit, we have obtained unrealistic physical parameters compared with previous work.Reference Yildiz, Iacomi and Mardare20 This may be related to the much different iron content in the TiO2 films under study or to the different structures (here amorphous, while previous polycrystallineReference Yildiz, Iacomi and Mardare20). Therefore, we had to apply the MPH conduction model to the conductivity data of the present films. We consider here that no small polaron can be formed, a hypothesis further supported by the fact that T MN does not equal θD/2. Kemeny and RosenbergReference Kemeny and Rosenberg34 reported that the SPH conduction can also lead to Eq. (3), in which case T MN equals θD/2. In our situation, therefore, we can rule out the SPH conduction contribution to carrier transport. We were able to give an excellent account of our data in terms of the MPH with weak carrier–phonon coupling, as discussed below. If the transport proceeds via multiphonon tunneling of localized carriers with weak coupling, then the hopping rate (Γ) can be written asReference Emin33, Reference Robertson and Friedman35:
while the conductivity is expressed asReference Emin33, Reference Robertson and Friedman35:

In the Eqs. (5) and (6), C ∼ ν 0, γ = ln(Δ/E M) − 1, R is the hopping distance, nc = N(E F)k BT. Here, N(E F) is the density of states at Fermi level, E F. Unfortunately, an independent estimation of nc and R is difficult, due to the lack of N(E F) values for these films. The parameter E M (or γ) is a measure of the carrier–phonon coupling strength. A measure of the number of phonons participating in transport between hopping sites is also given by the ratio p = Δ/hν0, where Δ is the average site energy difference and hν0—the average energy of phonon modes coupled to the carriers. We may now write:

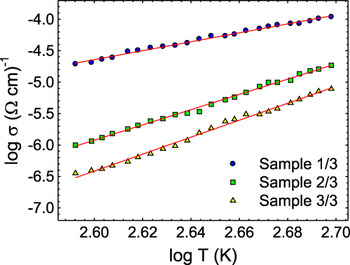
One can expect that, theoretically, p should be an integer number since the MPH process involves the absorption and the emission of p phonons. However, if Δ, or ν 0, are distributed around a certain value, the experimentally found p may have a finite distribution and its mean value will not be an integer and this is the case. Further analysis shows that the overall temperature-dependent conductivity in Fig. 7 is in good agreement with the above expression of the MPH conductivity. From the least squares straight line fits of Fig. 7, the values of p are obtained as 8.25, 14.20, and 14.50 for Sample 1/3, Sample 2/3, and Sample 3/3, respectively. These values of p are comparable with those specific for the variety of disordered systems in which the MPH conduction was observed.Reference Shimakawa36, Reference Sakata, Sega and Chaudhuri37
Temperature dependence of the electrical conductivity plotted as log(σ) versus log T for the studied films. Solid lines are the best-fit lines with Eq. (7).

It is worth noting that in the viewpoint of hopping conduction, our data disagree with the single phonon-assisted variable range hopping (VRH) conduction mechanism because hν0 is much smaller than Δ. The VRH requires the condition p = Δ/hν0 < 1. As indicated, the values of p estimated from the least squares straight line fits of Fig. 7 for the films are higher than 1, due to the fact that in the films, the MPH conduction dominates instead of a single phonon-assisted VRH conduction. Therefore, we conclude that the MPH conduction is the most probable conduction mechanism in the films. Finally, the origin of the MNR is attributed to the MPH for the investigated films.
IV. CONCLUSIONS
In this paper, we have obtained amorphous titania films, with increasing iron content, by RF sputtering. X-ray absorption (XANES and EXAFS) allowed the identification of local changes around Ti atoms with occurrence of more centrosymmetric phases than anatase; the same may be stipulated also from the XANES spectra of Fe K-edge, when a lower 3d–4p hybridation may explain the same decrease in the preedge peak. EXAFS performed at the Fe K-edge yielded the coexistence of two phases, one which is quite close to nanocrystalline magnetite and the other which is highly amorphous.
The temperature-dependent conductivity measurements, as performed on Fe/TiO2 amorphous films, allowed us to evidence the MNR at temperatures higher than half of the Debye temperature (T > 390 K). Calculations give the σ00 as 2.17 × 10⁻³ Ω−1/cm and the T MN as approximately 980 K. It has been shown that the MNR can be described through the use of the MPH conduction model in the investigated films.
ACKNOWLEDGMENTS
This work was supported by CNCSIS Contract PCCE-ID_76/2010. Petronela Rambu and Daniel Florea acknowledge the financial support from the Romanian programs POS-DRU/89/1.5/S/49944 and POSDRU/CPP 107/DMI 1.5/S/78342, respectively.