Introduction
Squids of the family Gonatidae are widely distributed in subpolar regions in the Northern and Southern Hemispheres (Nesis, Reference Nesis1973, Reference Nesis1997; Okutani et al., Reference Okutani, Kubodera and Jefferts1988; Roper et al., Reference Roper, Jorgensen, Katugin, Jereb, Jereb and Roper2010). These squids are known for their particularly high abundance and taxonomic diversity in the boreal North Pacific, where they are key components in pelagic and near-bottom deep-sea marine and oceanic communities and, in certain areas, some species are found in high-density commercial concentrations and are harvested by fisheries (Okutani et al., Reference Okutani, Kubodera and Jefferts1988; Clarke, Reference Clarke1996; Nesis, Reference Nesis1997; Savinykh, Reference Savinykh2005; Hoving et al., Reference Hoving, Perez, Bolstad, Braid, Evans, Fuchs, Judkins, Kelly, Marian, Nakajima, Piatkowski, Reid, Vecchione and Xavier2014). According to studies based primarily on morphology, the family Gonatidae comprises up to 19 species, of which 16 are found in the North Pacific, two in the North Atlantic, and one in the Southern Ocean (Nesis, Reference Nesis1973, Reference Nesis1997; Okutani et al., Reference Okutani, Kubodera and Jefferts1988; Roper et al., Reference Roper, Jorgensen, Katugin, Jereb, Jereb and Roper2010). Despite the family's high ecological and economic importance, life-history patterns and systematic relations in the Gonatidae remain poorly understood. Studies at the bio-molecular level are incongruent with morphological findings and question the reliability of the currently accepted generic subdivision of the family (Katugin, Reference Katugin2004; Lindgren et al., Reference Lindgren, Katugin, Amezquita and Nishiguchi2005; Katugin et al., Reference Katugin, Chichvarkhina, Zolotova and Chichvarkhin2017). Mitochondrial DNA (mtDNA) sequencing, in particular, has proved to be a useful tool for species identification in the Gonatidae, especially for individuals at the early (paralarvae and early juveniles) and late (spawning and spent individuals) ontogenetic stages, when it is difficult to identify individuals morphologically at the species level (Seibel et al., Reference Seibel, Hochberg and Carlini2000; Bower et al., Reference Bower, Seki, Kubodera, Yamamoto and Nobetsu2012).
With the aim of resolving these difficulties, some of which are associated with previous studies based on cytochrome c oxidase subunit I (CO1) (Katugin et al., Reference Katugin, Chichvarkhina, Zolotova and Chichvarkhin2017), two additional mitochondrial genes (16S rRNA and 12S rRNA), and two nuclear genes (28S and 18S) were analysed in comparison with sequences obtained from BLAST searches of the GenBank database to reassess the relationships among gonatid species from the World Ocean and the reliability of the currently available sequence data. The five gene markers used in the present study for better understanding of relationships among the Gonatidae species were previously used in molecular genetic studies, particularly, on molluscs (e.g. Zubakov et al., Reference Zubakov, Sherbakov and Sitnikova1997; Carlini, Reference Carlini1998; Canapa et al., Reference Canapa, Schiaparelli, Marota and Barucca2003; Fahey, Reference Fahey2003; Meyer et al., Reference Meyer, Todt, Mikkelsen and Lieb2010, Plazzi and Passamonti, Reference Plazzi and Passamonti2010; Tan and Conaco, Reference Tan and Conaco2021).
Materials and methods
Sampling
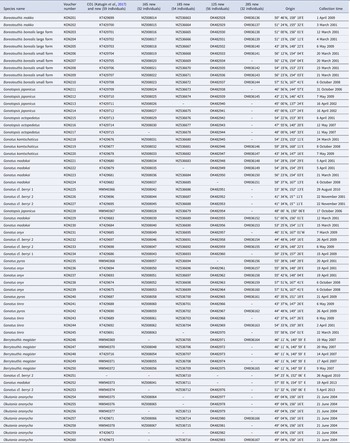
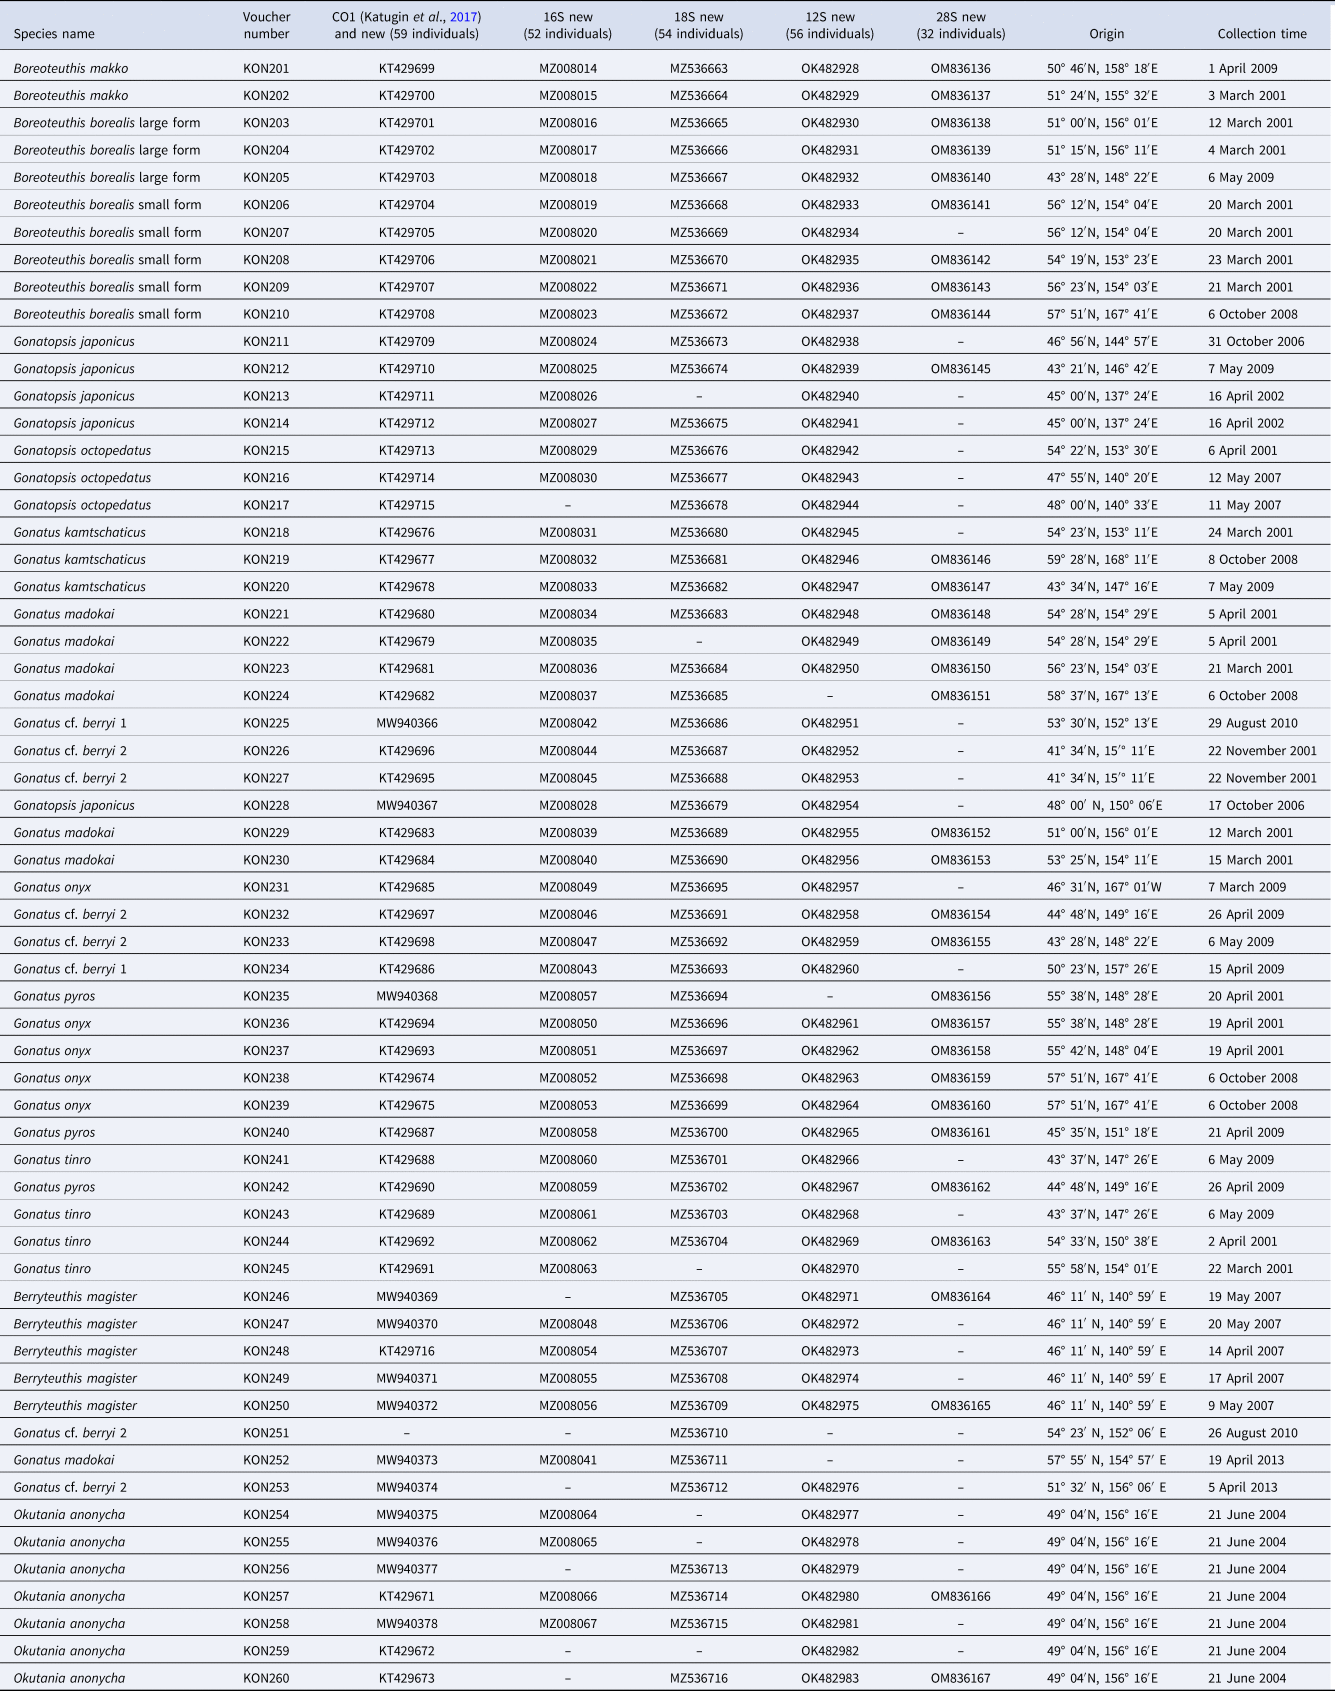
DNA sequences of the Gonatidae for subsequent analysis were obtained from two major sources: the original collection and GenBank. Most sequences were obtained from squid specimens deposited in the A.V. Zhirmunsky National Scientific Center of Marine Biology, Far Eastern Branch of the Russian Academy of Sciences, and tissue samples of squids captured during TINRO (Pacific Branch of Russian Federal Institute of Fisheries and Oceanography) research surveys in the Okhotsk, Bering, and Japan seas, and northwestern Pacific Ocean using midwater and bottom trawl nets. Squids were identified to species in the field and in the laboratory based on morphology and using published identification keys (Bublitz, Reference Bublitz1981; Jefferts, Reference Jefferts1983; Nesis, Reference Nesis1987). Muscle tissue (mantle) was taken for further DNA extraction and sequencing (Table 1). Sequences were further compared with those deposited in the GenBank (NCBI) identified as originating from species of the family Gonatidae. For the analyses, two outgroup species were chosen from two Oegopsid squid families: Architeuthidae (Architeuthis dux: KC701757.1) and Ommastrephidae (Todarodes pacificus: AB158364 and AB240153; Supplementary Table S1).
List of specimens of the Gonatidae from our collection used in the molecular genetic analysis
DNA extraction, polymerase chain reaction (PCR) amplification, and sequencing
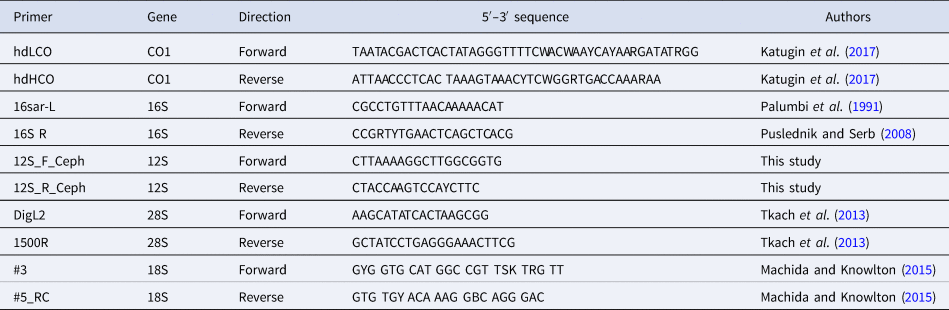
Tissue samples were collected from the recently captured squids and stored in 96% ethanol at −20°C. Genomic DNA was extracted from 20 mg of preserved mantle tissue using a DNAeasy extraction kit (‘DNA-Extran-2’, SINTOL, Moscow, Russia) according to the protocol of the manufacturer and then stored at −20°C. PCR amplification was carried out in a 25 μl PCR volume consisting of 10.42 μl double-distilled water, 1 μl 0.2 mM deoxynucleoside triphosphate mix, 4 μl 5× Taq Red buffer, 1.6 μl 2 mM magnesium chloride, 1 μl Taq polymerase, and 1 μl DNA template for fragments of three mitochondrial loci: CO1 (658 bp), 16S rRNA (558 bp), and 12S rRNA (260 bp); and two nuclear genes: 28S rRNA (1635 bp) and part of 18S rRNA (402 bp). Ribosomal genes will be referred to subsequently as 16S rRNA, 12S rRNA, 28S, and 18S, respectively. Some primers were designed for this study; others were taken from previous studies (Table 2).
Primers used for amplifying and sequencing five genes

Amplification was performed using a programmable thermal cycler GeneAmp 9700 (Applied Biosystems, Foster City, CA, USA) according to the following protocol: 94°C for 5 min; followed by 35 cycles at 94°C for 30 s, 44.5°C for 30 s, and 72°C for 60 s; and a final extension at 72°C for 10 min. The PCR amplification products were separated by electrophoresis on a 1.5% agarose gel containing ethidium bromide, and then visualized and photographed under ultraviolet transillumination prior to cleanup and sequencing.
Amplified PCR products were used as a template for sequence reactions carried out on ABI PRISM 3500 (Applied Biosystems) according to the BigDye terminator v3.1 Cycle Sequencing Kit Protocol (Applied Biosystems) with the same primers as for PCR. The sequenced fragments were read by an ABI3500 Genetic Analyzer (Applied Biosystems). Sequences were aligned using ClusterW in MEGA10 (Kumar et al., Reference Kumar, Stecher, Li, Knyaz and Tamura2018), and then edited by eye using BioEdit (Hall, Reference Hall1999). New sequences (total 119) were deposited in the GenBank under the following accession numbers: MW940366–MW940378 (CO1); MZ008014–MZ008067 (16S rRNA); OK482928–OK482983 (12S rRNA); OM836136–OM836167 (28S); and MZ536663–MZ536716 (18S).
Sequence analyses
Sequence analyses were conducted separately for CO1, 16S rRNA, 12S rRNA, 28S, and 18S. The P-distance method (pairwise distances) was used to analyse intra- and interspecific variability in MEGA10 using nucleotide code for mitochondrial invertebrates for CO1 and 16S rRNA; and standard code for 12S rRNA, 28S, and 18S. For each marker, neighbour-joining (NJ), maximum-likelihood (ML), and Bayesian (BA) trees were constructed as graphic representations of species subdivision using programs MEGA10 (Kumar et al., Reference Kumar, Stecher, Li, Knyaz and Tamura2018) and mrBayes 3.2 (Ronquist and Huelsenbeck, Reference Ronquist and Huelsenbeck2003). Analyses were conducted for each gene individually and also for the combined data set. ML and BA trees were used to generate consensus trees. NJ and ML trees were generated with bootstrap support of 1000 pseudo-replicates (Felsenstein, Reference Felsenstein1985) for nodes. Consensus ML trees were built using RAXML online (https://raxml-ng.vital-it.ch/#/). The best-fitting evolution models were calculated in jModelTest (Posada, Reference Posada2008). Considering the Akaike information criterion, the best evolution models were TRM3uf + I + G (CO1, samples from our collection only), TrN + I + G (16S rRNA, samples from our collection only), TrN + I (12S rRNA, samples from our collection only), GTR + I + G (28S, samples from our collection only), TIM1 + I (18S, samples from our collection only); TRMuf + I + G (CO1, combined data from our collection and GenBank), HKY + I + G (16S rRNA, combined data from our collection and GenBank), HKY + I (12S rRNA, combined data from our collection and GenBank), GTR + I + G (28S, combined data from our collection and GenBank), and TIM1 + I (18S, combined data from our collection and GenBank). Stationarity was considered when the mean standard deviation of the split frequencies was below 0.01 (Ronquist and Huelsenbeck, Reference Ronquist and Huelsenbeck2003). The number of repetitions (generations) in simulations was 1,500,000, burn in was 25%, and the sample frequency was 100.
Species delimitation
Species delimitation used tree topologies obtained in RAXML, MEGA10, and mrBayes. Species groups were selected using the Automatic Barcode Gap Discovery (ABGD) method, which is widely used in molluscan studies (Ekimova et al., Reference Ekimova, Antokhina and Schepetov2020; Ghanimi et al., Reference Ghanimi, Goddard, Chichvarkhin, Gosliner, Jung and Valdés2020). JC69 (Jukes–Cantor), K80 (Kimura), and simple distances of automatic barcoding gap discovery were used online https://bioinfo.mnhn.fr/abi/public/abgd/abgdweb.html to investigate the ‘barcode gap’ (Hebert et al., Reference Hebert, Cywinska, Ball and de Waard2003) and sort the sequences into hypothetical species (Puillandre et al., Reference Puillandre, Lambert, Brouillet and Achaz2012). For 16S rRNA, 12S rRNA, 28S, and 18S, Pmin = 0.001, Pmax = 0.2, and the relative gap width (X) = 1; for CO1, Pmin = 0.001, Pmax = 0.15, and the relative gap width (X) = 1. The other parameters remain as default.
Results
Sequence analysis
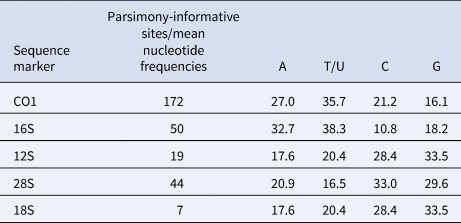
Sequences of CO1, 16S rRNA, 12S rRNA, 28S, and 18S of the Gonatidae species were analysed (Table 3). Parsimony-informative sites were also calculated for each of the five gene markers (Table 3).
Mean nucleotide frequencies and parsimony-informative sites for nucleotide sequences of five gene markers in the family Gonatidae

Genetic divergence within and between species
Species hypothesis-free ABGD analysis of the five gene markers revealed different numbers of separate species groups for different markers (Table 4). ABGD for CO1 suggested that resultant groups appeared as the well-known nominal gonatid species, except for Gonatus cf. berryi and Boreoteuthis borealis, each of which appeared subdivided into two species groups.
Result of ABGD analyses

JC, Jukes–Cantor model for distances; K80, Kimura model for distances.
ABGD for 16S rRNA suggested that most groups corresponded to the nominal gonatid species, with two species groups included in B. borealis. However, some species appeared poorly resolved with very small P-distances between them (Supplementary Tables S2 and S3). Four species of the genus Gonatus were grouped together, as were two species of genus Gonatopsis.
Even though 12S rRNA and 28S revealed fewer groups than 16S rRNA and CO1, these two markers suggested a clear subdivision between ‘large’ and ‘small’ forms of B. borealis (P-distances between them: 12S = 1.6%, 28S = 0.35%) (Supplementary Tables S4 and S5). Even fewer species groups were outputs for 18S (Table 4). Pairwise P-distances were calculated within and between 14 taxonomically identifiable groups, or ‘species’ in the Gonatidae (Supplementary Tables S2–S6).
Phylogenetic reconstructions
Phylogenetic reconstructions using all three approaches (BA, ML, and NJ) suggested monophyly in the family Gonatidae for four out of five gene markers (CO1, 28S, 16S rRNA, and 12S rRNA) with 100% bootstrap support and 1.0 posterior probability, whether or not sequences from the GenBank were used. The use of partial CO1, 28S, 16S rRNA, and 12S rRNA sequences yielded generally similar gene trees for the Gonatidae, showing intra-familial subdivision into species. However, there were certain differences between tree topologies constructed for squids from our collection and for the combined array of individuals (squids from our collection plus those from the GenBank).
CO1
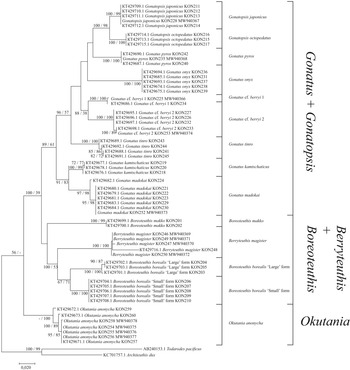
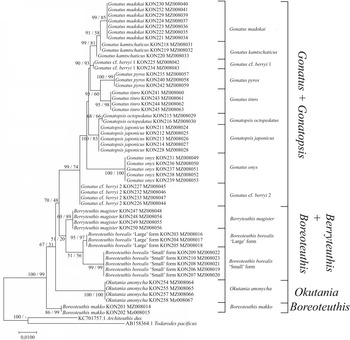
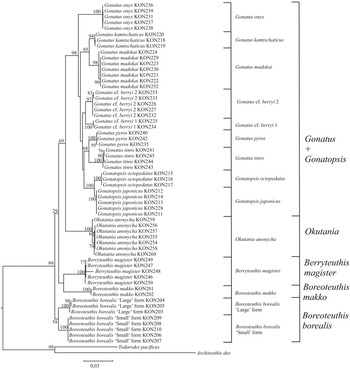
Phylogenetic reconstructions for CO1 using NJ (Figure 1) and BA + ML (Figure 2), which were based exclusively on our squid samples, were virtually identical: four clades with almost 100% bootstrap support and high P-values, each of the four clades consisting of two sister taxa: (1) Gonatopsis japonicus + Gonatopsis octopedatus (P = 2.7%); (2) G. cf. berryi 1 + G. cf. berryi 2 (P = 4.8%); (3) Gonatus kamtschaticus + Gonatus madokai (P = 9.6%); and (4) B. borealis ‘small’ form + B. borealis ‘large’ form (P = 5.2%). All Gonatus spp. and Gonatopsis spp. formed a separate clear multi-clade branch with bootstrap values higher than 60% on the NJ and BA + ML trees.
CO1 tree generated by NJ method for individuals from the family Gonatidae only from our collection (Table 1) and outgroup species.
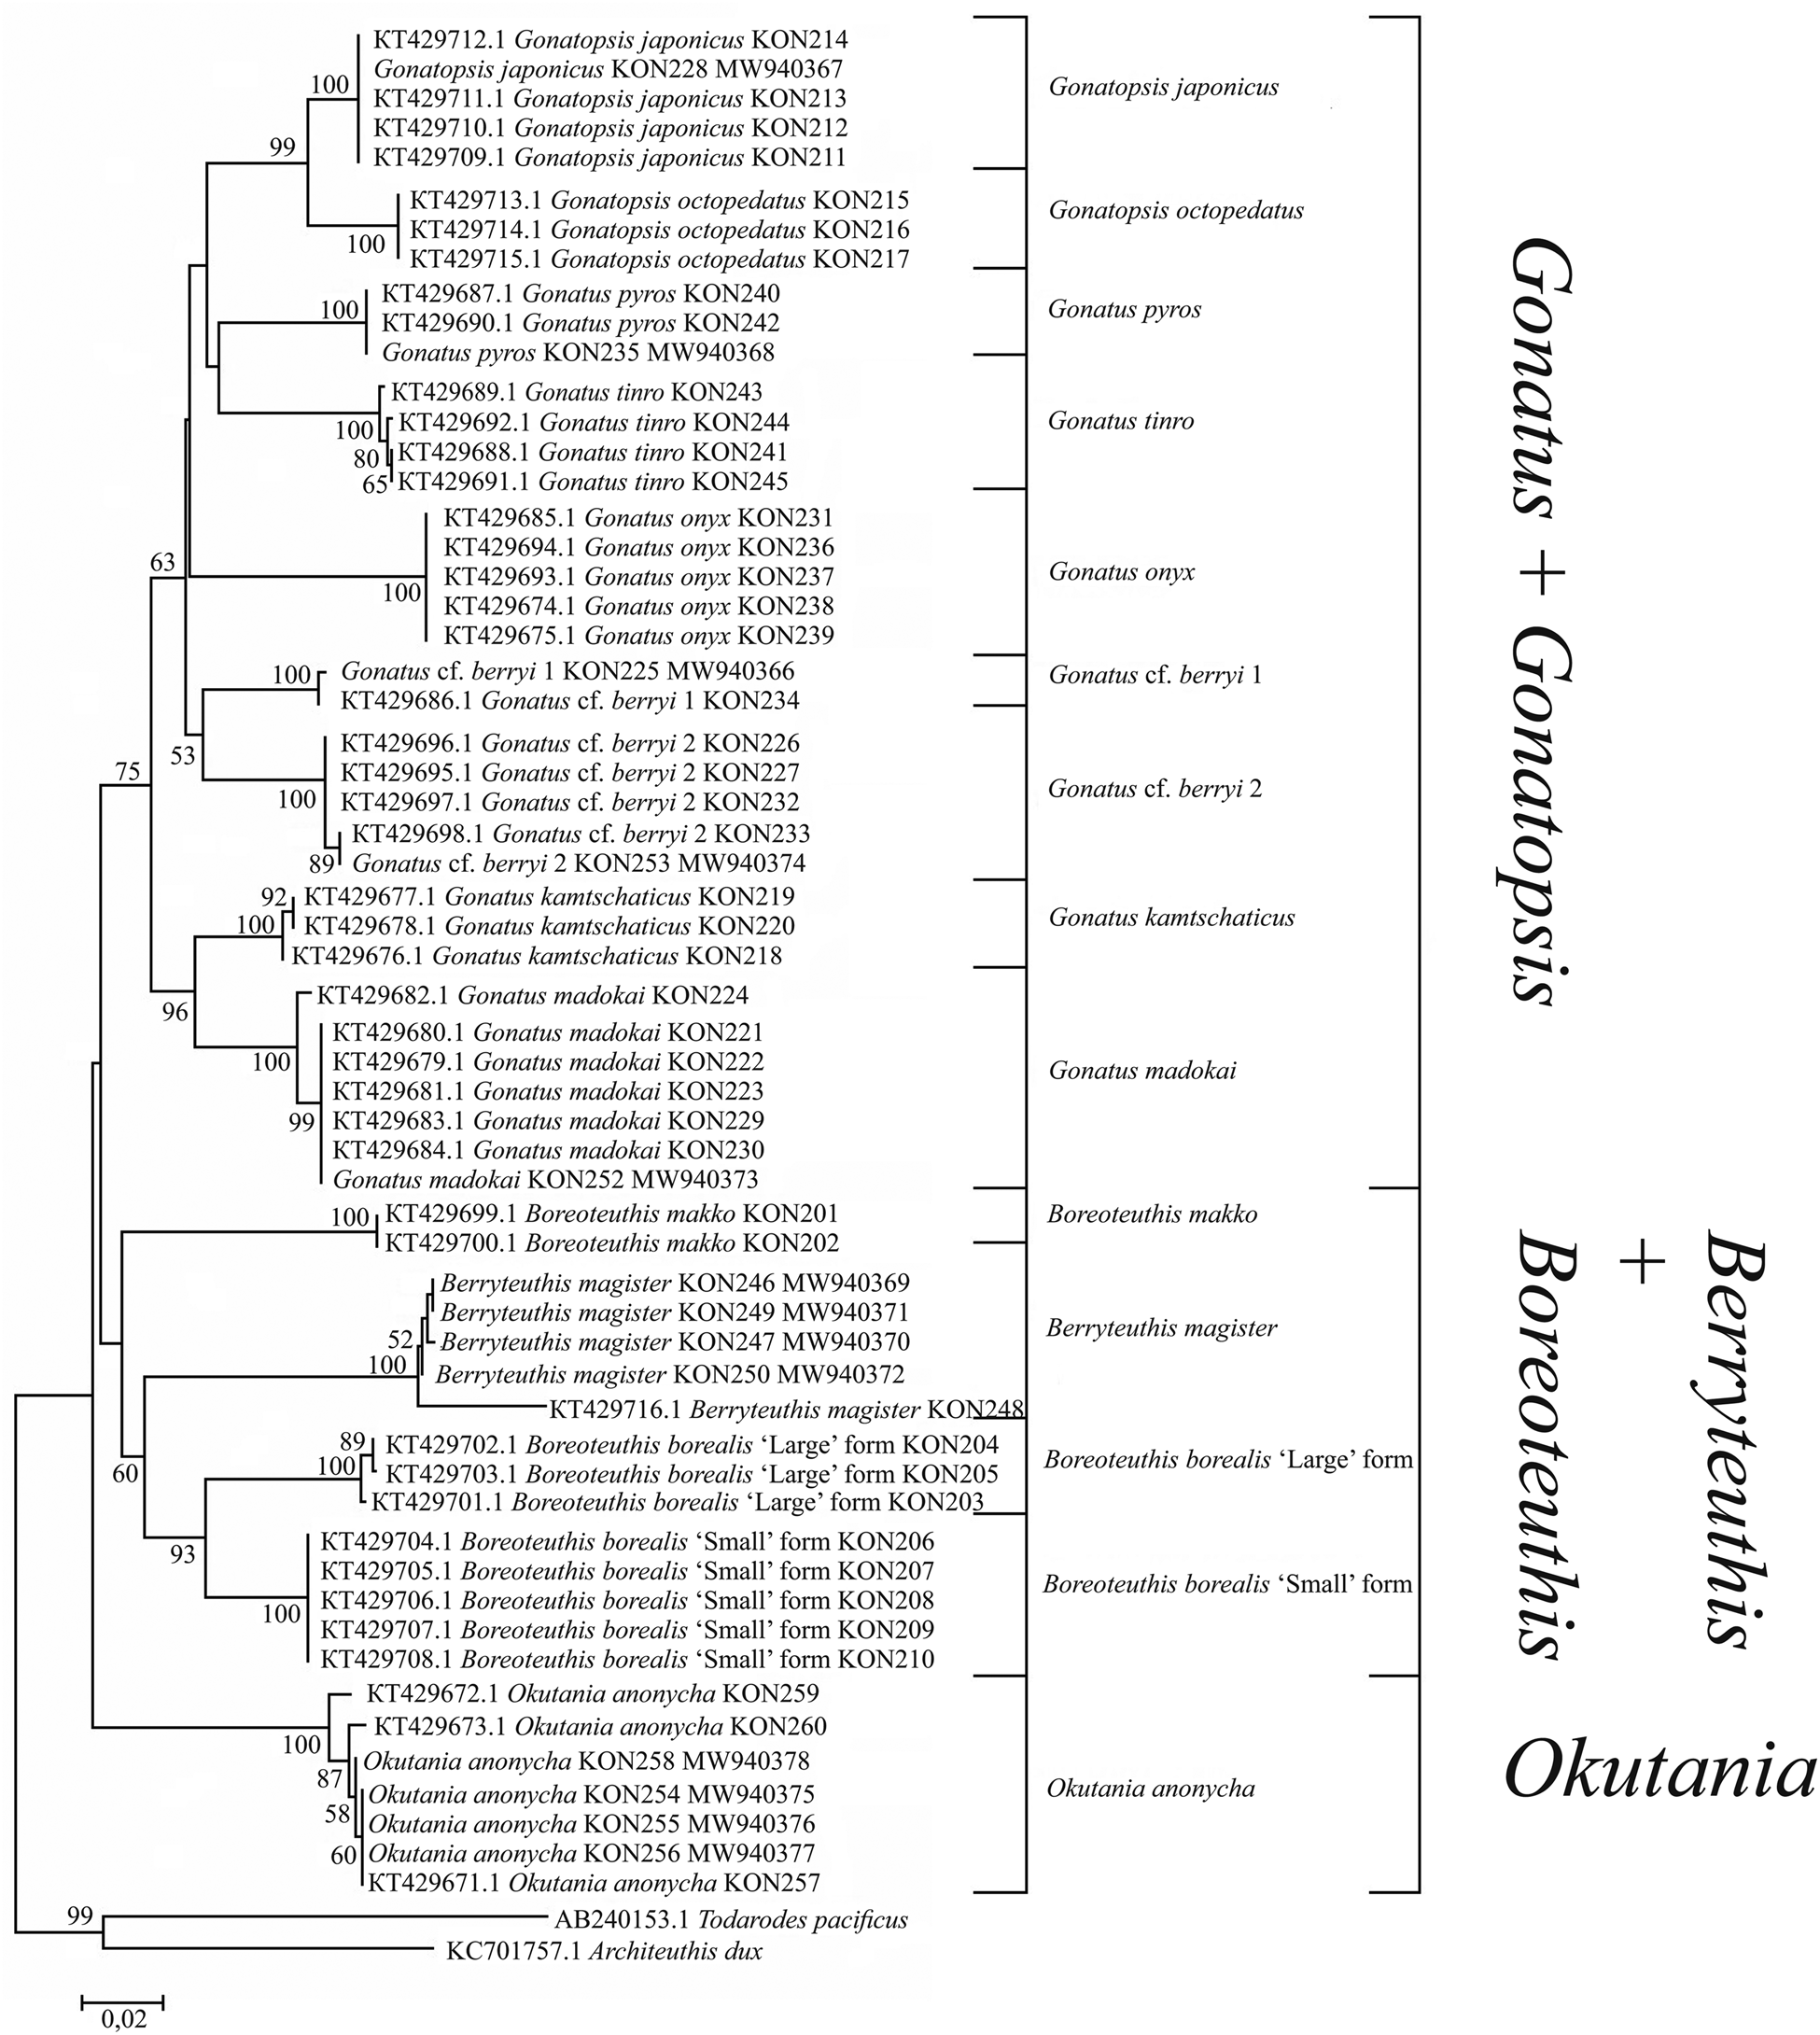
CO1 consensus tree generated by MCMC BA tree reconstruction and ML method for individuals from the family Gonatidae only from our collection (Table 1) and outgroup species. Support levels for branches are shown for three approaches of tree reconstruction (%) in the following order: BA/ML.

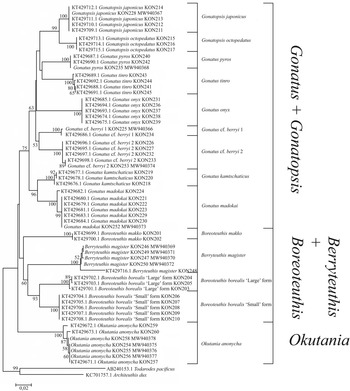
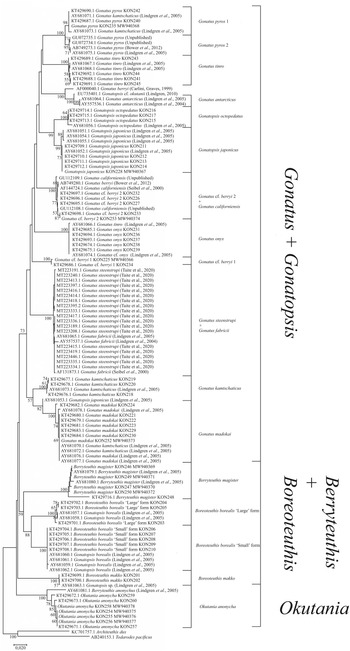
For the combined array of squid samples (ours and from the GenBank), tree topologies for the CO1 using NJ (Figure 3) and BA + ML (Figure 4) were somewhat different from the above-mentioned reconstructions. There were four clades, each consisting of two sister taxa: (1) G. japonicus + G. octopedatus; (2) G. kamtschaticus + G. madokai; (3) B. borealis ‘small’ form + B. borealis ‘large’ form; and (4) Gonatus tinro + Gonatus pyros. Specimens identified morphologically as G. pyros split into two sister clades. The clade G. cf. berryi 1 + G. cf. berryi 2 was present only in the BA + ML reconstruction. Some GenBank sequences for particular species appeared in clusters with different taxa, e.g. G. kamtschaticus clustered either with G. madokai or with G. pyros; G. tinro clustered with Gonatus onyx (Supplementary Table S1); Gonatus fabricii (AF131873.1, Seibel et al., Reference Seibel, Hochberg and Carlini2000; AY681065.1, Lindgren et al., Reference Lindgren, Katugin, Amezquita and Nishiguchi2005; AY557537.1, Lindgren et al., Reference Lindgren, Giribet and Nishiguchi2004) clustered with Gonatus steenstrupi (Taite et al., Reference Taite, Vecchione, Fennell and Allcock2020); G. cf. berryi 2 (KT429695.1–KT429698.1; MW940374) appeared in the same cluster with G. berryi (AB749280.1, Bower et al., Reference Bower, Seki, Kubodera, Yamamoto and Nobetsu2012) and Gonatus californiensis (AF144724.1; GU112108.1; GU112109.1). G. japonicus appeared as a separate line close to the G. madokai cluster (Supplementary Table S1), most likely erroneously, since all other individuals of G. japonicus grouped in a single cluster. One sequence deposited under the name G. berryi (AF000040.1, Carlini and Graves, Reference Carlini and Graves1999) showed up as a sister taxon to Gonatus antarcticus (AY681064.1; AY557536.1) and Gonatopsis cf. okutanii (EU735401.1).
CO1 tree generated by NJ method for the individuals from the family Gonatidae only from our collection (Table 1) and for all analysed specimens including those from the GenBank (Supplementary Table S1).

CO1 consensus tree generated by MCMC BA tree reconstruction and ML method for individuals from the family Gonatidae only from our collection (Table 1) and for all analysed specimens including those from the GenBank (Supplementary Table S1). Support levels for branches are shown for three approaches of tree reconstruction (%) in the following order: BA/ML.

16S rRNA
Phylogenetic trees constructed for 16S rRNA based on only our array of the Gonatidae samples using NJ (Figure 5) and BA + ML (Figure 6) were similar. Four clades with high bootstrap support on the 16S rRNA NJ and BA + ML trees were composed of the following sister taxa: (1) G. japonicus + G. octopedatus (P = 0.27%); (2) G. pyros + G. tinro (P = 0.14%); (3) G. kamtschaticus + G. madokai (P = 0.43%); and (4) B. borealis ‘small’ form + B. borealis ‘large’ form (P = 1.28%). Boreoteuthis makko formed an independent branch with 0.86 pp and a 99% bootstrap value on the BA + ML reconstruction.
16S tree generated by NJ method for individuals from family Gonatidae only from our collection (Table 1) and outgroup species.

16S consensus tree generated by MCMC BA tree reconstruction and ML method for individuals from the family Gonatidae only from our collection (Table 1) and outgroup species. Support levels for branches are shown for three approaches of tree reconstruction (%) in the following order: BA/ML.

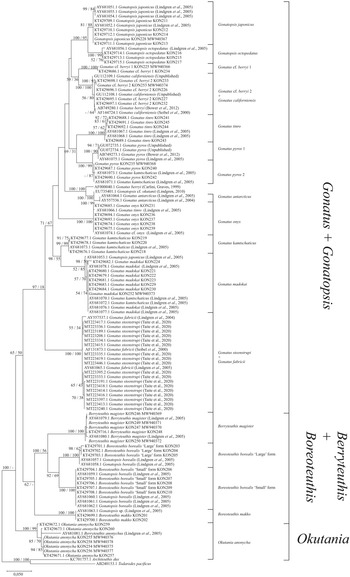
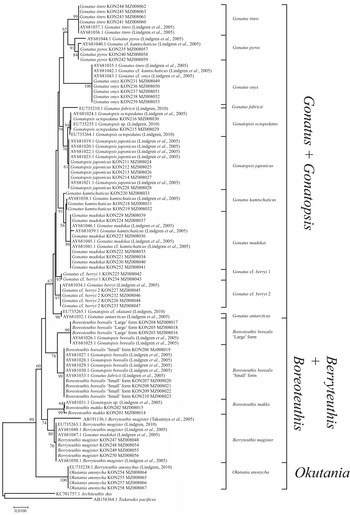
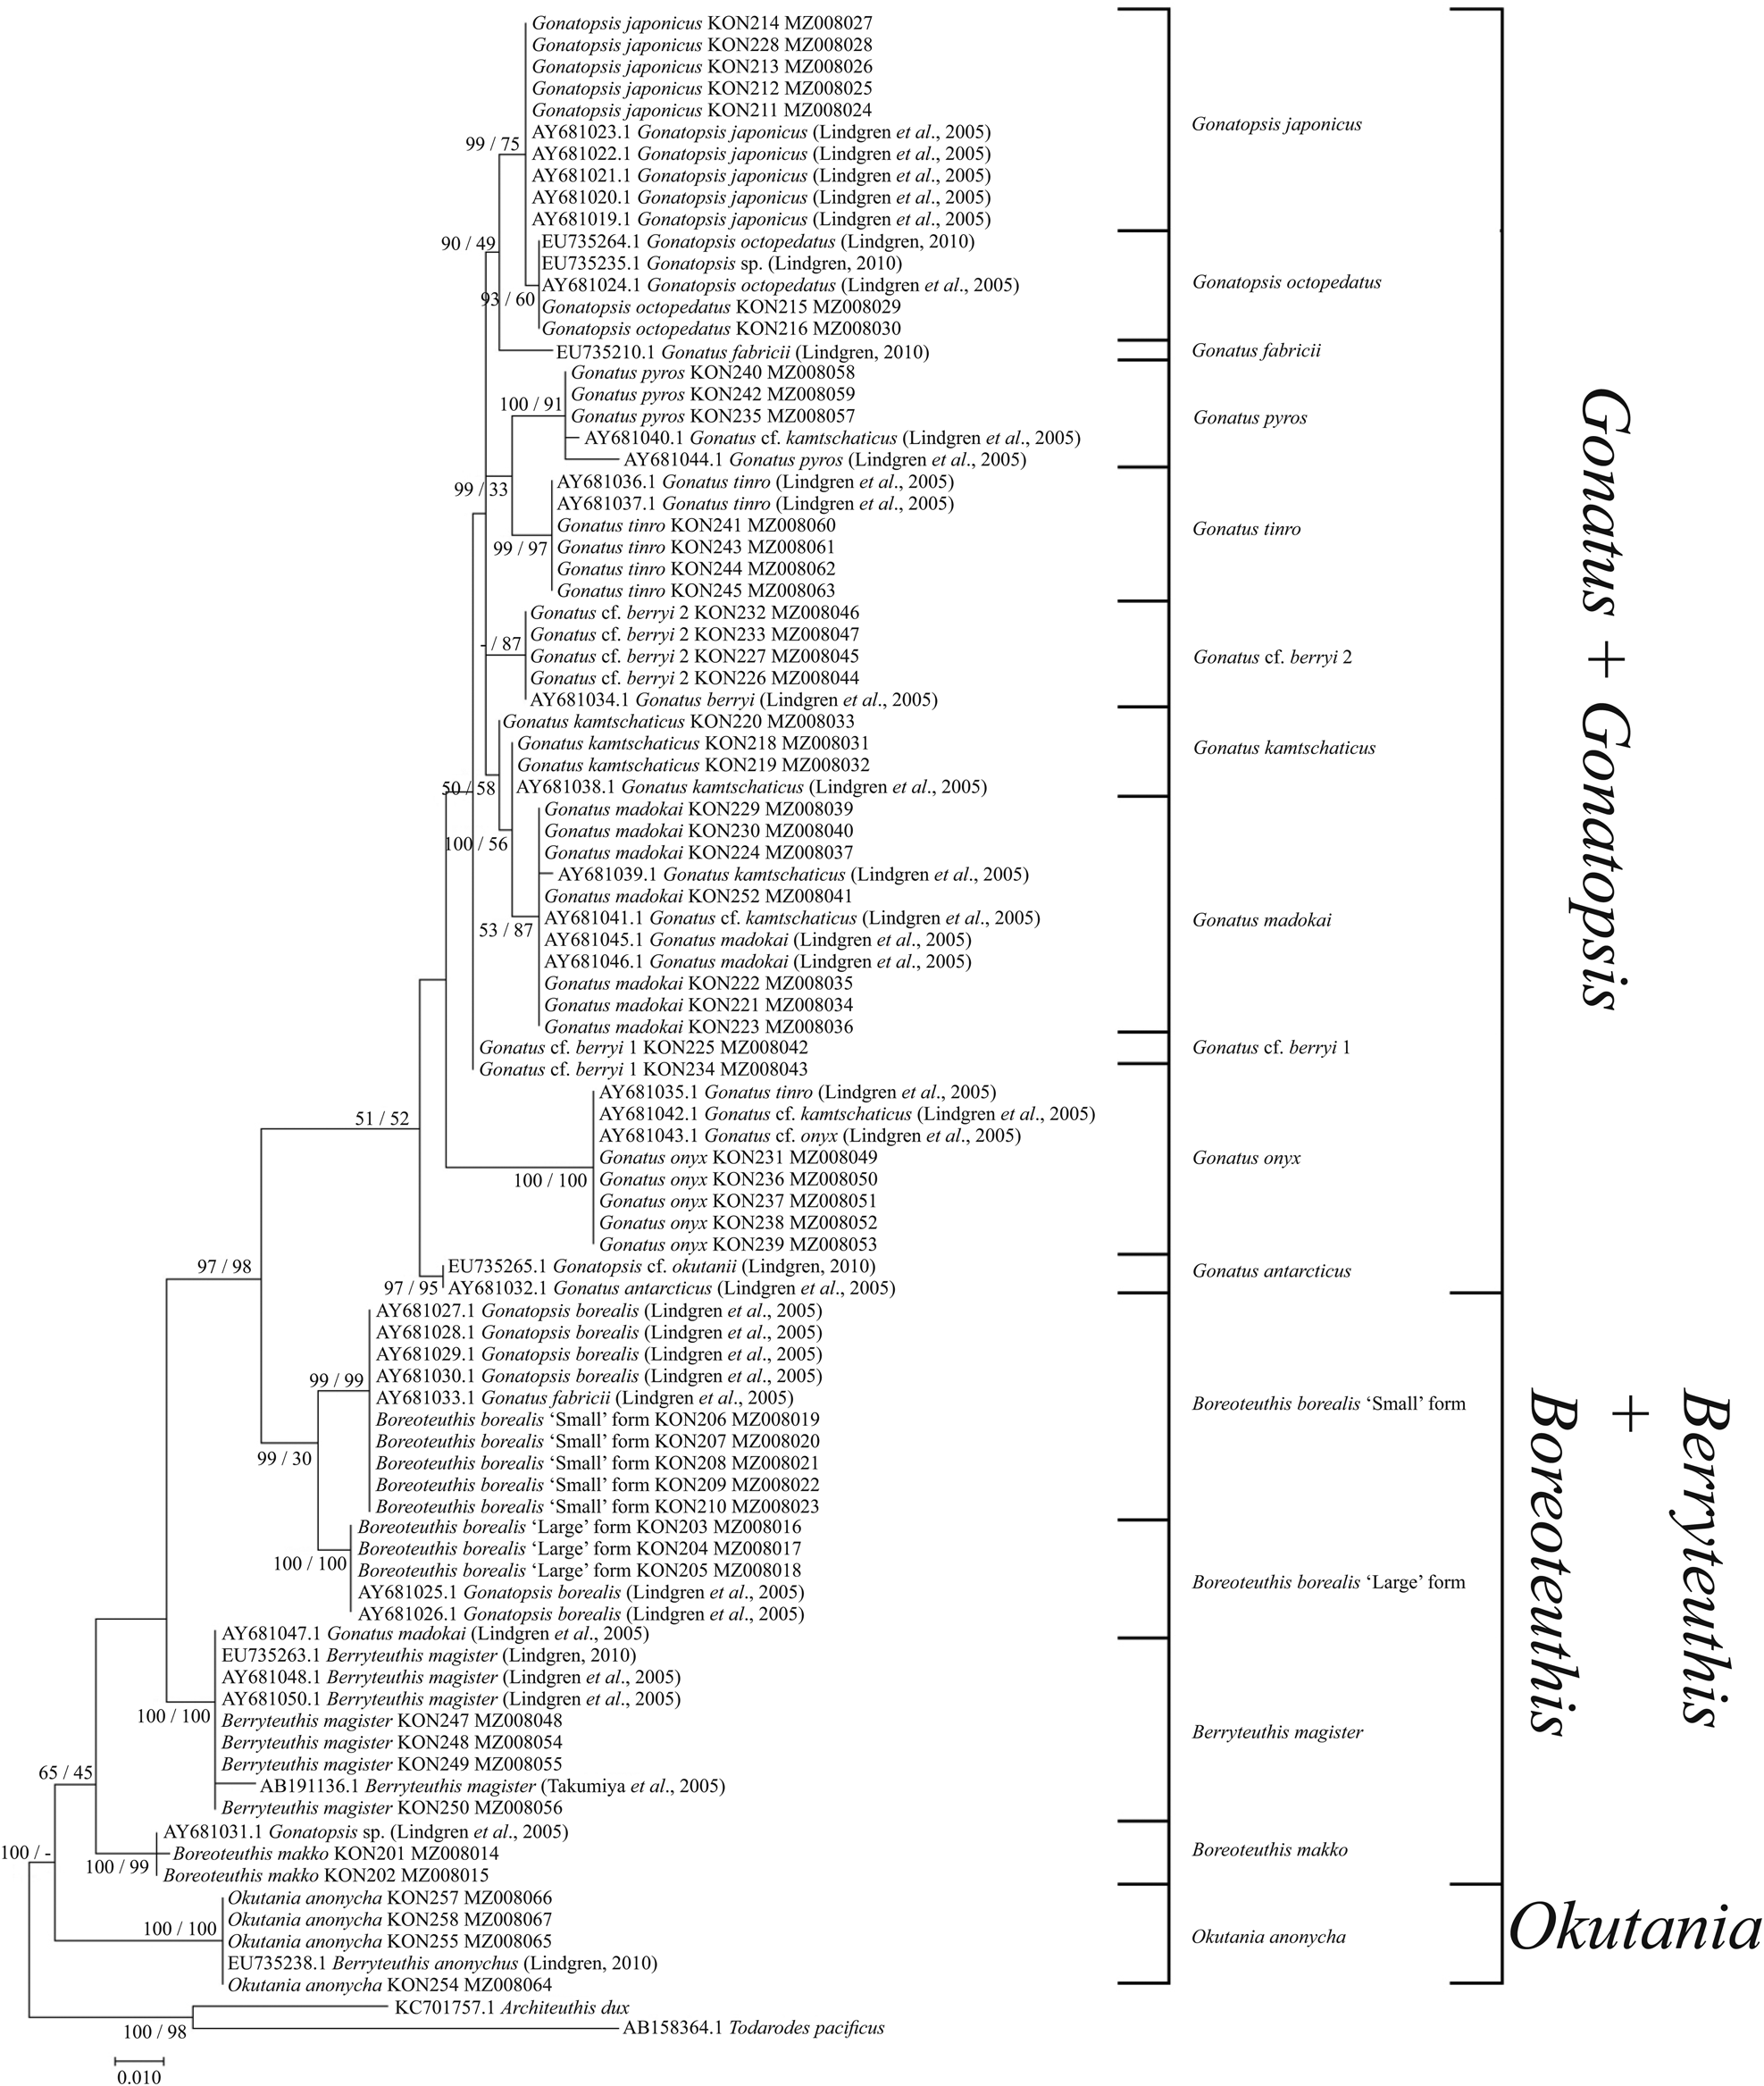
The use of both our samples and samples from the GenBank yielded somewhat different reconstructions. In the NJ (Figure 7) and BA + ML (Figure 8) topologies, there were four groups of sister taxa: (1) G. tinro + G. pyros; (2) G. japonicus + G. octopedatus along with G. fabricii (EU735210.1, Lindgren, Reference Lindgren2010) as an outgroup; (3) G. kamtschaticus + G. madokai; and (4) B. borealis ‘small’ form + B. borealis ‘large’ form. Some GenBank sequences for particular species appeared in clusters with different taxa, e.g. four individuals of G. kamtschaticus clustered with different species: G. madokai, G. pyros, and G. onyx. G. fabricii clustered with B. borealis ‘small’ form; G. madokai clustered with Berryteuthis magister; G. tinro clustered with G. onyx; and Gonatopsis sp. (EU735235, Lindgren, Reference Lindgren2010) clustered with G. octopedatus (Supplementary Table S1). G. antarcticus (AY681032, Lindgren et al., Reference Lindgren, Katugin, Amezquita and Nishiguchi2005) and G. cf. okutanii (EU735265, Lindgren, Reference Lindgren2010) formed a separate cluster, which appeared as an outgroup to all other Gonatus and Gonatopsis groups. All the 16S rRNA trees were pretty much similar in that most species clades were clearly resolved on all topologies. Similar to the CO1 topologies, the following major groups were present on all the 16S rRNA trees: (1) Gonatus + Gonatopsis; (2) B. borealis; (3) B. makko; (4) B. magister; and (5) Okutania anonycha. The first group included the gonatids with five longitudinal rows of teeth on the radula, and the other four groups were represented by the gonatids with seven rows of teeth. On one tree (BA + ML for our data set), B. makko appeared as an outgroup to the rest of the Gonatidae (Figure 6); on the other three phylogenetic reconstructions (Figures 5, 7, and 8), O. anonycha appeared as an outgroup to all other clusters.
16S tree generated by NJ method for individuals from family Gonatidae only from our collection (Table 1) and for all analysed specimens including those from the GenBank (Supplementary Table S1).
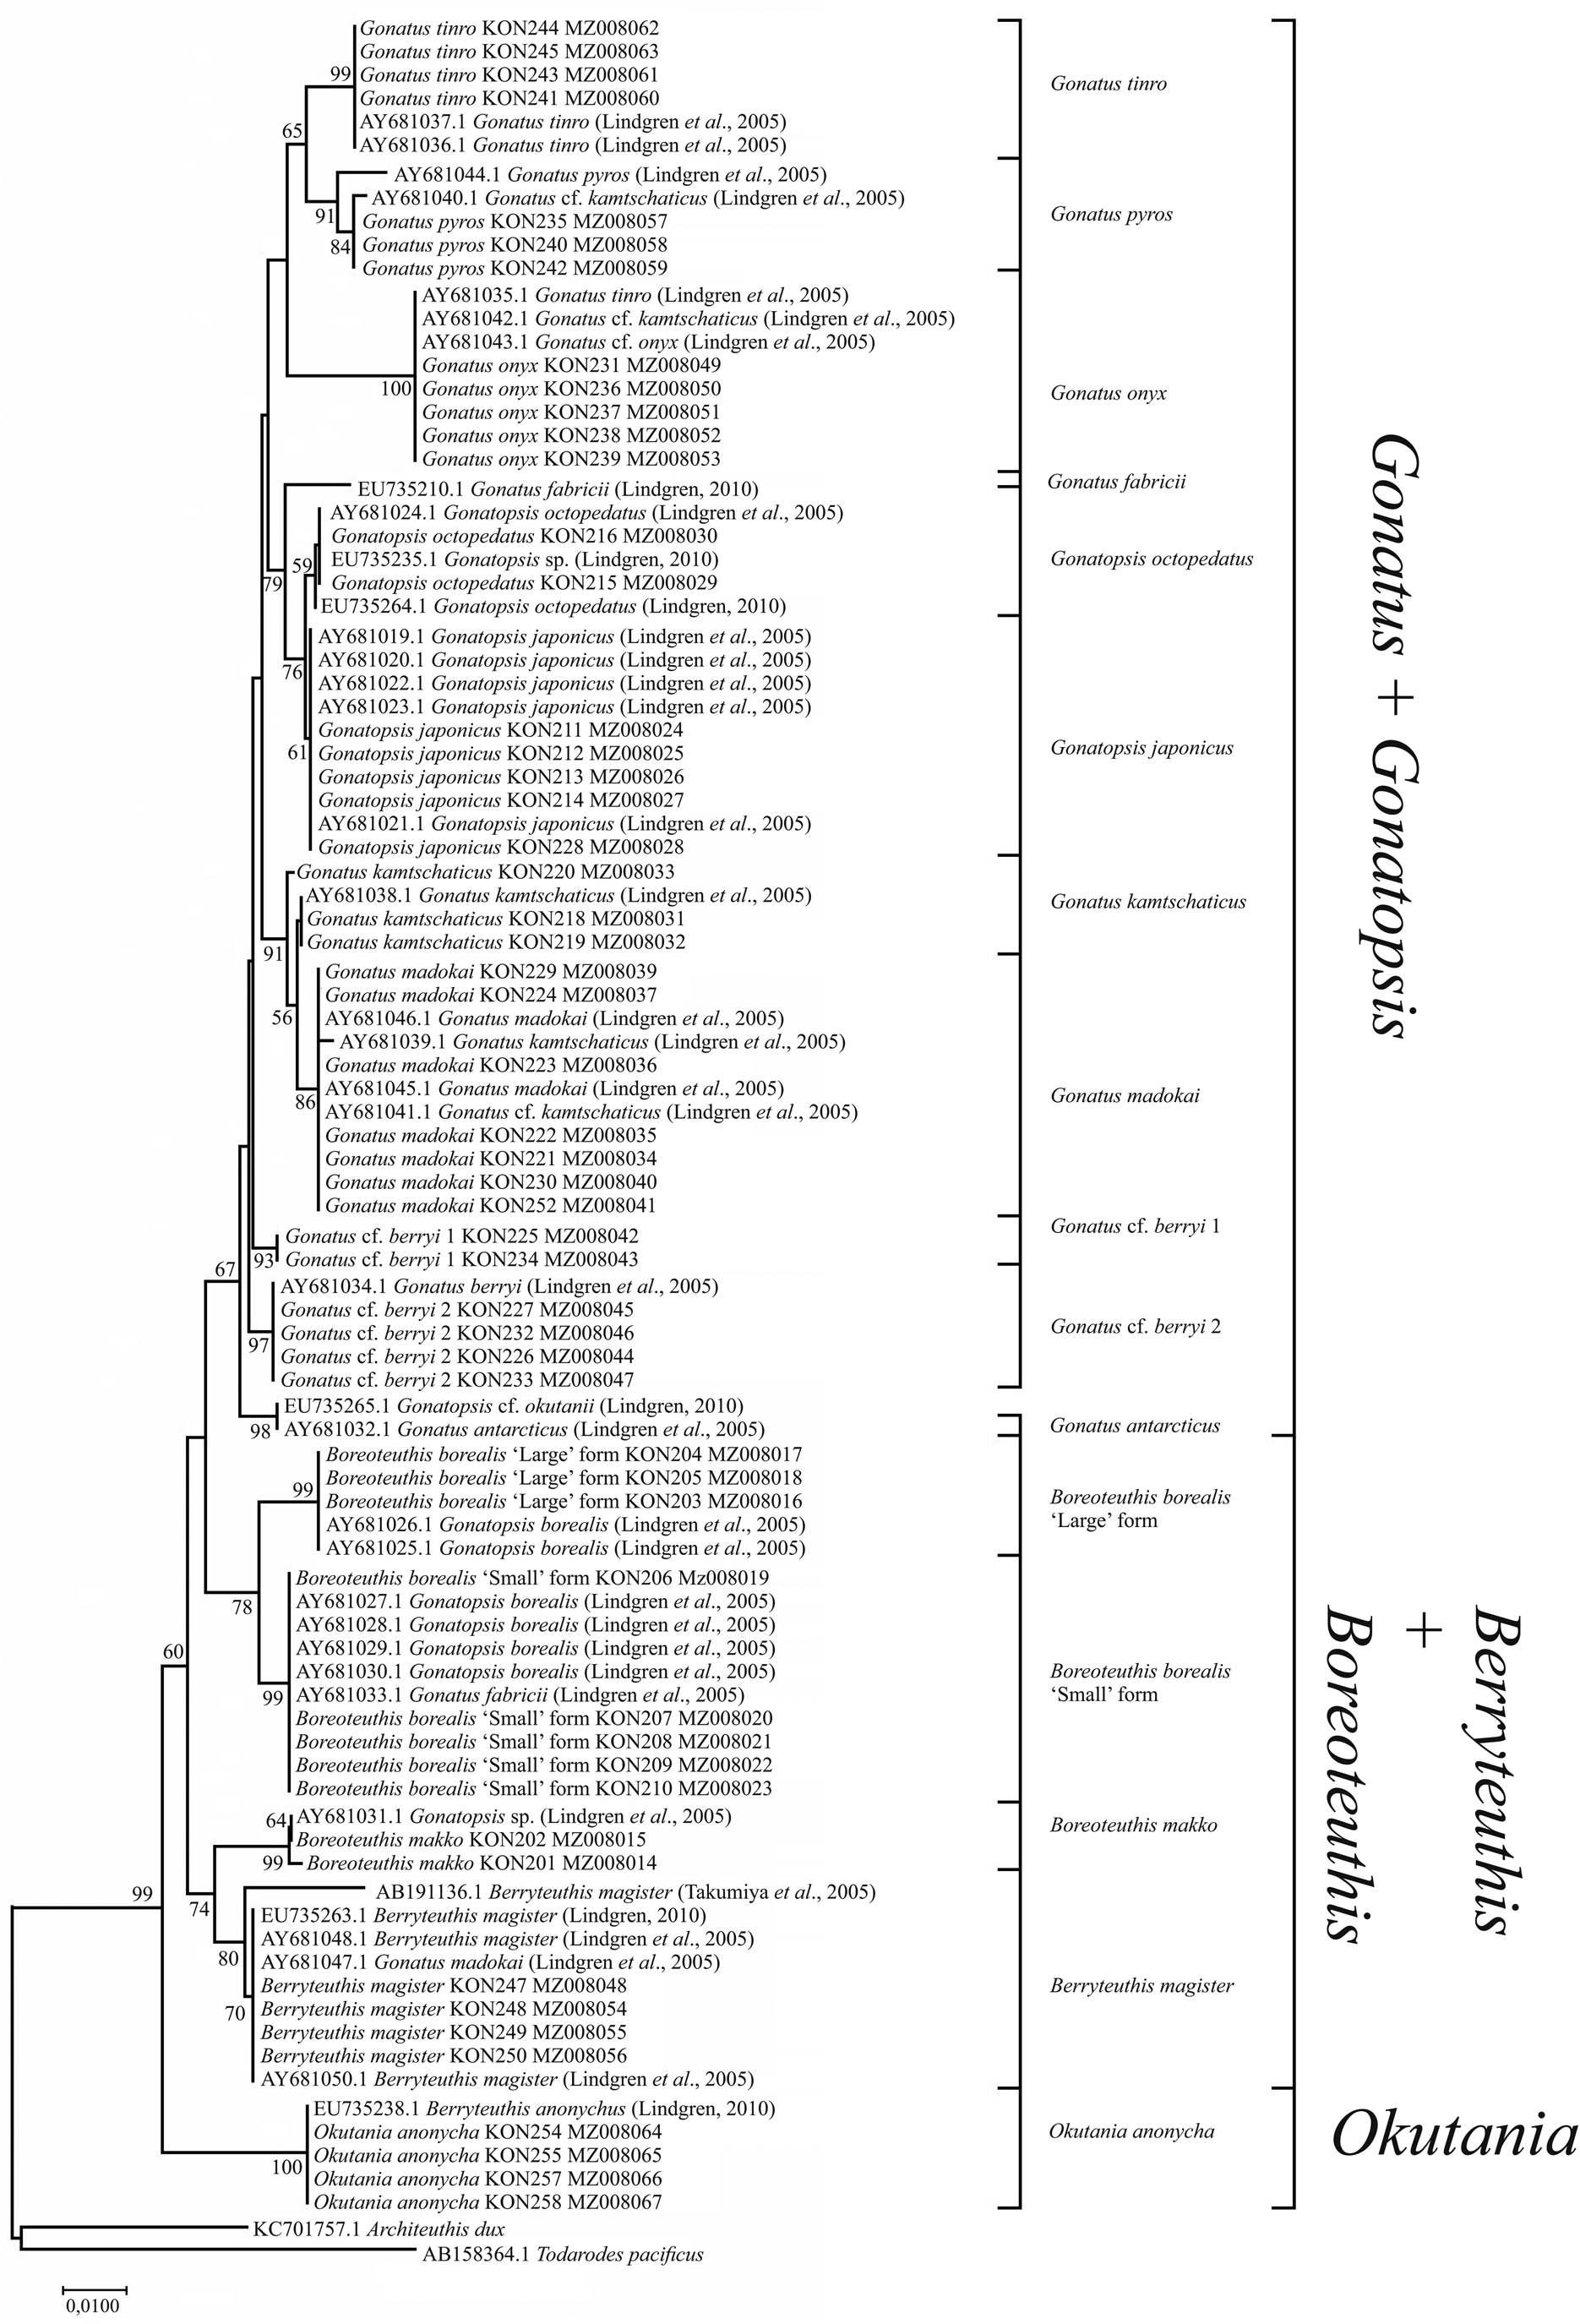
16S consensus tree generated by MCMC BA tree reconstruction and ML method for individuals from the family Gonatidae only from our collection (Table 1) and for all analysed specimens including those from the GenBank (Supplementary Table S1). Support levels for branches are shown for three approaches of tree reconstruction (%) in the following order: BA/ML.
12S rRNA
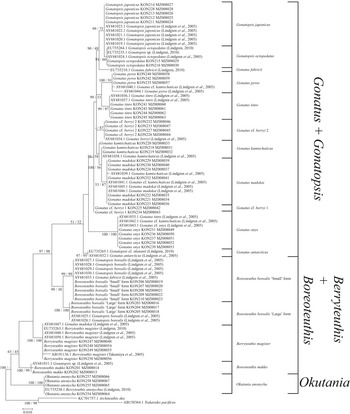
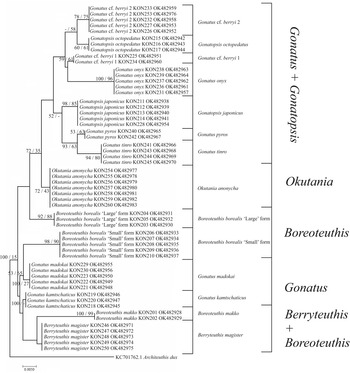
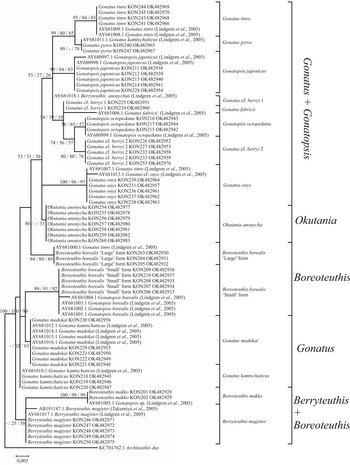
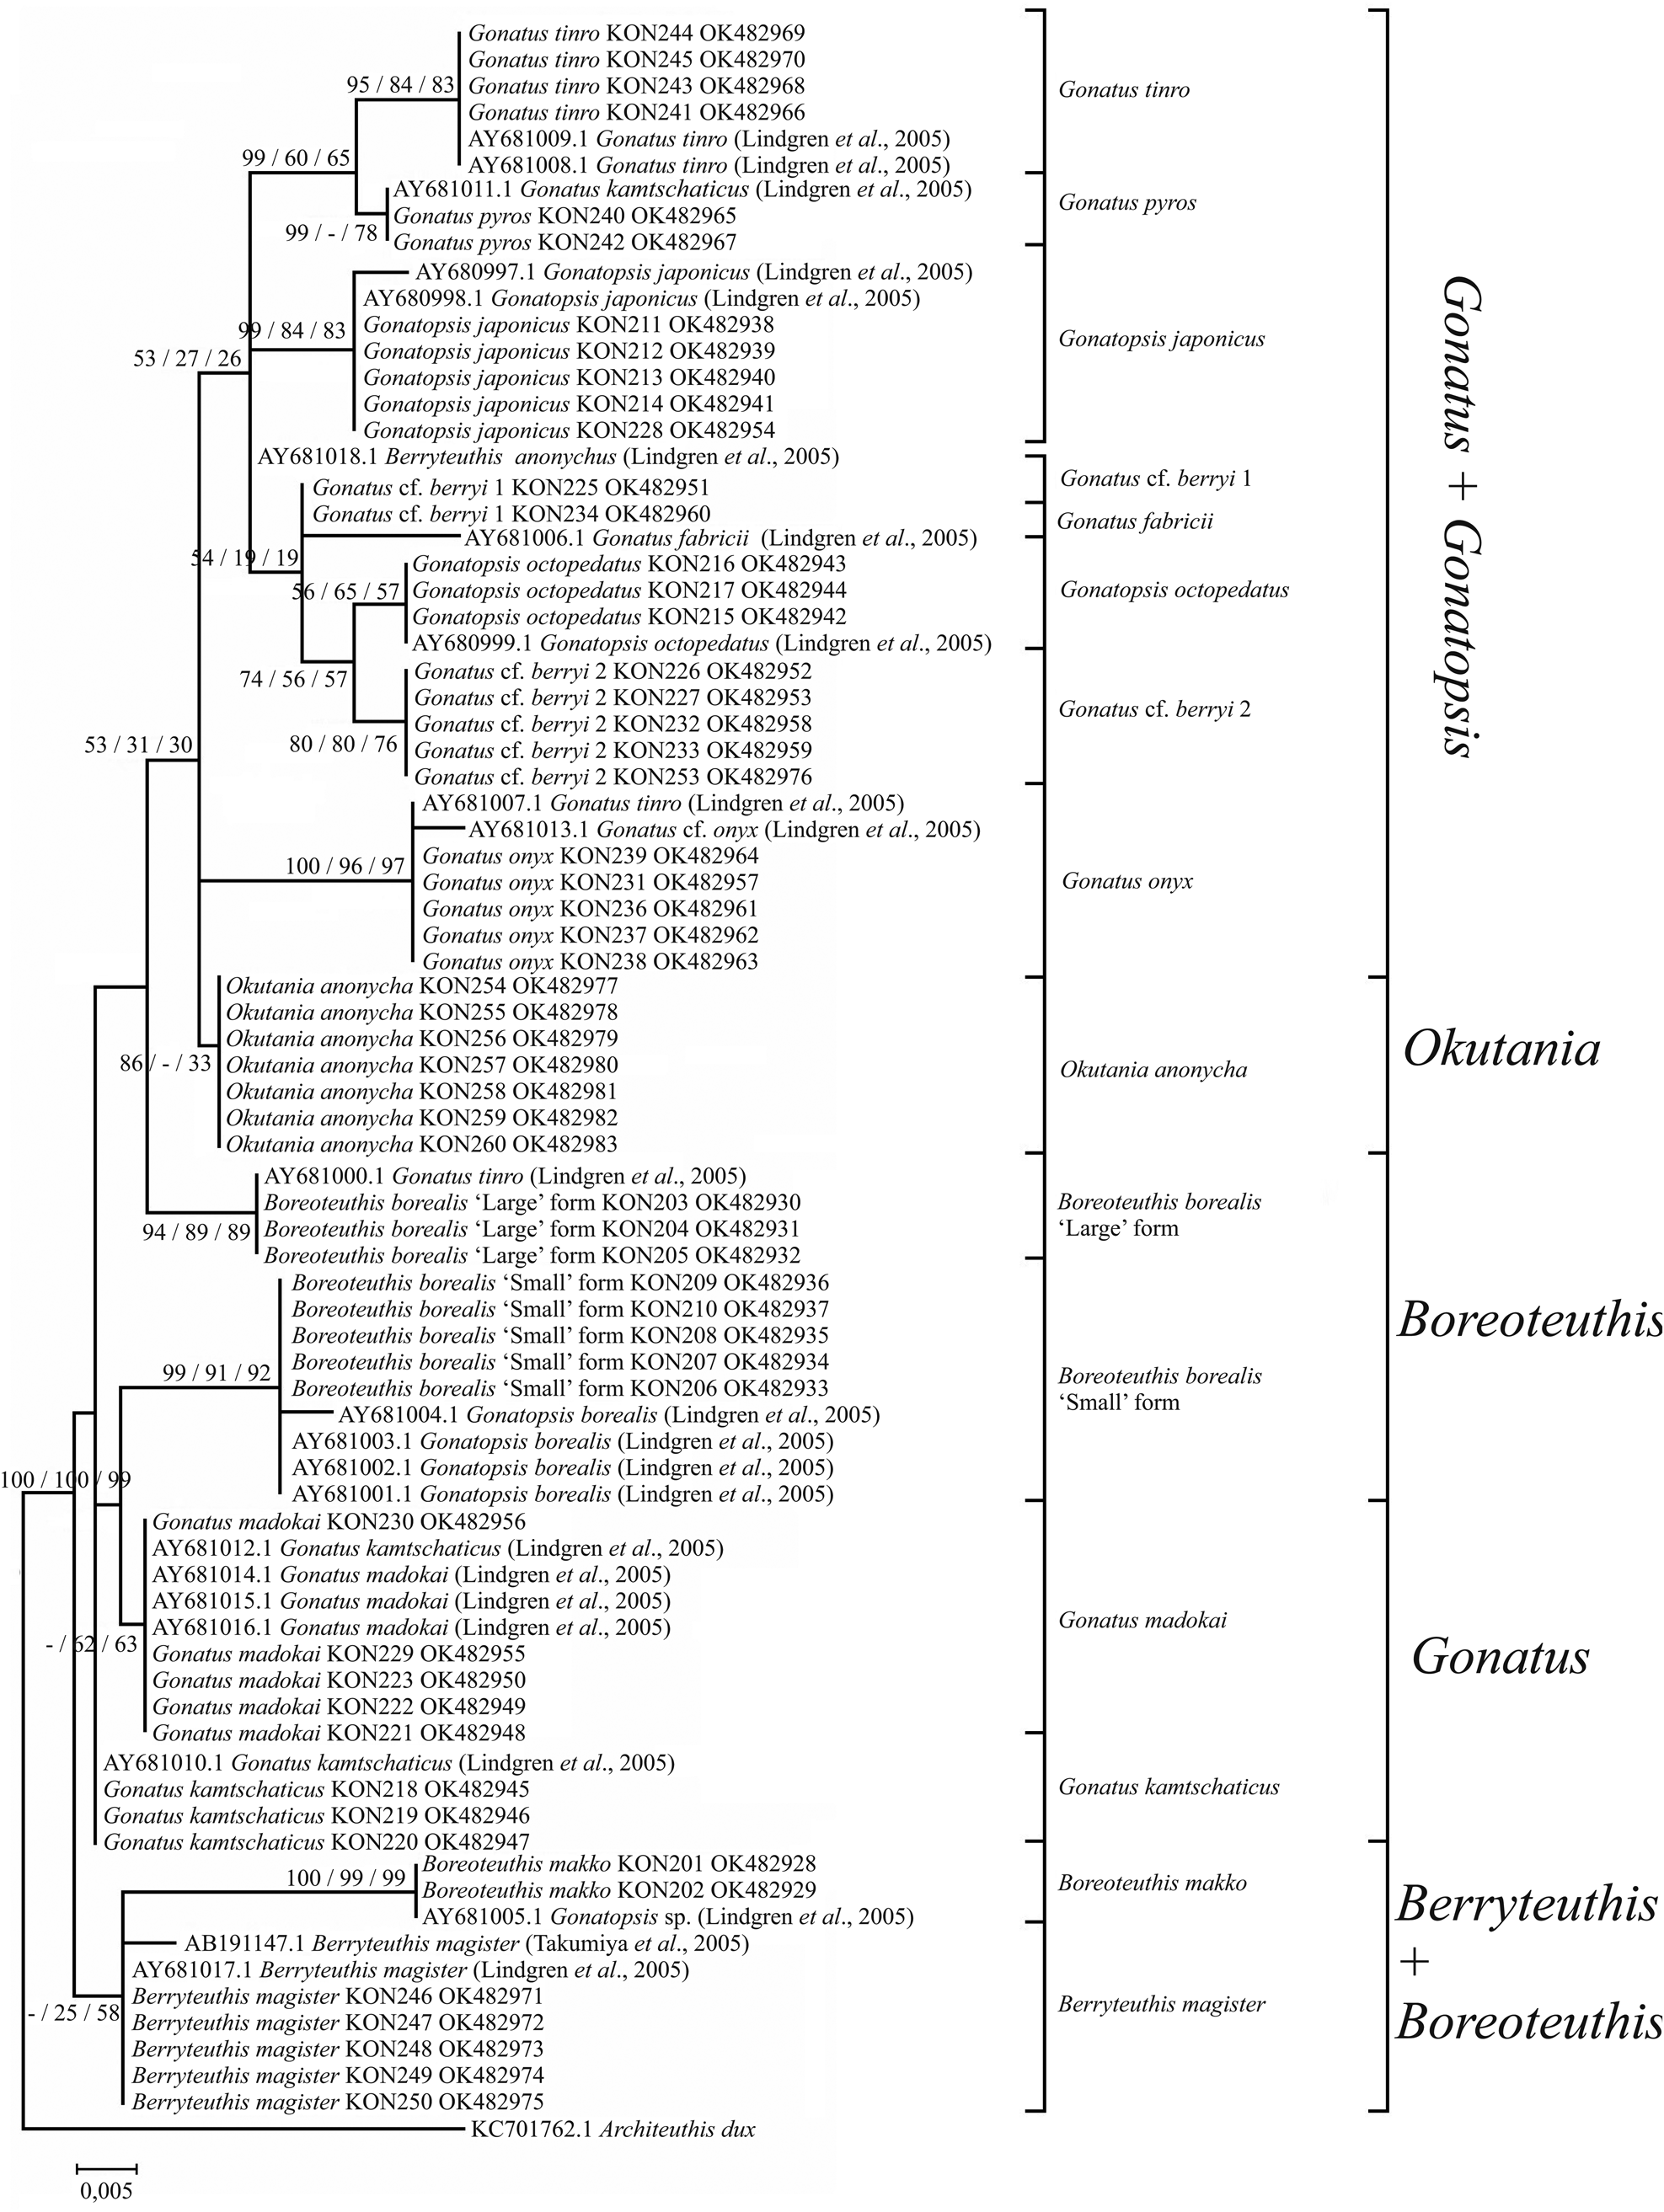
Phylogenetic trees constructed for the 12S rRNA sequences of our Gonatidae samples using the NJ (Figure 9) and BA + ML (Figure 10) were virtually similar, and produced rather specific relationships between the ‘species’ groups. In most cases, combinations of clusters yielded low bootstrap values, and tree topologies did not show clear arrangements of ‘species’ clusters into major groups, which were evident on the CO1 and 16S reconstructions. Within the Gonatus + Gonatopsis group, relatively high (about 60%) bootstrap values were obtained for only two ‘species’ pairs when both our original data set and the combined array of our and GenBank data were used in the analysis: (1) G. cf. berryi 2 + G. octopedatus (P = 0.8%); and (2) G. pyros + G. tinro (P = 0.14%). B. borealis ‘small’ form and B. borealis ‘large’ form (P = 1.6%), appeared in different branches on the BA + ML trees, and showed up as sister clades on NJ reconstruction with a bootstrap value lower than 50%. O. anonycha appeared within the low-supported group of Gonatus and Gonatopsis, and G. madokai and G. kamtschaticus appeared outside that group on all the trees. Of particular interest, B. makko + B. magister (P = 2%) formed a group as two sister-species on both the NJ and BA + ML trees. Reconstructions based on the 12S rRNA sequences for a combined array of our and GenBank samples yielded similar topologies on the NJ and BA + ML trees, and are represented here as a single graph (Figure 11). Two sister groups had bootstrap support greater than 50%: (1) G. pyros + G. tinro and (2) G. cf. berryi 2 + G. octopedatus. Some species sequences from the GenBank clustered with other species, e.g. G. kamtschaticus with G. pyros and with G. madokai; and G. tinro with G. onyx (Supplementary Table S1). Those specimens from the GenBank were most probably misidentified. Berryteuthis anonychus (AY681018.1, Lindgren et al., Reference Lindgren, Katugin, Amezquita and Nishiguchi2005) (=O. anonycha) appeared as an unresolved unit. Finally, the GenBank sequence for Gonatopsis sp. (AY681005.1, Lindgren et al., Reference Lindgren, Katugin, Amezquita and Nishiguchi2005) clustered with B. makko, indicating that these sequences belong to one species.
12S tree generated by NJ method for individuals from the family Gonatidae only from our collection (Table 1) and outgroup species.
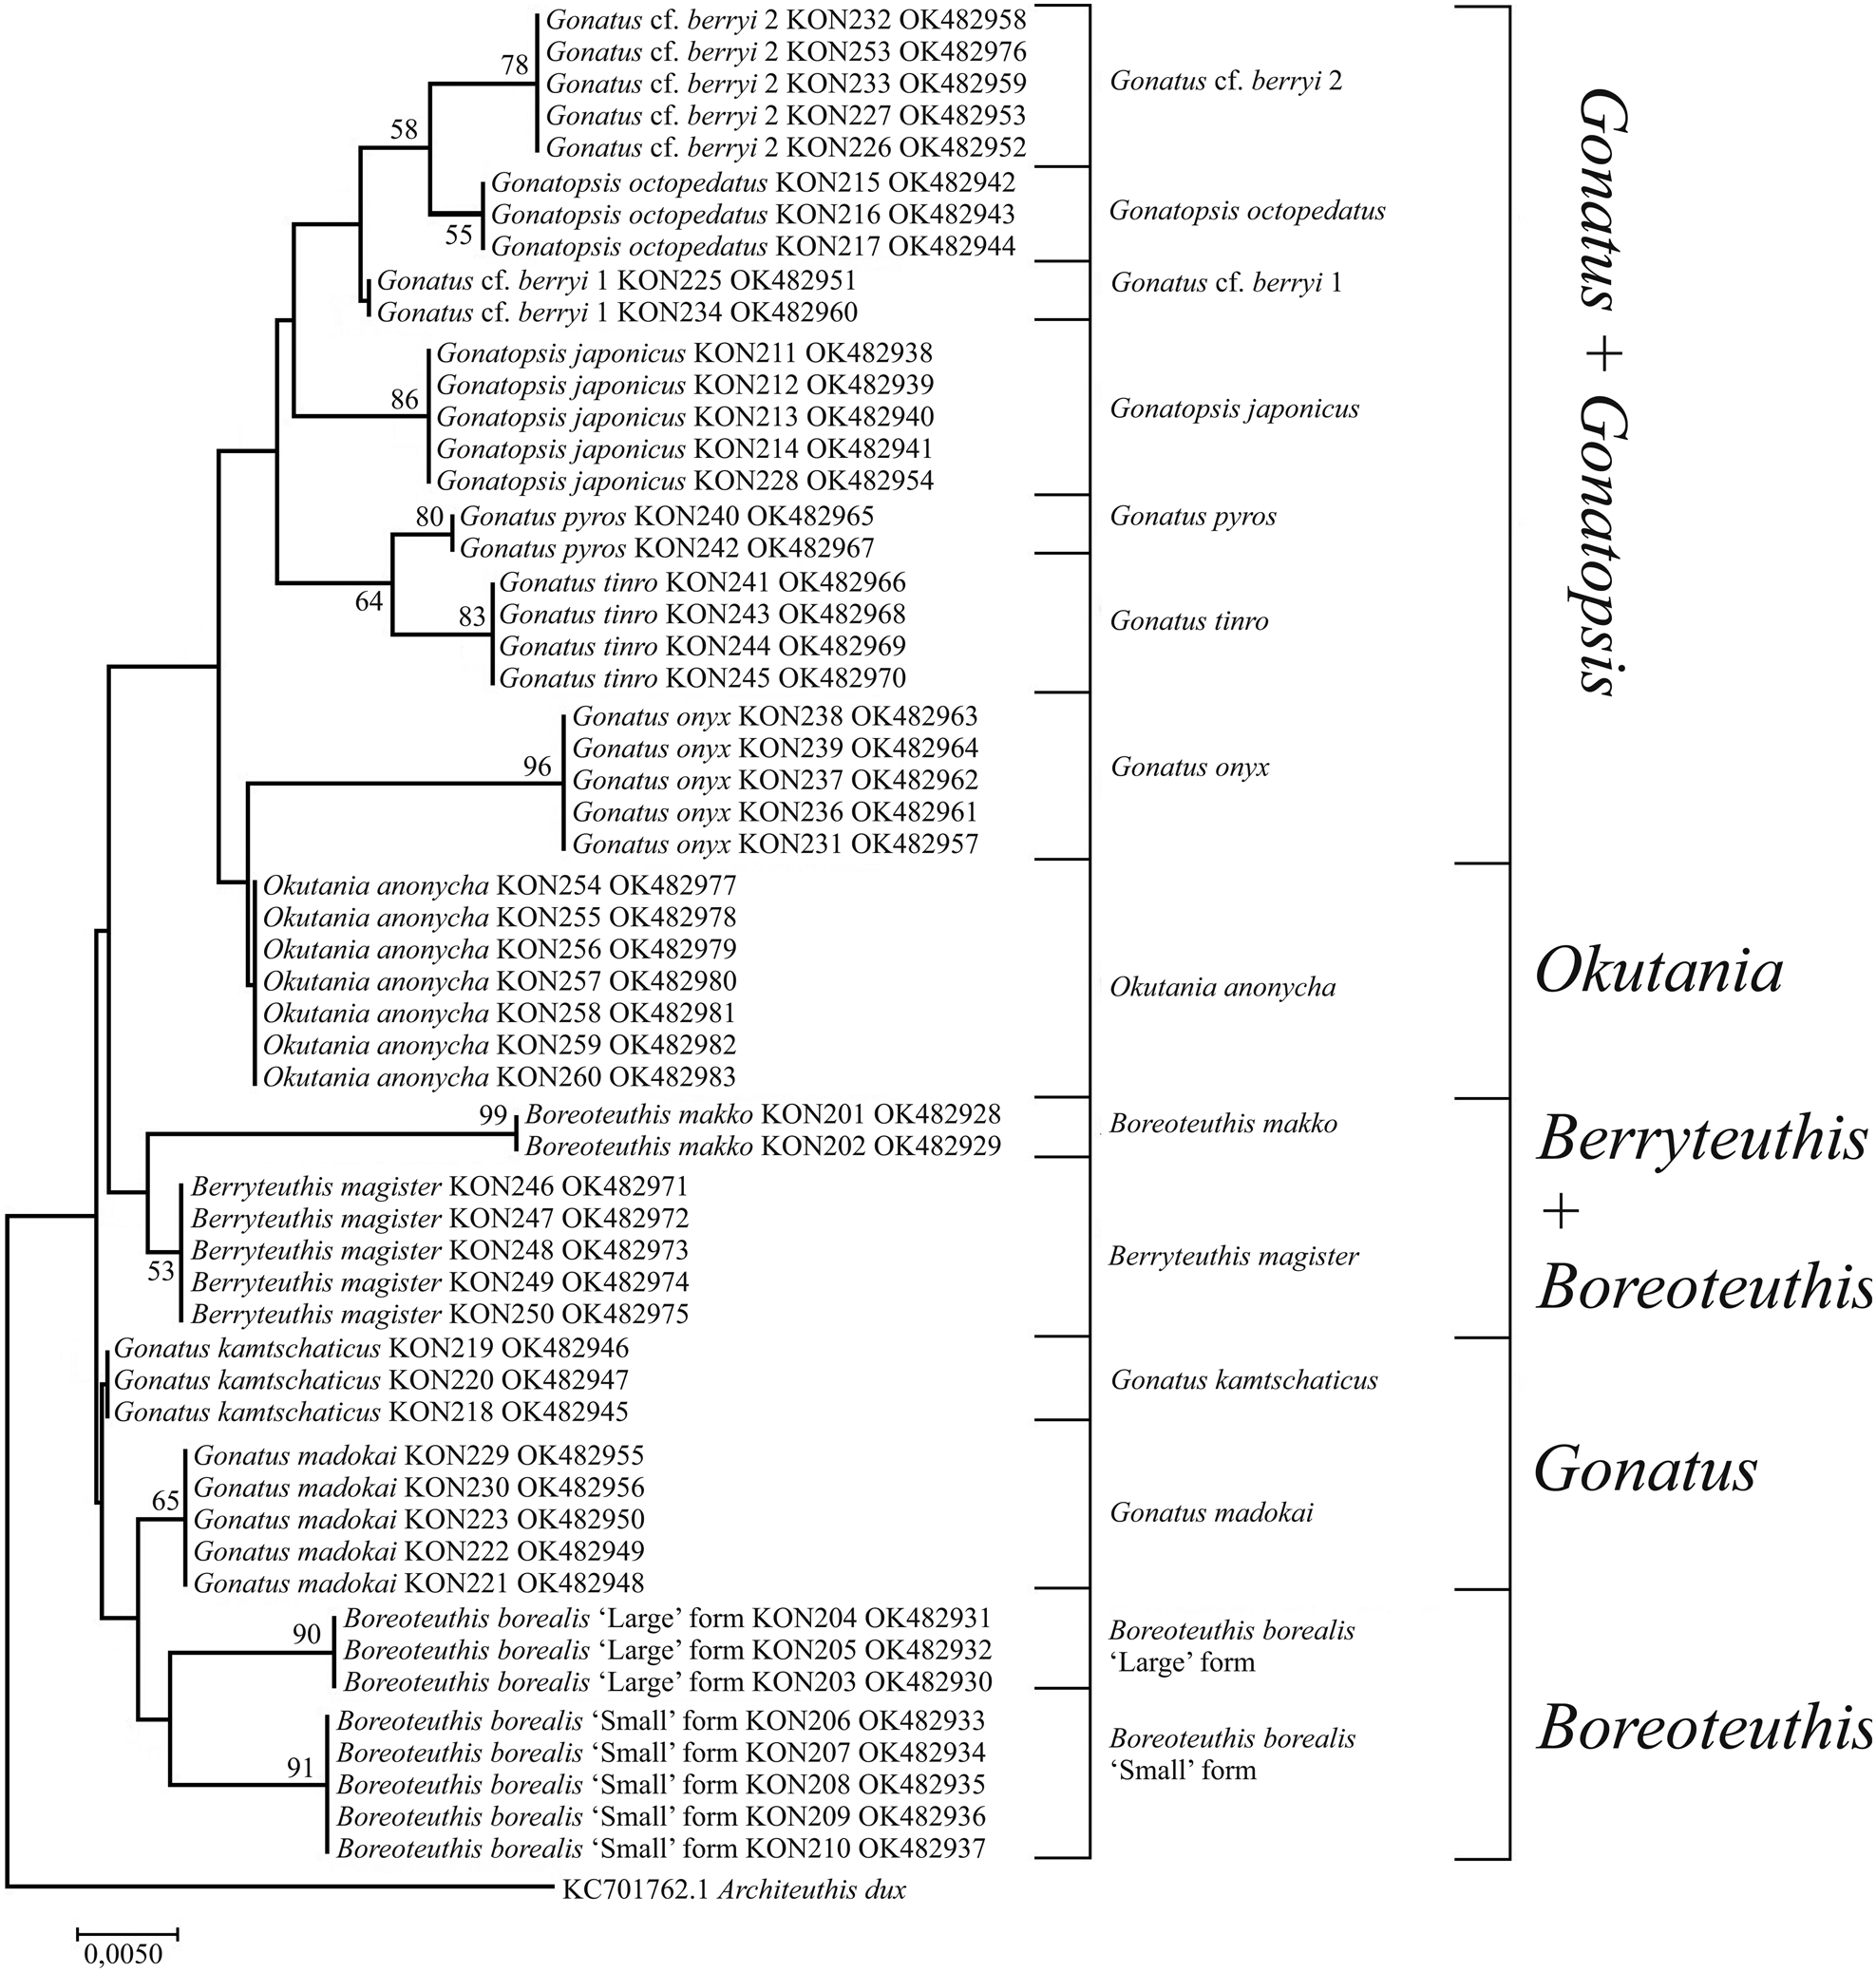
12S consensus tree generated by MCMC BA tree reconstruction and ML method for individuals from the family Gonatidae only from our collection (Table 1) and outgroup species. Support levels for branches are shown for three methods of tree reconstruction (%) in the following order: BA/ML.

12S consensus tree generated by MCMC BA tree reconstruction, ML, and NJ methods for individuals from the family Gonatidae only from our collection (Table 1) and for all analysed specimens including those from the GenBank (Supplementary Table S1). Support levels of branches are shown for three methods of tree reconstruction (%) in the following order: BA/ML/NJ.
28S
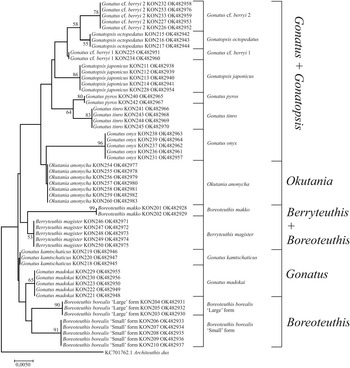
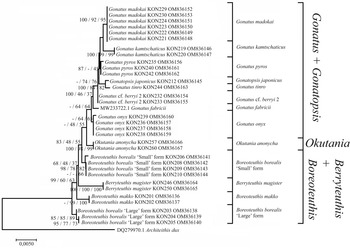
In the GenBank database, there was only one 28S sequence of 1635 bp for one gonatid specimen G. fabricii (MW233722.1, Fernandez-Alvarez et al., Reference Fernández-Álvarez, Taite, Vecchione, Villanueva and Allcock2021). The 28S phylogenetic trees using the NJ and BA + ML for 12 originally sequenced gonatid species plus one species G. fabricii from the GenBank were identical and differed only in posterior probabilities and bootstrap support values; therefore, one tree was represented and analysed (Figure 12). On that tree, each species formed either a separate cluster or a branch. One pair of sister-species was evident on the graph: (1) G. madokai + G. kamtschaticus (P = 0.38%). B. borealis ‘small’ form and B. borealis ‘large’ form appeared as different clusters on clearly separated branches. All five-toothed gonatids (Gonatus and Gonatopsis) formed a large group with a bootstrap support 64%, and all seven-toothed gonatids (O. anonycha; B. makko; B. borealis ‘small’; B. borealis ‘large’; and B. magister) clustered as separate species at the base of the graph.
28S consensus tree generated by MCMC BA tree reconstruction, ML, and NJ methods for individuals from the family Gonatidae only from our collection (Table 1) and for all analysed specimens including those from the GenBank (Supplementary Table S1). Support levels for branches are shown for three methods of tree reconstruction (%) in the following order: BA/ML/NJ.

18S
Phylogenetic analysis of the 18S based on the combined array of 54 original sequences and 7 sequences for the Gonatidae from the GenBank did not yield clear patterns and interpretable clustering on the NJ and BA + ML trees.
Combined data analysis
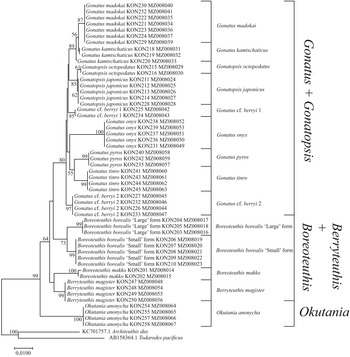
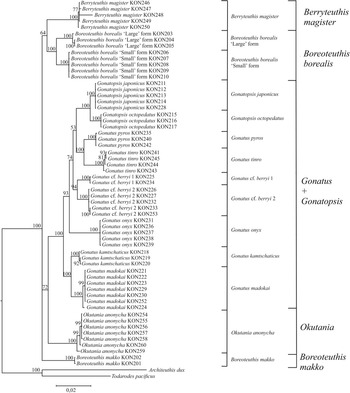
Consensus trees constructed using BA (Figure 13) and ML (Figure 14), and based on all five gene markers for the Gonatidae from our collection and the two outgroup squid species were similar in that they clearly separated all individual squid species (‘species’ clusters) as well as a number of species groups with high bootstrap support and pp values. On both phylogenetic reconstructions (using ML and BA approaches), robust monophyly was revealed which was supported by high bootstrap and pp values for the each species within the family Gonatidae.
Consensus tree generated for the combined CO1, 16S, 18S, 12S, and 28S data by ML method for individuals from the family Gonatidae only from our collection (Table 1) and outgroup species.

Consensus tree generated for the combined CO1, 16S, 18S, 12S, and 28S data by MCMC BA tree reconstruction for individuals from the family Gonatidae only from our collection (Table 1) and outgroup species.
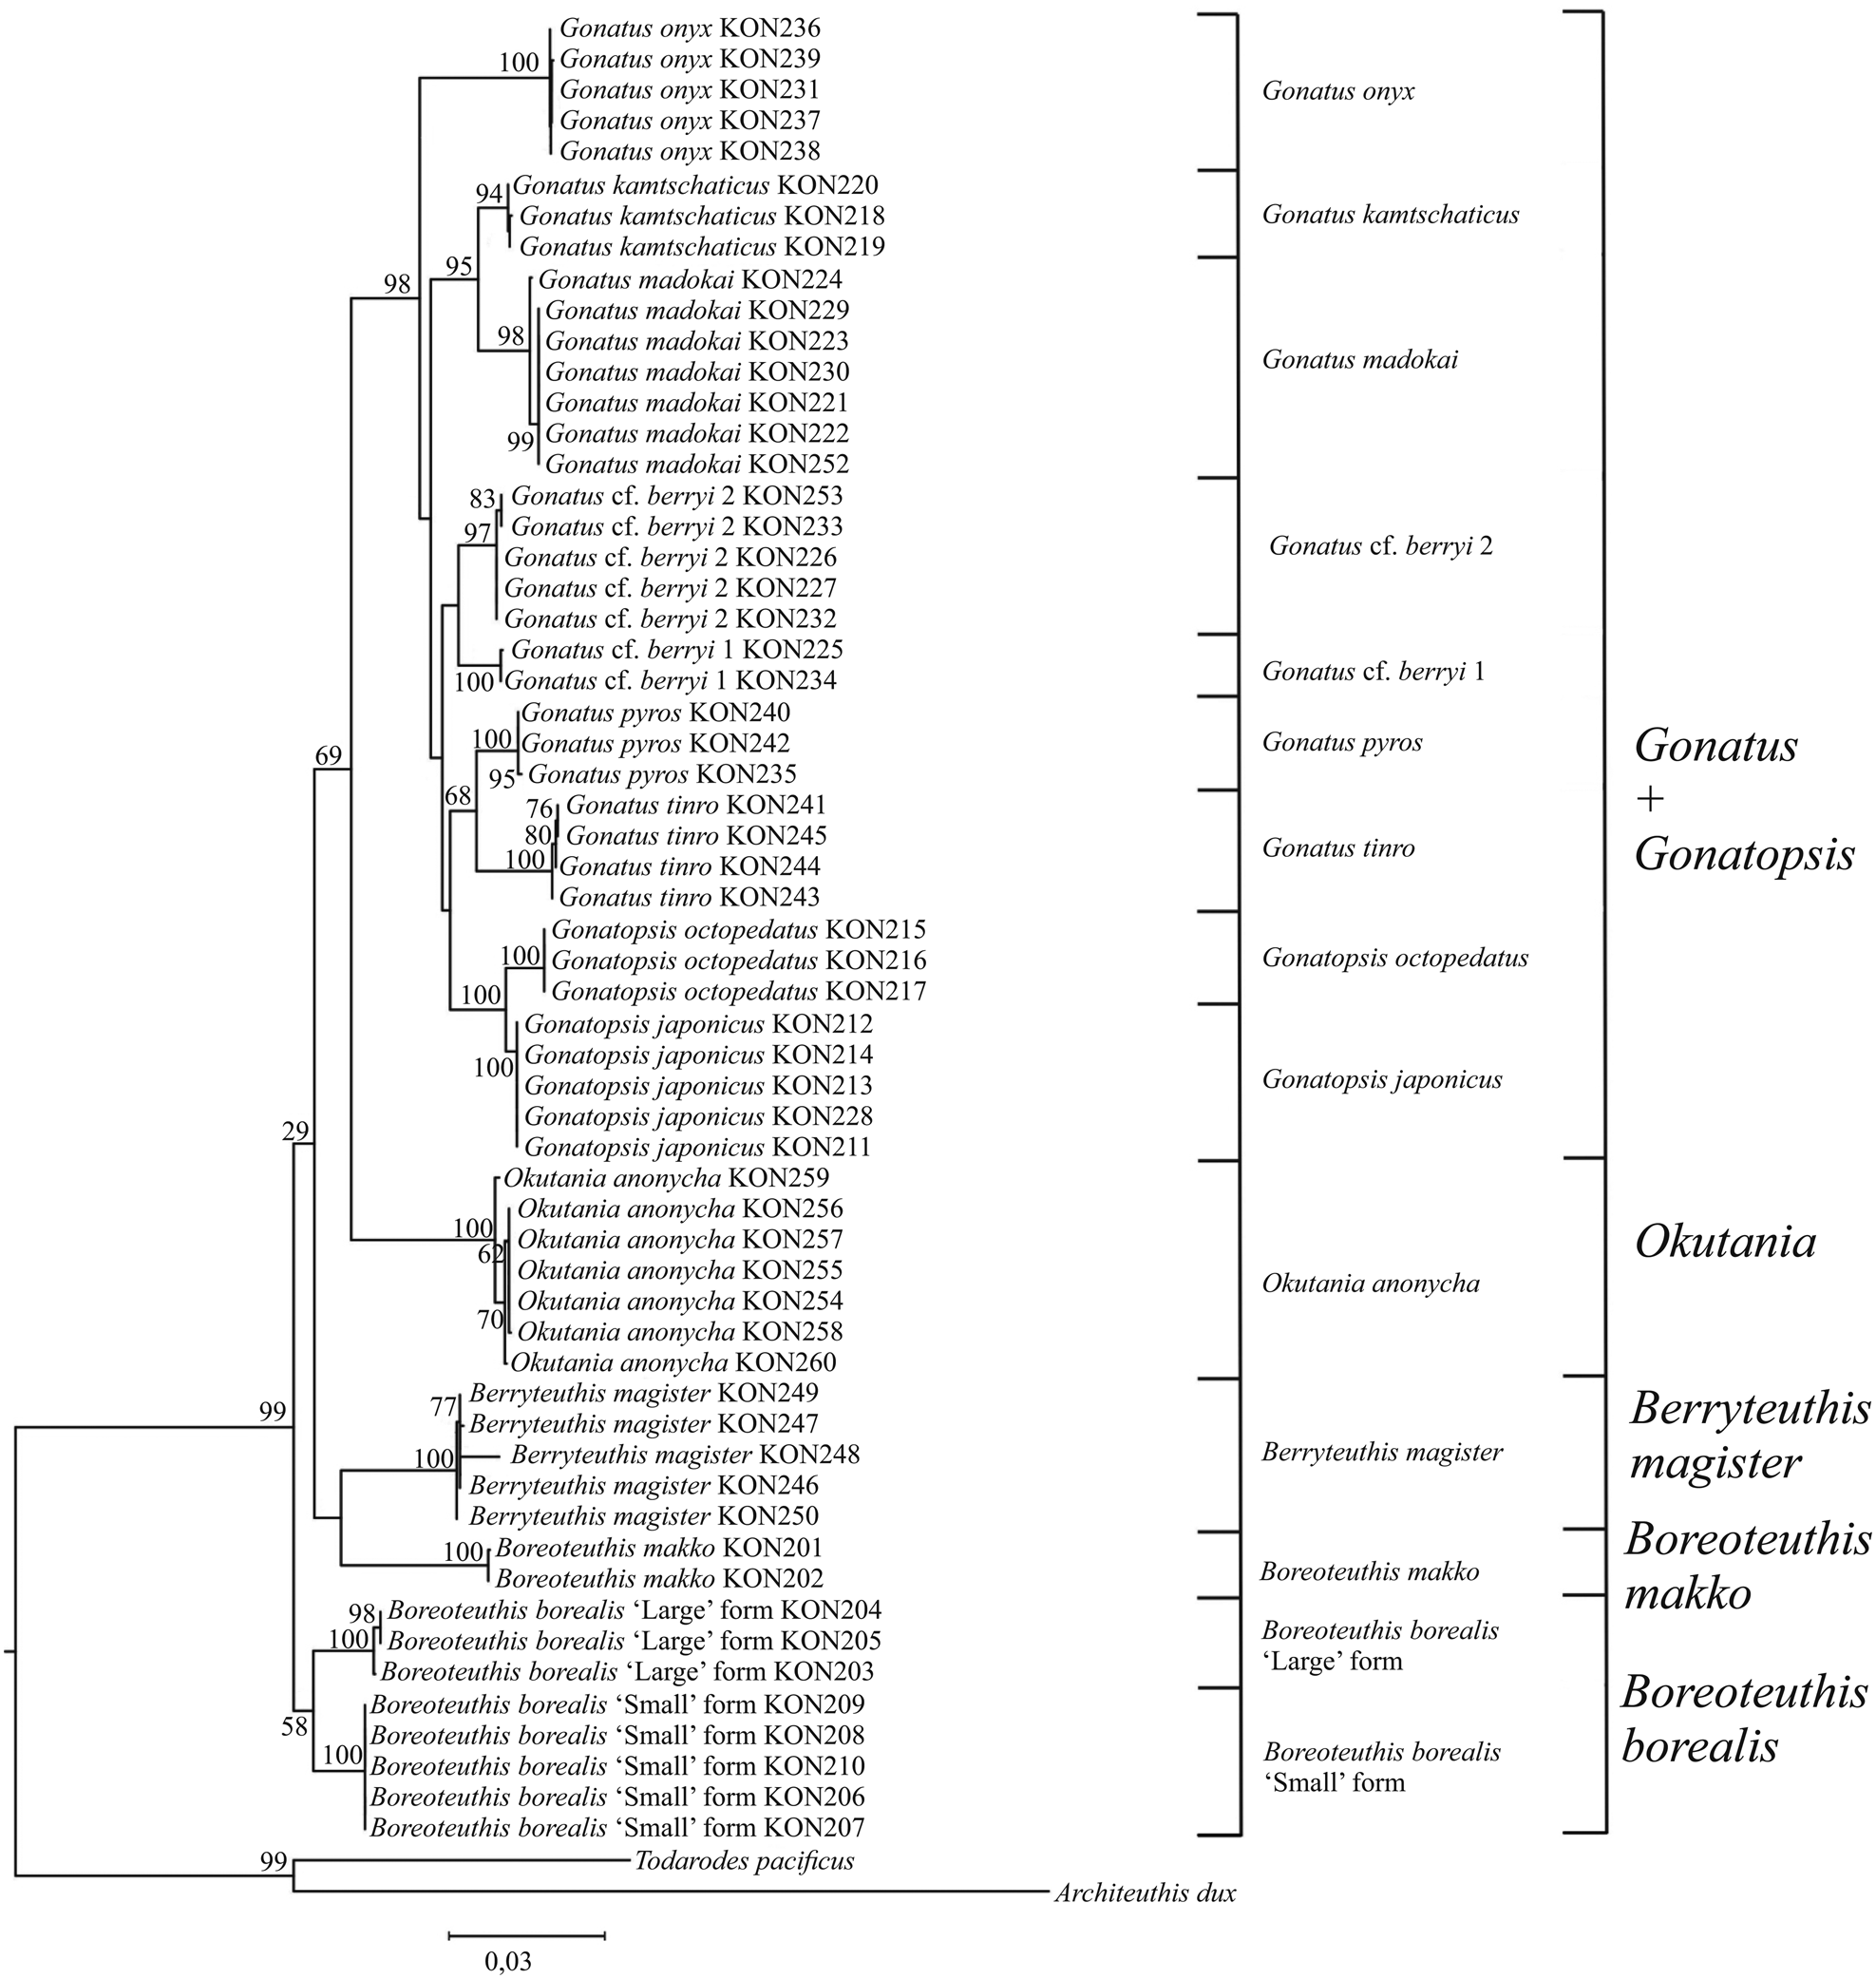
The main differences between the ML and BA topologies were observed in the branching of squid species with seven rows of teeth on the radula. On the ML reconstruction, there were three outbranchings: (1) two sister-species B. borealis ‘large’ form and B. borealis ‘small’ form; (2) two sister-species B. makko and B. magister; and finally (3) O. anonycha, which was the last to outbranch and appeared close to the group of species with five rows of teeth in the radula. Three basic clusters appear on the BA reconstruction: (1) B. makko; (2) ‘large’ and ‘small’ sister-forms of B. borealis along with B. magister, and (3) O. anonycha together with the group of species with five rows of teeth on the radula.
Discussion
Apart from two studies (Lindgren et al., Reference Lindgren, Katugin, Amezquita and Nishiguchi2005; Katugin et al., Reference Katugin, Chichvarkhina, Zolotova and Chichvarkhin2017), very few species of gonatid squids have been analysed using nucleotide sequence analysis, and those studies have provided only a general understanding on the relationships of selected species, either within the class Cephalopoda as a whole (Carlini and Graves, Reference Carlini and Graves1999; Takumiya et al., Reference Takumiya, Kobayashi, Tsuneki and Furuya2005) or among the modern families within the order Teuthida (Lindgren, Reference Lindgren2010). DNA barcoding based on the CO1 sequencing has proved to be an effective tool in distinguishing between different species in most of the main animal groups, including the phylum Mollusca (Folmer et al., Reference Folmer, Black, Hoeh, Lutz and Vrijenhoek1994; Anderson, Reference Anderson2000; Giribet et al., Reference Giribet, Okusu, Lindgren, Huff, Schrödl and Nishiguchi2006; Chen et al., Reference Chen, Li, Kong and Yu2011), in particular, the class Cephalopoda (e.g. Carlini and Graves, Reference Carlini and Graves1999; Takumiya et al., Reference Takumiya, Kobayashi, Tsuneki and Furuya2005; Dai et al., Reference Dai, Zheng, Kong and Li2012; Wen et al., Reference Wen, Tinacci, Acutis, Riina, Xu, Zeng, Ying, Chen, Guardone, Chen, Sun, Zhao, Guidi and Armani2017; Maggioni et al., Reference Maggioni, Tatulli, Montalbetti, Tommasi, Galli, Labra, Pompa and Galimberti2020; Afiati et al., Reference Afiati, Subagiyo, Handayani, Hartati and Kholilah2022). It was shown earlier that partial sequencing of the CO1 gene marker (658 bp) can be successfully used for species identification in the family Gonatidae (Katugin et al., Reference Katugin, Chichvarkhina, Zolotova and Chichvarkhin2017).
However, in some cases, more than one gene is needed to ensure clear species identification, especially among closely related species (Vences et al., Reference Vences, Thomas, van der Meijden, Chiari and Vieites2005; Barr et al., Reference Barr, Cook, Elder, Molongoski, Prasher and Robinson2009; Lv et al., Reference Lv, Wu, Zhang, Chen, Feng, Yuan, Jia, Deng, Wang, Wang, Mei and Lin2014; Liu et al., Reference Liu, Jiang, Song, Tornabene, Chabarria, Naylor and Li2017; Chan et al., Reference Chan, Saralamba, Saralamba, Ruangsittichai and Thaenkham2022). A number of studies suggest that, in particular, the CO1 marker does not necessarily yield good results in distinguishing between species; known exceptions include the Actinopterygii (Mabragaña et al., Reference Mabragaña, de Astarloa JM, Hanner, Zhang and González Castro2011), Porifera (Schröder et al., Reference Schröder, Efremova, Itskovich, Belikov, Masuda, Krasko, Müller and Müller2003; Neigel et al., Reference Neigel, Domingo and Stake2007), Anthozoa (Shearer et al., Reference Shearer, Van Oppen, Romano and Wörheide2002), Aranea (Spasojevic et al., Reference Spasojevic, Kropf, Nentwig and Lasut2016), and Aves (Aliabadian et al., Reference Aliabadian, Beentjes, Roselaar, van Brandwijk, Nijman and Vonk2013).
One of the first molecular markers used in the analysis of phylogenetic relationships among cephalopods was 16S rRNA (Bonnaud et al., Reference Bonnaud, Boucher-Rodoni and Monnerot1994). Phylogenetic trees clearly separated species, genera, and families in some teuthoids but included only a few gonatid squids (Bonnaud et al., Reference Bonnaud, Boucher-Rodoni and Monnerot1994; Bonnaud and Boucher-Rodoni, Reference Bonnaud and Boucher-Rodoni2002). The 16S rRNA gene proved to be a valuable tool for delimitation of different squid genera (Sanchez et al., Reference Sanchez, Setiamarga, Tuanapaya, Tongtherm, Winkelmann, Schmidbaur, Umino, Albertin, Allcock, Perales-Raya, Gleadall, Strugnell, Simakov and Nabhitabhata2018), and this marker was recommended as a barcode sequence for the class Cephalopoda (Sanchez et al., Reference Sanchez, Tomano, Umino, Wakabayashi and Sakai2016).
The use of 16S rRNA sequences in a study of the species complex Sepia pharaonis (Anderson et al., Reference Anderson, Valinassab, Ho, Mohamed, Asokan, Rao, Nootmorn, Chotiyaputta, Dunning and Lu2007) was further enhanced by adding CO1 into the analysis (Anderson et al., Reference Anderson, Engelke, Jarrett, Valinassab, Mohamed, Asokan, Zacharia, Nootmorn, Chotiyaputta and Dunning2011). The combined use of 16S rRNA and CO1 was also successful in a population genetic study of the short-finned ommastrephid squid Illex argentinus (Roldán et al., Reference Roldán, Planella, Heras and Fernández2014), as well as for species identification and defining of phylogenetic relationships within the squid family Onychoteuthidae (Bolstad et al., Reference Bolstad, Braid, Strugnell, Lindgren, Lischka, Kubodera, Laptikhovsky and Labiaga2018).
Combined use of 12S rRNA and 16S rRNA sequences was used to suggest the paraphyletic nature of the cuttlefish genus Sepia and the absence of a direct relationship between geographic distribution and systematics in this genus (Bonnaud et al., Reference Bonnaud, Lu and Boucher-Rodoni2006). Joint use of 28S and 18S sequences was used to propose phylogenetic relationships among 24 species of coleoid (mainly decapodan) and nautiloid cephalopods (Bonnaud and Boucher-Rodoni, Reference Bonnaud and Boucher-Rodoni2002). The research reported here appears to be the first to use an array of all the above-mentioned five gene markers in the analysis of species divergence in the family Gonatidae, using them both separately and combined to generate consensus phylogenies.
Among gene markers of potential use in distinguishing between molluscan species, 18S has been included with 28S (Lindgren et al., Reference Lindgren, Giribet and Nishiguchi2004) but there were recommendations to use 18S very carefully, particularly for phylogenetic analysis, in other molluscan taxa as well as in the Cephalopoda (Bonnaud and Boucher-Rodoni, Reference Bonnaud and Boucher-Rodoni2002). In the present study, a part of 18S (400 bp) was used for the first time to estimate its applicability for distinguishing between the species of the Gonatidae, and it appeared that only one species, B. magister, was clearly distinguished while the other 13 gonatid species was a poorly resolved group. The ABGD analyses and phylogenetic reconstructions using 18S were unable to resolve either species (except for B. magister) or species groups and genera in the Gonatidae. Despite the existence of an insertion in the B. magister 18S sequence and a number of species-specific nucleotide changes (Supplementary Table S7), the resultant low level of between-species differentiation with the 18S marker (with seven parsimony-informative sites) did not support morphologically identifiable species in most cases. Therefore, 18S cannot be considered a suitable molecular marker for the purposes of either barcoding or phylogenetic analysis for the Gonatidae. All the other analysed gene markers were highly informative and revealed separate groups or clusters, which could be considered as different species with relatively high values of support and probabilities. The use of an assemblage of gene markers proved to be effective in species identification and will presumably aid further phylogenetic analyses of the Gonatidae.
The present study found that patterns of differentiation among the gonatid species are similar for the four molecular markers 12S rRNA, 16S rRNA, 28S, and CO1. However, the 12S rRNA, 16S rRNA, and 28S P-distances between different species and between individuals within a species were significantly smaller compared to the respective CO1 P-distances (Supplementary Tables S2–S5). Subdivision of the Gonatidae into species based on the 12S rRNA, 16S rRNA, and 28S sequence analysis generally followed the reciprocal monophyly criterion (Kizirian and Donnelly, Reference Kizirian and Donnelly2004) but it did not fit the ‘10× rule’, according to which the level of divergence between species is at least ten times higher than that within a species (Hickerson et al., Reference Hickerson, Meyer and Moritz2006). In contrast, CO1 met both criteria. The ABGD approach also suggested that CO1 sequences distinguished among the gonatid species more clearly than 12S rRNA, 16S rRNA, or 28S. However, the latter three gene sequences were more effective than the conventional barcode CO1 in a number of cases, such as in separation between G. cf. berryi 1 and G. cf. berryi 2, and between large- and small-sized B. borealis, thus corroborating species level divergence between morphologically similar forms.
Analyses of the Gonatidae samples from our collection suggested that, among squid individuals matching the morphological description of G. berryi, there were two morphologically similar but genetically different groups. They appeared as independent clusters on gene trees, and can presumably be considered as separate species (Figures 1, 2, 5, 6, 9, and 10). Sequences of 16S rRNA and 12S rRNA were better than CO1 for resolving G. cf. berryi 1 and G. cf. berryi 2. On the 16S rRNA and 12S rRNA gene trees, these ‘species’ appeared in different lineages but as sister clades on the CO1 reconstruction (with 0.88 pp and 38% bootstrap support).
When sequences from the GenBank were added to the analyses of the Gonatidae, specimens identified as G. berryi (GenBank) and G. cf. berryi (our data) appeared in three different branches on the CO1 tree, and in two clades on the 12S rRNA and 16S rRNA trees. This observed split of G. berryi into separate lineages suggested the existence of hidden taxonomic differences among the examined squid with similar morphological traits. Which of those taxa are actually G. berryi is a matter of speculation at present and further research into the taxonomy of this complex of morphologically similar species is needed.
On the 16S rRNA tree, G. cf. berryi 2 appeared in one group with G. berryi AY681034.1 (from Lindgren et al., Reference Lindgren, Katugin, Amezquita and Nishiguchi2005). However, on the СO1 tree, the same individuals of G. cf. berryi 2 from the Northwest Pacific clustered together with G. berryi AB749280.1 (from Bower et al., Reference Bower, Seki, Kubodera, Yamamoto and Nobetsu2012) and with G. californiensis (GU112109, GU112108, AF144724) from the Northeast Pacific. Such a pattern of clustering suggests either erroneous identification of specimens of G. californiensis from which sequences were deposited in the GenBank, or a much wider geographic distribution for this gonatid species, which was considered to be endemic to the eastern North Pacific and to represent the southernmost species of the genus Gonatus there (Young, Reference Young1972).
Since correct identification of these species is based primarily on tentacle club morphology, identification becomes difficult in individuals with broken tentacles; and other features, such as fin size and proportion, may provide important distinctions. Berry (Reference Berry1912) first described young individuals of G. fabricii with very large fins, and that morphological feature was the basis for establishing the new species G. berryi (Naef, Reference Naef and Naef1923). Later, the species was re-described and individuals with extremely large hooks, strongly differentiated tentacle clubs and large fins were considered to represent G. berryi (Young, Reference Young1972). In contrast, individuals with smaller hooks, a somewhat different arrangement of hooks and suckers on the tentacle clubs, and much smaller fins were placed by Young (Reference Young1972) into a new species, G. californiensis.
Our data on gonatid squid measurements (Katugin, unpublished) suggest that there exists individual variability in the above-mentioned morphological features and, in some cases, the so-called ‘species characters’ may overlap, which hampers correct identification, especially in individuals with missing or broken tentacles. Individuals that belong to G. cf. berryi 1 and G. cf. berryi 2 are characterized by a large, G. berryi-like central hook on the club manus but they present a wide variety of features such as the relative size of the fins, from ‘large’ fins characteristic of G. berryi to the (much) ‘smaller’ fins peculiar to G. californiensis. Undoubtedly, further research into the morphology of the genetically differentiated groups, provisionally named G. cf. berryi 1 and G. cf. berryi 2, is needed to determine their taxonomic status.
Although, in the Gonatidae, 12S rRNA, 16S rRNA, and 28S exhibited lower variability levels than CO1, the tree-free ABGD approach applied to all of four gene markers showed clear separation between large- and small-sized B. borealis, and P-distances indicated high levels of genetic divergence between these two groups (CO1: P = 5.2%; 12S: P = 1.6%; 16S: P = 1.3%; and 28S: P = 0.4%). Previously, tree-free ABGD using the CO1 sequence revealed significant differentiation between these two groups (Katugin et al., Reference Katugin, Chichvarkhina, Zolotova and Chichvarkhin2017). The molecular differences between these size cohorts may therefore indicate the presence of two different species within the B. borealis species complex. Representatives of the ‘large’ and ‘small’ cohorts in B. borealis differ from each other in a number of biological traits, such as size-at-maturity and (presumably) growth rates, and also in patterns of geographic distribution (Nesis, Reference Nesis1989; Nesis and Nezlin, Reference Nesis and Nezlin1993; Zuev et al., Reference Zuev, Katugin, Shevtsov and Dakus2007), which agrees with molecular evidence indicating that these two size cohorts are different taxonomic units presumably at the species rank.
Inclusion of sequence data for gonatid species available in the GenBank not only added valuable new information on the genetic subdivisions among the family members, but also revealed several inconsistencies, which should be considered in molecular phylogenetic studies of that group of squid. Sequence analyses from both our collection and GenBank suggested that, based on the CO1, 12S rRNA, 16S rRNA, and 28S tree topologies, such inconsistencies were revealed for the pair G. berryi–G. californiensis, and in the following taxa: G. pyros from the North Pacific, and morphologically very close G. fabricii and G. steenstrupi from the North Atlantic (Figure 3).
Species identified as G. pyros formed two sister clades on the CO1 and 16S rRNA trees. Those clusters had high bootstrap support of >90%. However, P-distances between them were small (1.3% for CO1; 0.9% for 16S rRNA). One group of G. pyros specimens consisted of individuals from our collection, which were captured in the northwestern Pacific Ocean, and of individuals from the GenBank. Another group was composed of animals from the GenBank alone. Though G. pyros is clearly separable from all other gonatids in being the only species with a large photophore on the ventral surface of each eye (Young, Reference Young1972), in some cases, shreds of eye tissue can be mistaken for a photophore, which may lead to a species misidentification. Further investigation of the ‘G. pyros’ group is needed to exclude possible erroneous species identification.
On the CO1 trees constructed for the combined data set (Figures 3 and 4) and using BA, ML, and NJ approaches, two nominal species, G. fabricii and G. steenstrupi, showed no genetic differentiation between each other, which concurred with the recently published study on identification of the North Atlantic cephalopods using morphology and DNA barcoding (Taite et al., Reference Taite, Vecchione, Fennell and Allcock2020). Sequences deposited in the GenBank under the name G. fabricii (Lindgren et al., Reference Lindgren, Katugin, Amezquita and Nishiguchi2005; Lindgren, Reference Lindgren2010) were used in our study. Specimens analysed by Taite et al. (Reference Taite, Vecchione, Fennell and Allcock2020), along with those from Vecchione et al. (Reference Vecchione, Young and Piatkowski2010), formed a single haplotype network, suggesting that they comprise one species. However, some individuals were morphologically identified as G. fabricii and some as G. steenstrupi. All of them differed genetically from G. fabricii collected from the Bear Seamount and in the Arctic (Lindgren, unpublished), which may indicate that they represent G. steenstrupi. Therefore, GenBank sequences of G. fabricii (Lindgren et al., Reference Lindgren, Katugin, Amezquita and Nishiguchi2005; Lindgren, Reference Lindgren2010) may in fact belong to G. steenstrupi. Possible misidentification could be due to significant overlap in morphological traits between these two closely related species, as pointed out earlier (e.g. Vecchione et al., Reference Vecchione, Young and Piatkowski2010). This example, along with the above-mentioned issues for some other gonatid species, highlights the importance of correct initial morphologically based species identification for further interpretation of the observed genetic divergence at the species level.
Three molecular markers (CO1, 16S rRNA, and 28S) have been beneficial in understanding the systematic relationships among the higher level taxonomic groups in the cephalopods (e.g. Lindgren, Reference Lindgren2010; Allcock et al., Reference Allcock, Lindgren and Strugnell2015; Sanchez et al., Reference Sanchez, Tomano, Umino, Wakabayashi and Sakai2016). In our study of the family Gonatidae, individual phylogenies constructed using sequences of four gene markers (i.e. with the addition of 12S rRNA to the other three) along with consensus trees for the combined sequences, have provided further insight into the taxonomy of the Gonatidae above the species level. At the genus level, conventional morphology-based taxonomy of the Gonatidae earlier suggested that the family is composed of either three genera: Gonatus, Gonatopsis, and Berryteuthis (e.g. Okutani, Reference Okutani1968; Nesis, Reference Nesis1973, Reference Nesis1987, Reference Nesis1997; Bublitz, Reference Bublitz1981; Okutani and Clarke, Reference Okutani, Clarke, Sweeney, Roper, Mangold, Clarke and Boletzky1992), or four genera: Gonatus, Gonatopsis, Berryteuthis, and Eogonatus (e.g. Okutani et al., Reference Okutani, Kubodera and Jefferts1988; Roper et al., Reference Roper, Jorgensen, Katugin, Jereb, Jereb and Roper2010). The present study corroborates earlier studies using multi-locus biochemical genetics (allozymes) approaches (Katugin, Reference Katugin2004), and molecular genetic (mtDNA) approaches (Lindgren et al., Reference Lindgren, Katugin, Amezquita and Nishiguchi2005; Katugin et al., Reference Katugin, Chichvarkhina, Zolotova and Chichvarkhin2017). They agree that conventional views on generic subdivision of the family Gonatidae do not reflect phylogenetic relationships among the gonatid species, and therefore, some of the genera may be invalid. In particular, gonatid species with eight arms and without tentacles in juveniles and adults were considered to belong to the widely accepted nominal genus Gonatopsis Sasaki, 1920. However, some of the species with eight appendages in the arm crown in that genus, e.g. Gonatopsis borealis (recently identified as B. borealis) possess a radula with seven longitudinal rows of teeth, and others (e.g. G. octopedatus and G. japonicus) have only five rows of teeth on the radula. Genetic evidence suggested that those two groups of the eight-armed species are paraphyletic, and therefore should be placed in different genera (Katugin, Reference Katugin2004; Lindgren et al., Reference Lindgren, Katugin, Amezquita and Nishiguchi2005).
Another example of an artificial combination of distantly related species in one genus concerns B. magister (initially described as Gonatus magister Berry, 1913) and B. anonychus (initially described as Gonatus anonychus Pearcy and Voss, Reference Pearcy and Voss1963), which were placed in the same genus based on two character states: the absence of hooks on the tentacle club and a radula with seven teeth (Okutani, Reference Okutani1968; Nesis, Reference Nesis1973; Jefferts, Reference Jefferts1983). Allozyme and mtDNA studies suggest strong genetic divergence between these two species, arguably sufficient evidence that they may not belong to the same genus (Katugin, Reference Katugin2004; Katugin et al., Reference Katugin, Chichvarkhina, Zolotova and Chichvarkhin2017). To address the inconsistencies between morphologic evidence, genetic divergence patterns and taxonomy at the genus level within the Gonatidae, two new genera were introduced: Boreoteuthis Nesis, 1971, which was first proposed as a separate subgenus in the genus Gonatopsis; and Okutania Katugin, Reference Katugin2004. As for all gonatid species known to date, morphological evidence and patterns of molecular divergence suggest taxonomic subdivision of the family into two subfamilies: Gonatinae and Berryteuthinae (Katugin, Reference Katugin2004). The former includes species with five rows of teeth on the radula, and the latter those with seven rows. The Gonatinae comprise all species of the genus Gonatus Gray, 1849, and two species of the genus Gonatopsis s. str. Sasaki, 1920, and together they constitute a monophyletic group on the consensus gene trees (Figures 12 and 13) with high bootstrap support (100%) and pp-values (1.00). From all the obtained individual gene and consensus phylogenies, G. octopedatus and G. japonicus form a monophyletic group (pp 1.00 and bootstrap 100%) and appear as sister-species within the large monophyletic group of Gonatus spp. (pp 1.00, bootstrap 100%), along with a monophyletic group of two sister-species, G. kamtschaticus and G. madokai (pp 1.00, bootstrap 95%), and other species for which combination into groups is not highly supported by bootstrap values.
Our findings suggest that evolutionary loss of tentacles in juveniles and adults in Gonatopsis s. str. happened independently from the loss of tentacles in the Boreoteuthis lineage, and was not accompanied by strong genetic divergence of two Gonatopsis species from the other five radular-toothed gonatids of the Gonatus lineage, which possess tentacles in the adult stage. Therefore, from a molecular genetic standpoint, species that comprise Gonatopsis s. str., in fact, belong to the genus Gonatus. Taking these findings into account, Gonatopsis should be down-ranked to the subgenus level within genus Gonatus. With respect to the Berryteuthinae, which comprises species with seven rows of teeth on the radula, the analysis of tree topologies constructed for four genes, both individually and when combined, revealed specific patterns of their molecular divergence. Contrary to an evident evolutionary commonality (=monophyly) of all Gonatinae species with radular teeth in five rows, the modern seven-toothed gonatids are split into several different lineages, which stem from the basis of the family gene trees. Genetic interrelations between five ‘species’ lineages, or clusters (B. magister, O. anonycha, B. makko, B. borealis ‘large’, and B. borealis ‘small’) are not always consistent among the 12S rRNA, 16S rRNA, 28S, and CO1 gene trees, and the resultant tree topologies could be interpreted in different ways depending on the gene used for reconstruction, or a clustering approach. The order of clustering for species with a seven-rowed radula differs between the individual gene trees, as well as between the combined molecules phylogenies constructed using BA and ML approaches. For example, the position of O. anonycha, which possesses a number of ‘primitive’ character states, such as minute almost equal-sized suckers all over the tentacle club manus, and hookless arms in males (Pearcy and Voss, Reference Pearcy and Voss1963; Bublitz, Reference Bublitz1981) that may vary, so the seven-toothed gonatids, this species appears as the most proximal to the stem of five-toothed species on the BA and ML consensus trees, and the most distal to all other confamilial species and groups of species on the CO1 trees. Irrespective of variable tree topologies, there exist five species (in, supposedly, three genera) of gonatids with a seven-rowed radula, which are clearly identifiable morphologically and genetically, and which are closer to the base of the family clade than an evidently derived monophyletic group of species with a five-rowed radula. Differences in the Gonatidae phylogeny versions, based on different data sources, are discussed elsewhere (e.g. Nesis, Reference Nesis1973; Bublitz, Reference Bublitz1981; Jefferts, Reference Jefferts1983; Katugin, Reference Katugin2004; Lindgren et al., Reference Lindgren, Katugin, Amezquita and Nishiguchi2005).
Conclusion
The use of partially sequenced mitochondrial (CO1, 16S rRNA, and 12S rRNA) and nuclear (18S and 28S) genes provided deeper insight into the species identification, delimitation, and subdivisions within the family Gonatidae. The 12S rRNA, 16S rRNA, 28S, and CO1 sequences proved to be of high value and 18S of low value for the study of genetic relatedness among the gonatid squids. Molecular evidence based on the analysis of four valuable gene markers suggested the existence of a general subdivision of the family members into species with radular teeth in rows of five and those with rows of seven. The species with a five-rowed radula form a unique monophyletic group with a taxonomic status of a single-polymorphic genus or subfamily. The species with a seven-rowed radula represent several independent lineages, and their relations with each other and a derived lineage of species with a five-rowed radula are yet to be interpreted phylogenetically. The molecular genetic relationships among the Gonatidae revealed in this study provide a solid basis for further taxonomic decisions and studies on phylogeny of this squid family.
Supplementary material
The supplementary material for this article can be found at https://doi.org/10.1017/S0025315423000759
Author's contribution
Oleg N. Katugin: data collection, research planning, and writing.
Anna O. Zolotova: sequencing, data analysis using software, and writing.
Financial support
Budgetary Governmental financing for fisheries research (TINRO) and A.V. Zhirmunsky National Scientific Center of Marine Biology Far Eastern Branch, Russian Academy of Sciences (NSCMB FEB RAS NSCMB).
Competing interests
None.
Ethical standards
The authors declare no violation of ethical standards.
Data availability
Data used in this study are publicly available at the NCBI GenBank (https://www.ncbi.nlm.nih.gov/); new DNA sequences that have been obtained for squid species via sequencing procedures have been posted to NCBI GenBank and will be publicly available at NCBI GenBank after publication of the article.