Introduction
Image-guided radiotherapy (IGRT), in part through the use of cone beam computed tomography (CBCT), has led to improvements in treatment delivery. Reference Ariyaratne, Chesham, Pettingell and Alonzi1–Reference Dawson and Sharpe4 CBCT provides 3D volumetric images of the patient on the treatment couch, enabling visualisation of soft tissues and bony anatomy and can improve positional accuracy of the treatment delivery. Reference Dawson and Sharpe4,5 The National Radiotherapy Implementation Group (NRIG) road map to 4D adaptive radiotherapy clearly outlines the use of CBCT for patient positioning and potentially dose assessment as a critical component on this road map. 5
In conjunction with improved visualisation of the patient’s treatment position, CBCT delivers an additional radiation dose to the irradiated volume. Reference Ding and Munro6 A number of reports in the literature estimate the dose from such exposures to an average sized patient. Reference Ding and Munro6–Reference Sawyer, Whittle, Matthews, Starritt and Jupp11 Others provided recommendation of techniques to optimise image quality and minimise the dose to certain structures. Reference Ding and Munro6,Reference Ding, Munro, Pawlowski, Malcom and Coffey12,Reference Murphy, Balter, Balter, Bencomo, Das and Jiang13 These techniques are in line with national and international radiation guidelines to reduce radiation doses to as low as reasonably practical, consistent with the intended purpose, the ALARP principle. 14,15
The optimisation of imaging dose based on attenuation properties of the patient is used on a slice-by-slice basis in CT scanners by modulating the tube current. CT scanners adjust the mAs to optimise the dose of each slice, dependent on the attenuation properties of that slice, either by assessing the noise level at each slice to maintain a constant noise level or through the use of reference mAs levels. Reference Sookpeng, Martin and Lopez-Gonzalez16 Although adjustment of kV can also result in optimisation of dose, this approach is not practised in radiotherapy CT scanners to enable accurate conversion of Hounsfield units (HU) to electron density, as required for accurate dose calculation. Reference Davis, Palmer and Nisbet17 Alternatively, CBCT irradiates the whole treatment volume at each plane, therefore slice-by-slice adjustment of the exposure settings is not possible. Indeed currently, no technological method for optimising patient dose during a linac-based CBCT is available. Strategies for optimising CT and CBCT patient dose and image quality based on patient size have been reported in the literature Reference Huda and Bushong18–Reference Langmack, Newton, Jordan and Smith27 and presented at national conferences. 28,29 Optimisation of CBCT has focussed primarily on patient size optimisation of mAs settings for pelvis protocols. Reference Yang, Yu, Ruan and Chen23–Reference Langmack, Newton, Jordan and Smith27 Simultaneous optimisation of CBCT kV setting has not been as widely reported Reference Wood, Moore, Horsfield, Saunderson and Beavis22 for a number of reasons. Firstly, this option is typically not available on linac platforms. In addition, the impact of kV on CBCT image quality is not as well understood as it is for CT due to the higher scatter-to-primary ratio in CBCT images, Reference Pauwels, Silkosessak, Jacobs, Bogaerts, Bosmans and Panmekiate30 and finally, optimisation of kV may impact HU accuracy for the use of CBCT images in adaptive radiotherapy Reference Rong, Smilowitz, Tewatia, Tomé and Paliwal31 . Techniques to categorise patients by size include circumference and equivalent diameter measurements, Reference Kotre and Willis19 weight, Reference Huda, Scalzetti and Levin21 average diameter measurements Reference Marchant24,Reference Bernstein, Alexander, Castellano, King, Humpherys and Bhuva25 and CT exposure settings. Reference Wood, Moore, Horsfield, Saunderson and Beavis22,Reference Bernstein, Alexander, Castellano, King, Humpherys and Bhuva25 Techniques to evaluate optimisation of image quality include noise measurements Reference Kotre and Willis19,Reference Wood, Moore, Horsfield, Saunderson and Beavis22,Reference Yan, Cervino, Jia and Jiang26 and contrast to noise measurements Reference Marchant24,Reference Yan, Cervino, Jia and Jiang26,Reference Langmack, Newton, Jordan and Smith27 in either geometric or anthropomorphic phantoms or in patients’ images. This type of quantitative image analysis excludes the human optical component inherent in image assessment. However, inclusion of the human optical component through qualitative image analysis found that the achievable reduction in dose was comparable to that determined using phantom measurements. Reference Langmack, Newton, Jordan and Smith27
The purpose of this study was to determine optimal mAs settings based on the clinical task for three predominant clinical sites using CBCT in our centre: pelvis, thorax and head and neck (H&N). Optimal settings were determined quantitatively in a geometric phantom. As adjusting the mAs affects image quality, the implementation of these optimised setting was incrementally phased into clinical use and qualitatively evaluated at each phase by the radiographers performing the clinical task of a bone or soft-tissue match as appropriate. Implementation of these optimised mAs settings based on patient size into our clinical CBCT imaging protocols is of benefit for patients, providing an image of sufficient quality for its intended purpose at the minimum dose possible and also enables our staff to meet our responsibilities under IRMER. 15
Materials and Methods
Patient size
A sample of 40 patients, with a range of sizes, was selected for each site (H&N, thorax and pelvis). The patient average diameter was determined as the (maximum height + maximum width)/2. The average diameter was determined from the treatment planning isocentre slice and the CT slice z = 0, as selected at the time of the CT scan. Patient circumference and automated CT exposure settings were also acquired for each patient. Correlation of average diameter measurements from the isocentre slice, average diameter measurements from the z = 0 slice, patient circumference and CT exposure settings were assessed using Pearson correlation. Correlations >0·7 were deemed significant. The range of patient sizes for each anatomical site was used to inform the patient size categories and the design of a phantom to assess the effect of CBCT exposure setting on CBCT image quality for this range of patient sizes.
Phantom design
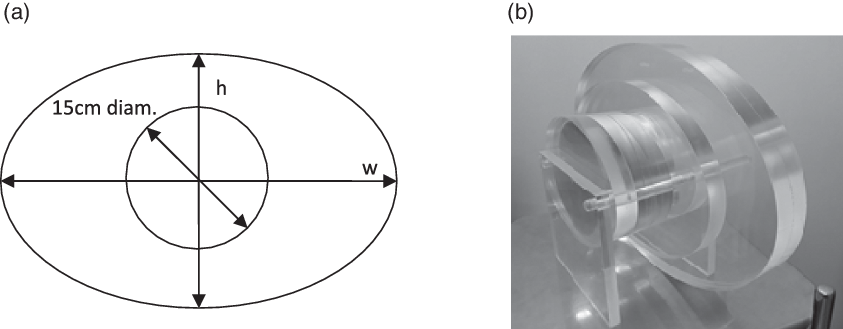
An elliptical Perspex phantom with slices of varying average diameter, as shown in Figure 1, was designed to accommodate centrally: (1) a 15-cm diameter circular Perspex insert, to create a solid Perspex phantom, representative of a pelvis; (2) a 15-cm diameter circular polystyrene insert (of relative electron density 0·035) representative of a lung volume and (3) a 15-cm diameter image quality phantom insert from the CATPHAN®504 (CTP404, CTP528 and CTP515) (The Phantom Laboratory Inc., New York, USA) to quantitatively assess spatial and contrast resolution. Based on the sample of 40 patients for each clinical site (120 patients), the ellipse sizes were small 23 cm × 16 cm, medium 36 cm × 24 cm and large 50 cm × 33 cm equating to average diameters of 19·5, 30 and 41·5 cm. The 15-cm diameter circular insert was the dimension of the CATPHAN®504 inserts and was also representative of the head diameter and the lung volume. Each phantom slice width was 2·5 cm. To obtain sufficient scattering volume in the CBCT, the large end of the phantom was backed with an additional large ellipse, while the small end was backed with an additional small ellipse. Measurements for the head protocol were acquired using the five 15-cm diameter Perspex inserts referred to from herein as the head phantom. Measurements for the thorax protocol were acquired using the small, medium and large ellipses and the polystyrene inserts, referred to from herein as the thorax phantom. Finally, the measurements for the pelvis protocol were acquired using the small, medium and large ellipses and the Perspex inserts, referred to herein as the pelvis phantom.
(a) A schematic drawing of an example slice of the ellipse phantom of height (h) and width (w), with 15-cm diameter insert. (b) Image of elliptical Perspex phantom of small, medium and large slices with polystyrene inserts representative of the lung volume.

Quantitative phantom measurements
A small, medium and large slice of the thorax and pelvis phantoms and a single slice of the head phantom were each irradiated first with the CT scanner (GE Optima CT580W RT Widebore Scanner, GE Inc., Boston, MA, USA). All CT scans were performed using the default site-specific protocol with 120 kV and automatic tube current modulation. Measurements for each slice and each phantom were then repeated using a Varian TrueBeam V2.7 CBCT (Varian Medical Systems Inc., Palo Alto, CA, USA) at the default protocol image settings and over the range of mAs exposures settings available for each protocol. It was not possible to optimise the CBCT default kV settings, which are fixed within the Varian TrueBeam platform at 100 kV for the head protocol, 125 kV for the thorax protocol and pelvis protocol and 140 kV for the pelvis obese protocol. Alternatively, CBCT exposure settings were typically varied in increments of ~±20%, dependent on the settings available in the CBCT dropdown mAs menu. Measurements for each slice were acquired with the slice positioned centrally at the isocentre, to reduce the variation in noise due to off-axis distance across the imaging panel. Noise in both CT and CBCT images was calculated as the average SD of HU numbers in four regions of interest (ROIs) measured peripherally in the 15-cm diameter insert, with an increase in noise measured by an increase in the SD of HU numbers. Noise measurements were performed using software developed in MATLAB®2010 (Mathworks, Natick, MA, USA). A central ROI was not included in the analysis to minimise the effect of non-uniformities and cupping artefacts on the noise results. Noise measurements at the auto mAs settings at CT and at each exposure level at CBCT were repeated in triplicate to assess the effect of variation in tube output on noise. Throughout the article, results are presented as the mean ± 1 SD.
Qualitative patient measurements
Based on phantom measurements, variation in exposure settings of ~20% from default settings resulted in small variation in HU. It was, therefore, deemed acceptable to optimise patient images in phases, with each phase incrementing the exposure settings by ~20%. By implementing changes in this manner, an image with clinically useable image quality would always be acquired, removing the need for repeat imaging due to poor image quality. From analysis of patient sizes, most patients are medium sized and from experience using the Varian default image settings, most patients had acceptable image quality. Therefore, the first phase of optimisation involved increasing the large patient dose by ~20%, reducing the small patient dose by ~20% and maintaining the medium dose at the default settings. As H&N patients were all within a single size category and the default setting provided sufficient image quality, all H&N patients had their imaging dose reduced by ~20%. Radiographers were provided training on how to determine the average patient size and on the grading system, as shown in Table 1. For H&N patients, radiographers were also asked to only grade the head portion of the CBCT images excluding the shoulders where poor image quality is expected due to the change in patient attenuation and average patient diameter. A table detailing the new exposure settings based on patient size was displayed at each of seven linacs. After each image acquisition, images were graded by the radiographers on a scale of 1–5, 1 representing poor quality, not useable image up to 5 good quality, easy to use, using the form shown in Table 1. Reference Keeble, Baxter, Gislason-lee, Treadgold and Davies32 All images were graded by one radiographer and checked by a second radiographer over all seven linacs. Over 35 radiographers participated in grading images over the duration of the study, each typically having a minimum of 3 years of experience in the matching process. H&N images were matched based on bony anatomy, while thorax and pelvis images were matched based on soft tissue, as per local protocol. All matches were performed firstly using an auto-match but reviewed and manually matched, as required, for each patient.
Sample form for qualitative analysis of patient CBCT image quality

The qualitative image quality scores were assessed for each patient group before implementing the next phase. It was proposed to review all data every 2 weeks and to move to a subsequent phase if the median qualitative image quality score was ≥4. 29 For size categories that received small number of patients, the length of the optimisation phase was extended to achieve a minimum of three patients in each category. When this was not possible, the data from the other size categories and the data from individual patient images were used to determine if it was appropriate to further increase/decrease the image dose/quality. Following phase 1 and 2, to confirm if image quality was sufficient prior to implementation of a further phase, a single image for five patients was acquired using the next phase settings and reviewed by both a radiographer and a physicist before commencing the next phase. If the image quality was not sufficient, a decrease of 10% was investigated in the same way. Qualitative optimisation of image quality was discontinued when the median image quality was reported as <4. This number, <4, was arrived at, because although it was possible to match scale 3 (hard to use images), such images may take a longer time to match and such time delays could result in errors in treatment delivery. Reference Pang, Knight and Fan33
In addition, as a quantitative measure of patient image quality at each phase, the time required to perform a match for each patient was determined from the record and verify system (Aria V15.1; Varian Medical Systems Inc., Palo Alto, CA, USA). The average match time for each patient at each phase was determined as the average of the match time for the first image day and last image day. This approach was validated by comparing the average match time calculated for first image day and last image day to that determined from each imaging day for a set of ten prostate patients.
Results and Discussion
Patient size
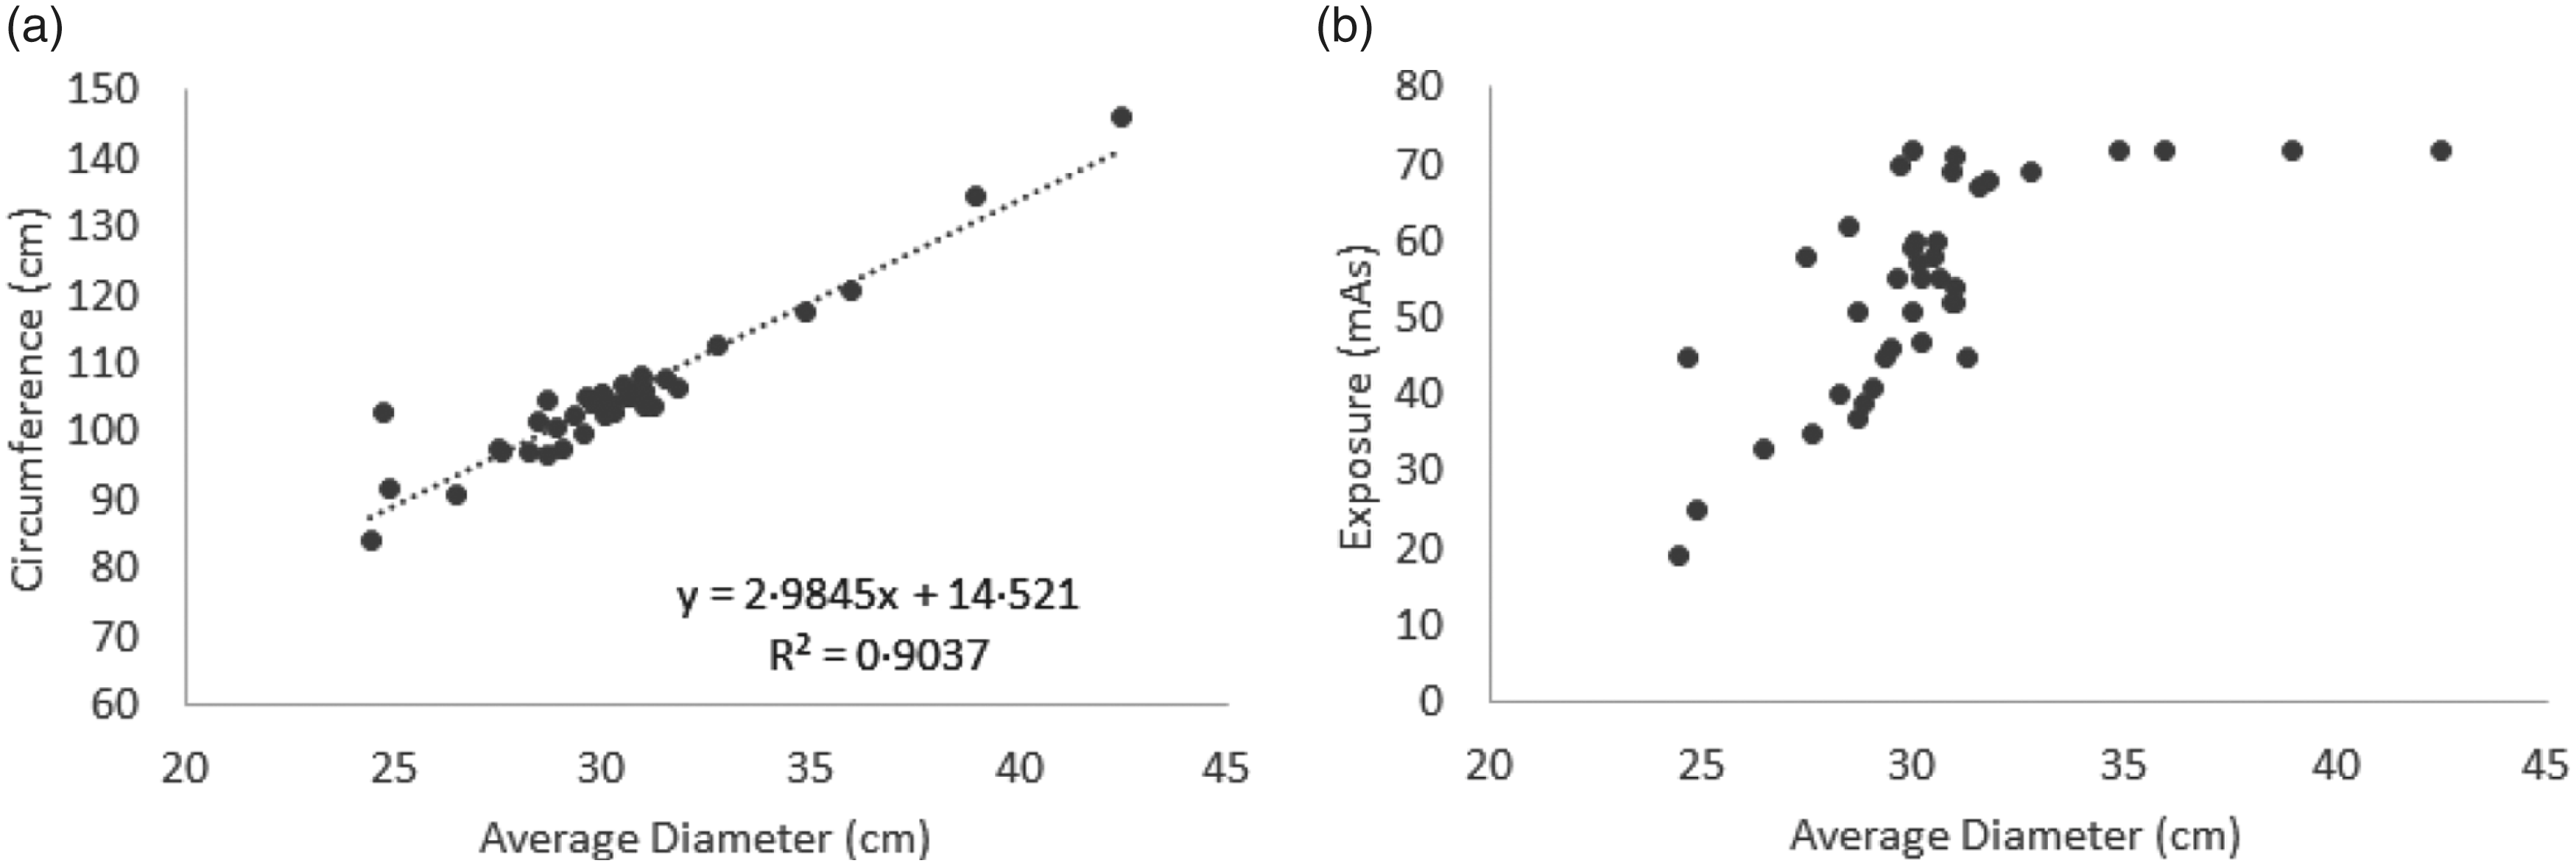
The average diameter measurements from the isocentre slice and the z = 0 slice were correlated (r = 0·95). The average diameter at the isocentre slice and patients’ circumference were also correlated (r = 0·95), as shown in Figure 2a. The relationship between patients’ average diameter and modulated CT exposure settings was correlated (r = 0·73) for patients with an average diameter <33 cm, as shown in Figure 2b. Patient circumference was also correlated with CT exposure settings (r = 0·83) again for patients with an average diameter <33 cm. However, the locally defined protocols on the GE Optima CT scanner resulted in patients with an average diameter >33 cm receiving a constant exposure.
(a) Relationship between patients’ circumference and patients’ average diameter calculated from the treatment planning isocentre slice. (b) Relationship between CT exposure settings and patients’ average diameter calculated from the treatment planning isocentre slice.

The exposure setting for the GE CT scanner is determined by the permissible noise level, which is set locally for each protocol. Although these noise levels are suitable for treatment planning images, this result suggests that the scan protocols are not optimised over the full range of patient size, and thus in our centre the use of CT exposure settings would not enable patients with an average diameter >33 cm to be categorised into groups based on size as it has been done elsewhere. Reference Wood, Moore, Horsfield, Saunderson and Beavis22,Reference Bernstein, Alexander, Castellano, King, Humpherys and Bhuva25 Furthermore, use of exposure settings to categorise patient size may not be widely adaptable as others have reported that mAs can be less dependent on patient size in Siemens scanners (Siemens, Munich, Germany), Reference Sookpeng, Martin and Lopez-Gonzalez16 while others have noted the additional limitation that changes in CT protocols would result in changes in the size categorisation. Reference Wood, Moore, Horsfield, Saunderson and Beavis22 From our results, the correlation between the three external surrogates of size (circumference and two average diameter measures) and a measure of internal variations in patient anatomy (accounted for with CT exposure settings) show that despite variations in patient average diameter over their length and variations between external and internal anatomy, where CT protocol is optimised over the full range of patient size, any of these measures could be used to categorise patient size.
In our centre, measurements from the isocentre slice were preferred as radiographer pre-treatment checks already included measurements at the isocentre slice. In addition, the average diameter could be quickly and easily determined from the patient’s CT dataset rather than an additional measurement of circumference for the patient during their appointment. The CT exposure settings were also not suitable in our centre as the settings were not optimised in local protocols to categorise patients with average diameter >33 cm. Furthermore, in our centre the average or maximum exposure setting is not readily available from the patient’s scan. As average diameter was the simplest additional step, suitable for all patients and with no implication for patients, this parameter was used to categorise the patient size in this study.
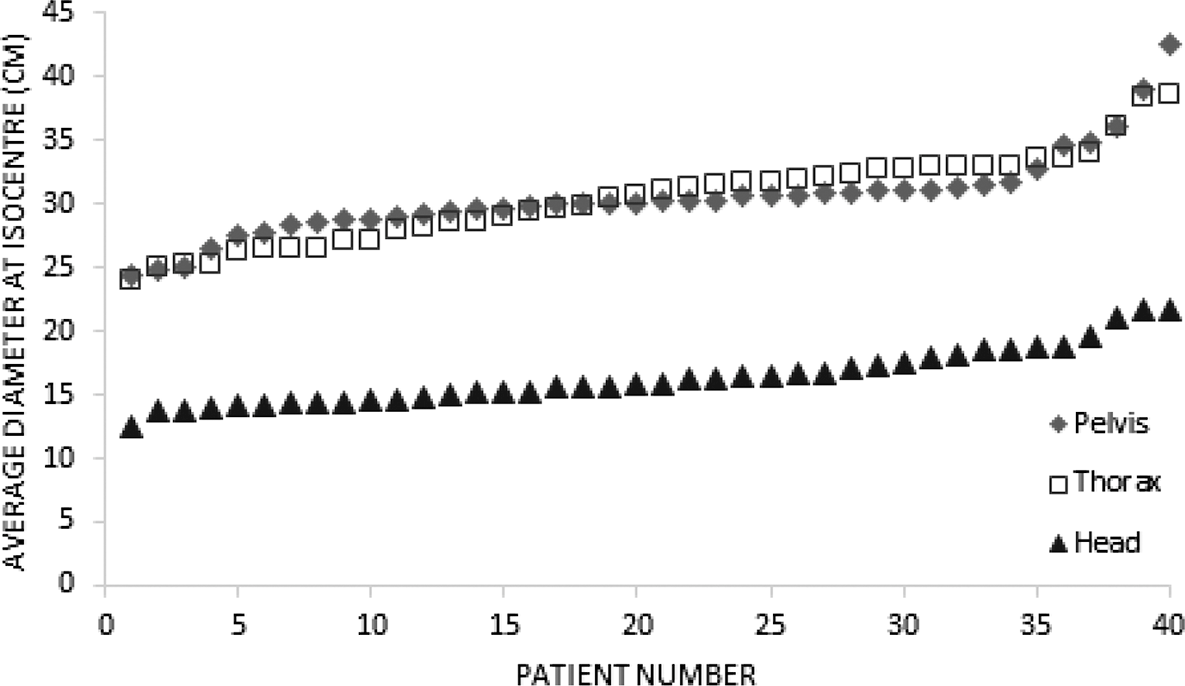
From the sample of 40 patients in each anatomical site (Figure 3), the average pelvis size was 30·4 ± 3·4 cm with a range of 18·1 cm. The average thorax size was 30·4 ± 3·5 cm with a range of 14·5 cm, while the average head size was 16·4 ± 2·4 cm with a range of 9·3 cm.
The average of the height and width of 40 pelvis, 40 thorax and 40 H&N patients measured at their treatment plan isocentre.

No issue with H&N patient images had been noted in the previous 2 years using the Varian default image settings. With this knowledge and the small range of head sizes (~10 cm), a single size category was determined for H&N patients. A number of image quality queries had been raised for a small number of larger thorax and larger pelvis patients during the 3 years of using the Varian default image settings. Retrospectively, it was noted that these patients had an average diameter of ≥39 cm. The large patient size was selected as >35 cm, comparable with others in the literature.Reference Yang, Yu, Ruan and Chen23,Reference Marchant24 As there had been no image quality issues with most patients, the range for medium patients was set at 10 cm, comparable to the range of H&N patients and therefore, the small patient size was set at ≤25 cm again consistent with others in the literature.Reference Yu, Li, Fletcher and McCollough20,Reference Bernstein, Alexander, Castellano, King, Humpherys and Bhuva25 It was not possible to compare these size categories defined by average diameter with others in the literature defined by weight or exposure.Reference Huda and Bushong18,Reference Huda, Scalzetti and Levin21,Reference Wood, Moore, Horsfield, Saunderson and Beavis22 Within the first phase of optimisation it was noted that large patients of 35 cm and medium patients of 26 cm all received image quality scores of 5, easy to use. All other patient sizes received a range of scores; therefore, the size categories were reset to >36 and ≤26 cm for the large and small category, respectively.
Quantitative phantom measurements
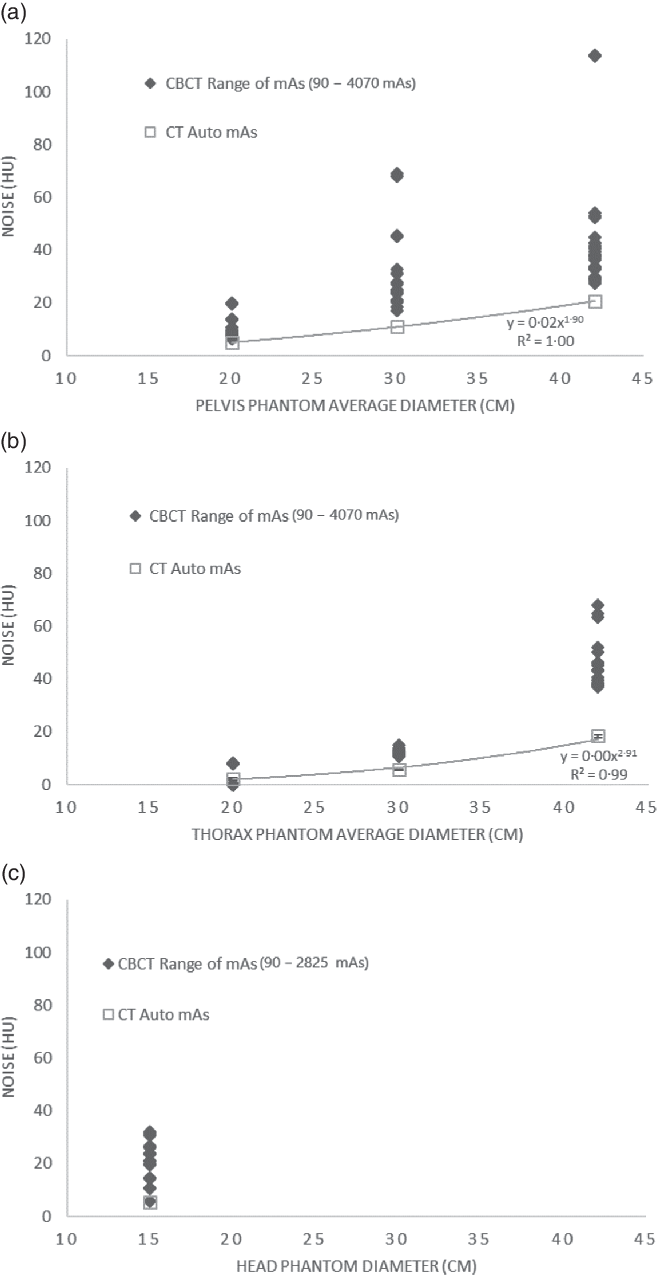
The relationship between phantom size and image noise is shown in Figure 4 for CT scans and CBCT scans for pelvis, thorax and H&N protocols. Thorax and pelvis phantom measurements show noise in CT scans and follow a power relationship with patient diameter as expected for GE scanners, where the mAs is adjusted to maintain a permissible noise level. Reference Sookpeng, Martin and Lopez-Gonzalez16 As only a single phantom size was used for head measurements, no such relationship was established.
Relationship between image noise (HU) and phantom size (cm) at CT with auto mA and at CBCT using the full range of available mAs measured in the (a) pelvis phantom, (b) thorax phantom and (c) head phantom.

For the pelvis phantom, the CT auto mAs for the small, medium and large slices were 364 ± 117 mAs, 544 ± 0 mAs and 544 ± 0 mAs, respectively. No variation in mAs for the medium and large slices is due to tube current limits set on the CT scanner. Despite this, the CT noise remained lower than the CBCT noise for all phantom diameters using a range of CBCT exposure settings of up to 4048 mAs at each phantom diameter.
Conversely, for the small thorax phantom, the auto mAs used by the CT scanner was 280 mAs, yet the CT noise was higher than the CBCT noise for the same slice diameter using a range of 90–1530 mAs. The CBCT thorax protocol of 2260 mAs paradoxically increased the noise in the small thorax phantom compared to that of lower mAs CBCT and lower mAs CT scan due to the presence of a circular artefact not present in lower mAs images. For the medium thorax phantom, the auto mAs of the CT scan was 435 ± 0 mAs, which achieved less noise than the CBCT scans using a range from 90 to 2260 mAs. Also, for the large thorax phantom, the CT’s auto mAs was 435 ± 0 mAs, but again achieved less noise than that in the CBCT scans using 90–4070 mAs.
For the head phantom, the CT’s auto mAs was 26 mAs, but again achieved less noise than that of a range of CBCT head scans from 50 to 600 mAs. Only a CBCT head protocol of 2825 mAs, maximum possible, achieved comparable noise to the auto mAs of the CT scan.
The lower image noise in CT scans is as expected due to the wider field of view (FOV), and larger scattering volume and amorphous silicon flat panel detector inefficiencies are inherent to CBCT scanners. Furthermore, a direct comparison of CT noise and CBCT noise is not as appropriate as CT images, and CBCT images are captured and optimised for different purposes – CT images for treatment planning and volume outlining and CBCT images for image matching. Indeed, where CT noise has been used to inform CBCT protocols, the authors have used relative measures of CT noise. Reference Wood, Moore, Horsfield, Saunderson and Beavis22,Reference Bernstein, Alexander, Castellano, King, Humpherys and Bhuva25
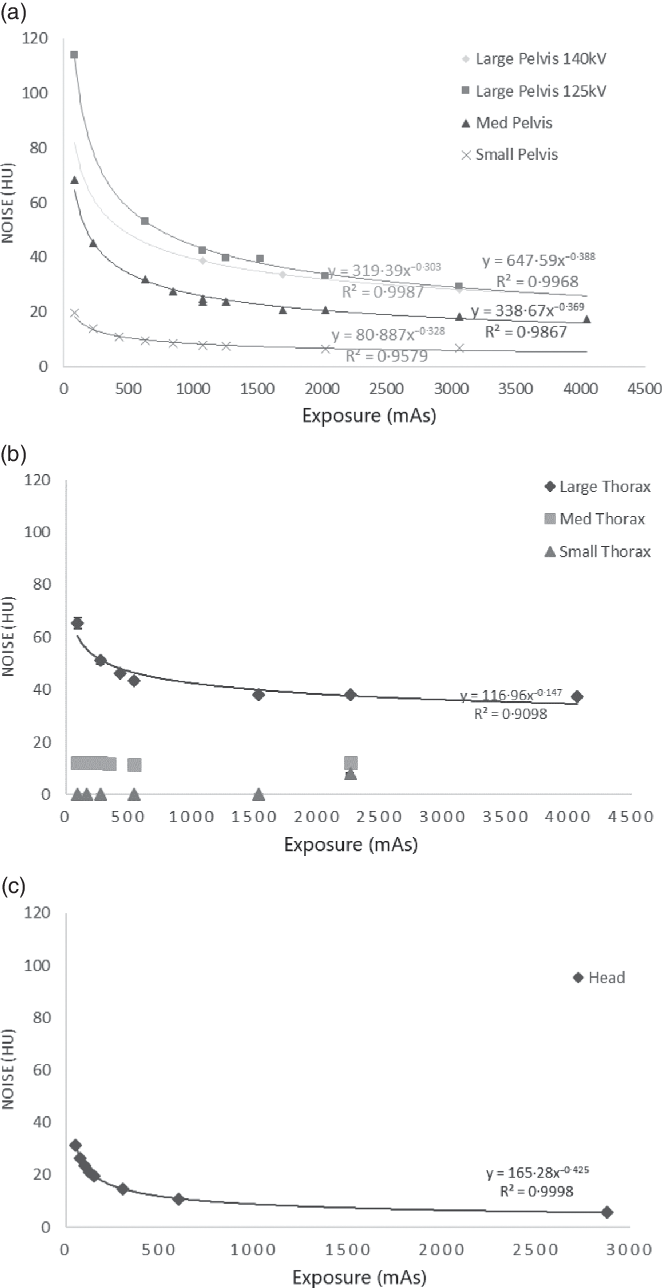
The relationship between exposure, CBCT noise and patient size is presented in Figure 5 for pelvis, thorax and H&N protocols. In the pelvis phantom, at all phantom sizes, noise and mAs exhibited a power relationship of −0·35 ± 0·04. In the thorax phantom, at the large phantom size, noise and mAs exhibited a power relationship of −0·15. No power relationship was noted for medium or small thorax. Noise in the medium thorax phantom was 12·0 ± 1·0 HU over all exposure levels. The noise in the small thorax phantom was 0 ± 0 HU for all but the highest exposure level 2260 mAs, where the noise was 7·9 ± 0·3 HU due to a ring artefact as previously described. Noise in the head phantom was governed by a power relationship of −0·43. The relationship between noise and exposure for all protocols and all phantom sizes shows that 20% increments in mAs have little impact on the achievable noise level until the steeper portion of the curve at lower mAs values. As aforementioned, optimisation of CBCT kV settings was not possible on the Varian TrueBeam platform, but if possible could have the potential to further improve image quality while reducing imaging dose. Reference Yu, Li, Fletcher and McCollough20,Reference Wood, Moore, Horsfield, Saunderson and Beavis22 The impact of this further work, adjusting kV settings, on the relationship between HU numbers and electron density would also need to be considered if using CBCT images for dose calculations in adaptive radiotherapy. Reference Rong, Smilowitz, Tewatia, Tomé and Paliwal31
Relationship between average noise and exposure (mAs) measured in triplicate in the (a) large, medium and small pelvis phantom; (b) large, medium and small thorax phantom and (c) head phantom. Error bars of ±1 SD are indistinguishable for most measurements.

Qualitative patient measurements
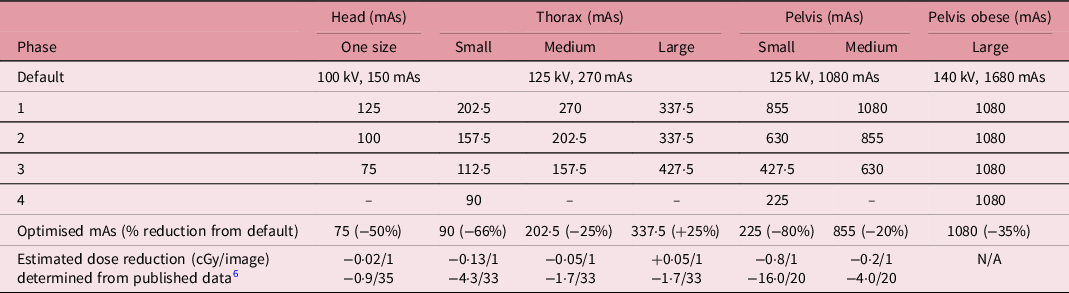
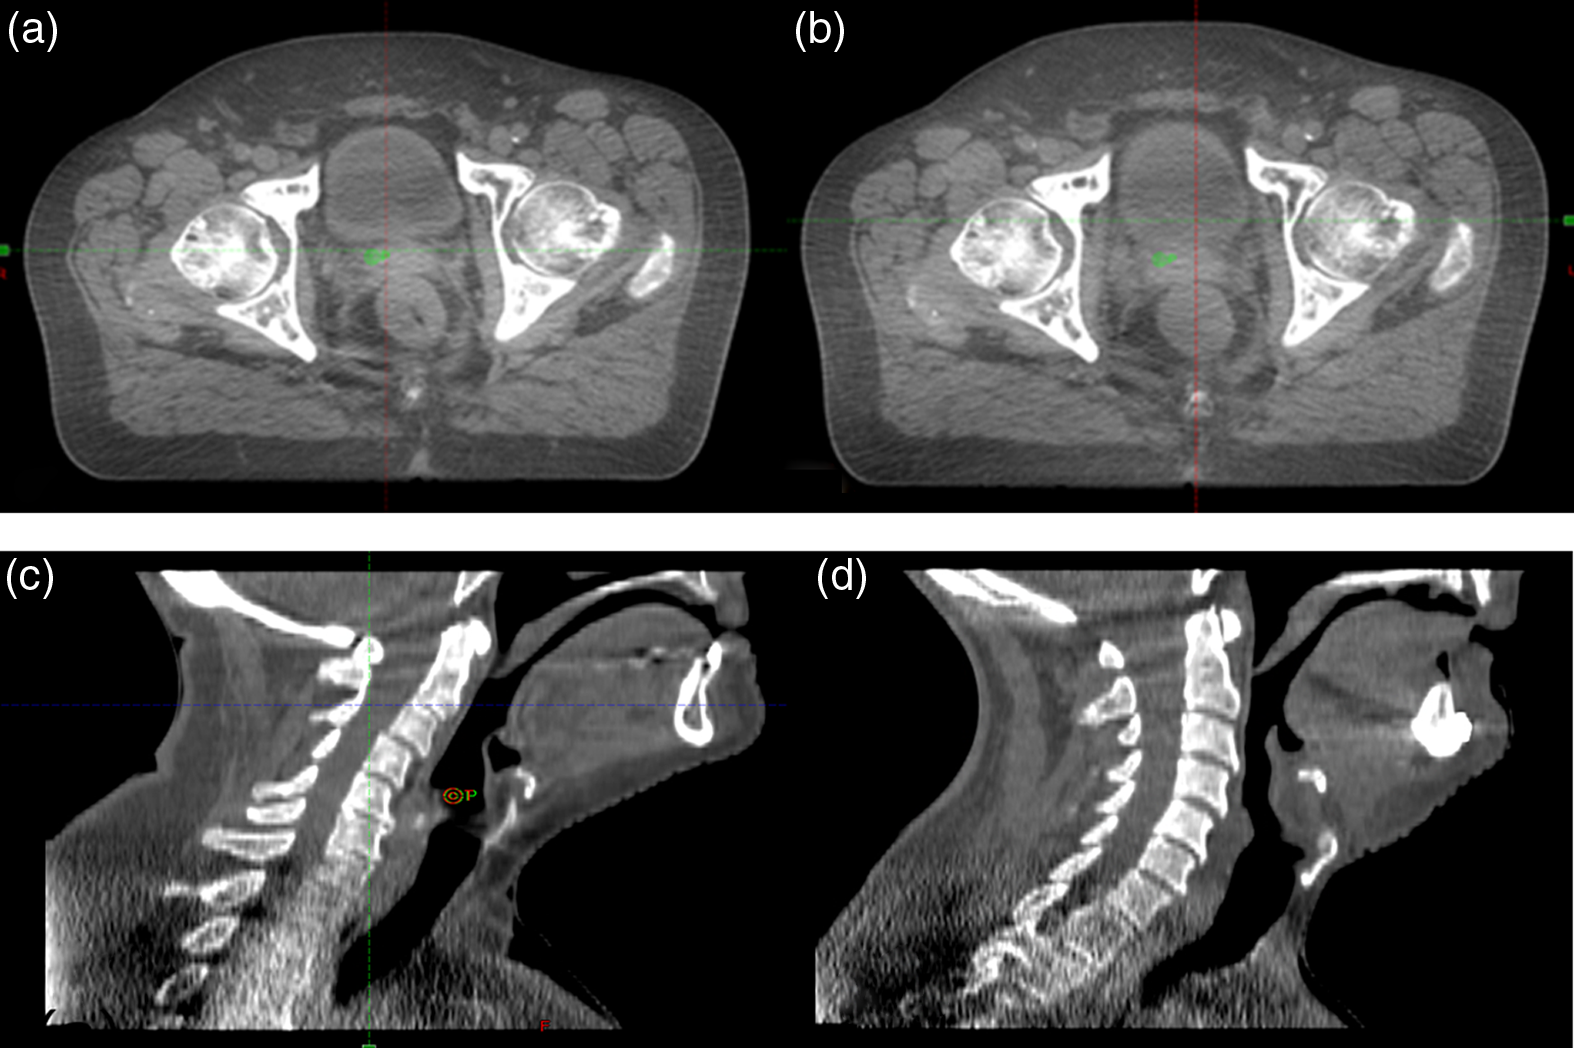
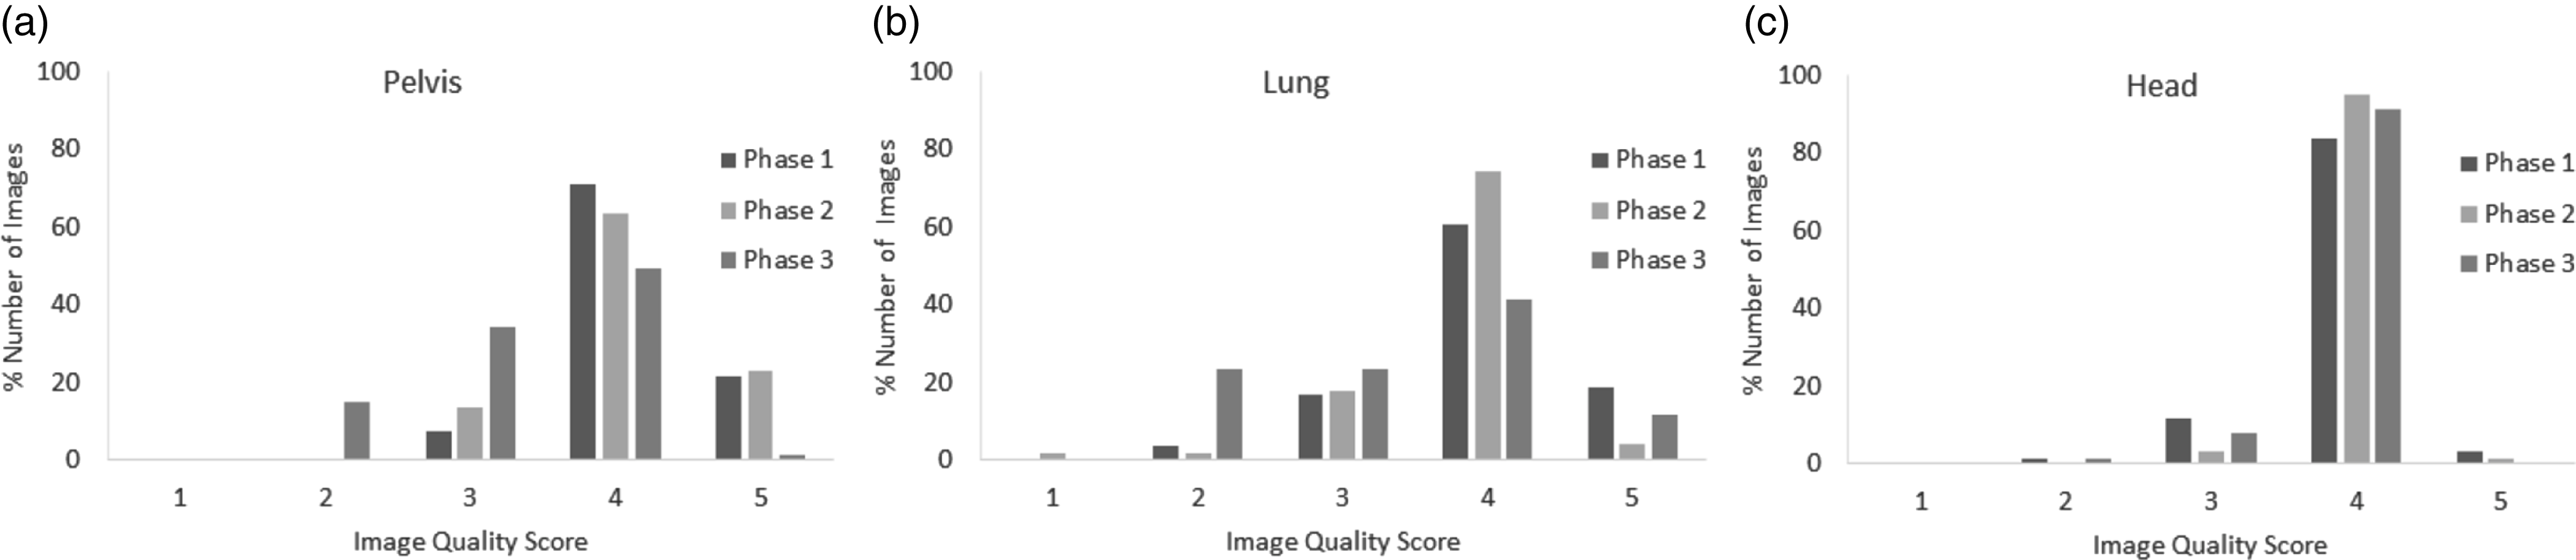
The increments for patient CBCT protocol optimisation are shown in Table 2. An example of images from a medium sized pelvis patient in phase 1 and 2 of the optimisation is presented in Figure 6. In total, 431, 469 and 297 images were assessed in phase 1, 2 and 3, respectively. The results from phase 1 to 3 for medium sized patients for all protocols are presented in Figure 7. Although comparable results were found for smaller and larger patients, the number of images assessed was less, typically 24 ± 14 images per phase. The results from phase 1 to 3 for medium sized patients show a decrease in the number of images receiving a score of 4 or 5 with each phase in conjunction with an increase in the number of images receiving a score of 2 and 3 with each phase. Despite the high image quality scores for the head protocol in each phase, radiographers expressed increasing concern for the image quality at the level of the shoulders. Prior to commencing phase 3, a single image from a sample of five patients was assessed and the image quality at the level of the shoulders was deemed to be a score of <4, whereas elsewhere the remaining head typically received ≥4. From implementation of phase 3 for the head protocol, despite the head receiving a median score of 4, the image quality of the shoulder remained at a 2 or 3; therefore, no further optimisation was implemented for this site. For medium sized thorax and pelvis patients, the reduction of dose to ~40% of the default settings (phase 3) reduced the median image quality score to 3 for both protocols. Therefore, no further optimisation was implemented and the previous optimisation level of ~20% reduction in the default settings was set for both thorax and pelvis patient groups. For the pelvis patient group, this resulted in a large variation in mAs between the small and medium patient size. This suggests that further optimisation may be possible through sub-division of the medium patient category and this will be the subject of future work. For the large pelvis group, previous experience of poor image quality was obtained on TrueBeam V1.5, where the large pelvis protocol had a default setting of 125 kV and 1188 mAs. Following an upgrade of all TrueBeam linacs in our department to V2.5 and V2.7, the large pelvis protocol of 140 kV and 1680 mAs was made available. As this was an increase in kV of ~20% from the default pelvis protocol, this kV with the default pelvis protocol mAs (1080 mAs) was used as a starting point for the large patient size. At this protocol, images from four large patients >36 cm, but all with average diameters <40 cm, received a median image quality score of 4. Therefore, no further optimisation of the large pelvis protocol was undertaken, yet may still be required on an individual basis for patients of ≥40 cm average diameter.
The phased increases and decreases in CBCT protocol settings for head, thorax and pelvis from the Varian default CBCT settings. The final optimised CBCT settings for each protocol are presented along with the estimated dose reduction determined from published data

Sample images from a medium sized pelvis patient at (a) Varian default CBCT mAs setting and (b) optimised settings: −20% of Varian default CBCT mAs setting. Sample images from H&N patients at (c) Varian default CBCT mAs settings and (d) optimised settings: −50% of Varian default CBCT mAs setting.

Histograms of the % number of images that received an image quality score between 1 and 5 in phase 1, 2 and 3 of the optimisation of (a) pelvis, (b) lung and (c) head CBCT image protocols for medium sized patients.

An estimate of the dose reduction per CBCT image is provided in Table 2 from reference to reported kV CBCT dose data available in the literature. Reference Ding and Munro6 The total potential dose saving per treatment course is also provided based on one CBCT per fraction.
Following the optimisation of mAs in each category, these settings were input into the Varian TrueBeam CBCT mode editor, so that the new CBCT settings are available from a dropdown menu in place of the default protocol settings within the clinical workstation. This removes the task of having to input the correct mAs for each patient, providing optimised CBCT dose with equivalent risk to that of having to select the correct default CBCT protocol.
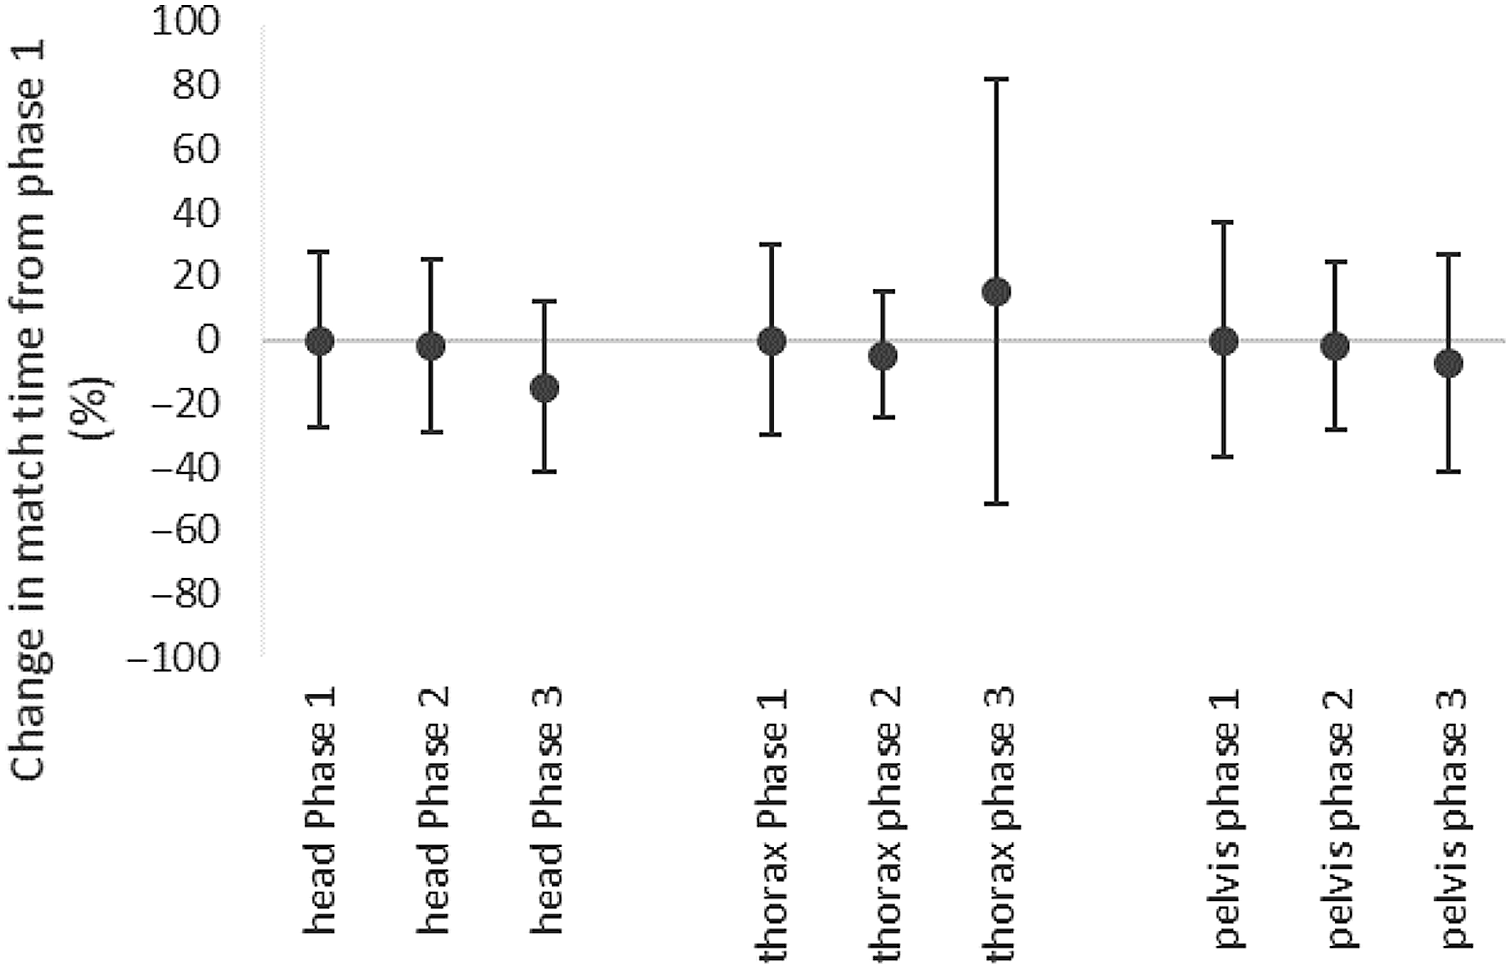
The match time for all medium patients is presented in Figure 8. The match time in phase 1 and 2 for all protocols was comparable. Phase 3 coincided with a move to daily CBCT for H&N and prostate patients and despite the reduction in image quality scores reported by radiographers at this phase, both these sites had a reduction in match time. This reduction in match time may potentially be due to the increase in the number of matches radiographers were performing daily for these sites. Alternatively, for thorax patients in accordance with the reduction in image quality score at phase 3, the average match time and the variation in match time increased, although not significantly.
Comparison of match time for each phase compared to phase 1 for head, thorax and pelvis medium protocols.

From reports in the literature and national conferences, based on the stated patient size category and % reduction in exposure settings, a comparison to optimisation of pelvis protocol from alternative centres with variable equipment (Elekta, Varian OBI, Varian TrueBeam) was carried out. The reduction in dose in the small pelvis patients of 80% was comparable to one centre 34 and larger than the 50, Reference Marchant24 60 Reference Bernstein, Alexander, Castellano, King, Humpherys and Bhuva25 and 66% Reference Wood, Moore, Horsfield, Saunderson and Beavis22 were also reported in the literature. From Figure 5a, the gentle slope of noise and mAs for the small phantom show how a large reduction in mAs did not impact the noise levels in our centre for this patient size. For medium pelvis patients, a reduction of mAs settings of only 20% was possible in this study. This was between the use of the default setting and the 40% reduction reported by others. Reference Marchant24,Reference Bernstein, Alexander, Castellano, King, Humpherys and Bhuva25 Others still sub-divided their medium categories, having a reduction of ~50% in the smaller and a reduction of −20 to +4% in the larger. Reference Kotre and Willis19,Reference Pauwels, Silkosessak, Jacobs, Bogaerts, Bosmans and Panmekiate30 Again, in Figure 5a, the gentle slope at the default setting (1080 mAs) explains this variation. Finally, for the larger pelvis patients, optimisation of exposure settings ranged from increases of 100% Reference Wood, Moore, Horsfield, Saunderson and Beavis22,Reference Marchant24 and 40% 34 to remaining at the default settings. Reference Bernstein, Alexander, Castellano, King, Humpherys and Bhuva25 In this study also, by increasing the kV setting by ~20%, use of the medium default exposure settings was possible for larger patients. These increases are supported by Figure 5a and the steeper gradient in noise was between 1000 and 2000 mAs. It is noted that this comparison of data from the literature is mutable due to the variation in selecting patient size categories and also due to the variation in equipment used (Elekta, Varian OBI, Varian TrueBeam).
Limitations
This study was performed on a single linac type from a single manufacturer (Varian Truebeam) and results may not be transferrable to alternative linacs from the same or other manufacturers. A further limitation was the small sample size used to determine the mAs settings for the large and small size categories for the thorax and pelvis patients. This was despite collecting data for almost 2 years on ten linacs. The small sample is representative of our population in these categories, but further review and potentially further optimisation of these settings will be carried out as the sample size increases. Finally, the time to match images in phase 3 coincided with a change from a weekly to a daily imaging protocol for H&N and pelvis treatments. Therefore, a true comparison of change in matching time due solely to change in mAs settings was not possible for this phase of the qualitative image assessment. However, despite this, neither the H&N nor the pelvis phase 3 match times varied significantly from the match times of the Varian default mAs settings used in phase 1. Therefore, the reduction in image quality score was used to determine the most appropriate mAs settings without impact on image matching time.
Conclusion
Varian TrueBeam CBCT mAs settings have been optimised for dose and image quality based on patient size for three treatment sites: pelvis, thorax and H&N. The average patient diameter was a suitable metric to categorise patient size compared to patient circumference and CT exposure settings. A single size group was determined for head, while pelvis and thorax were divided into three groups with an average diameter of ≤26 , >26 ≤36 and >36 cm. Phantom measurements confirmed that noise in CBCT images are higher than in CT images, even at significantly larger exposure settings. These phantom measurements provided confidence that variation of ~±20% in dose should still result in a clinically usable image. Using this information in the clinic, qualitative assessment of image quality was implemented in phases with mAs increments of ~±20%. Qualitative assessment reduced the dose in clinical head images by −50%, in thorax images by −66, −25 and +25% for small, medium and large patient sizes, respectively, and in pelvis images by −80% for small patients, −20% for medium patients. For large pelvis patients, the default pelvis obese setting (i.e., +20% kV) was optimised by −35%. These optimised CBCT settings did not affect the time required to match images for these sites.
Acknowledgements
Acknowledgements are extended to the NICC radiotherapy department and in particular Jean Smith for implementing this study and to all radiographers for grading the clinical images. Acknowledgements are also extended to Cyril Mitchell for help in the design and manufacture of the optimisation phantom.
Financial Support
This research received no specific grant from any funding agency, commercial or not-for-profit sectors.
Conflict of Interest
None.