Introduction
Soil minerals control the fate and transport of radioactive cesium (137Cs) in subsurface environments primarily through interfacial adsorption processes. Consequently, understanding mineral–radionuclide interactions is critical for long-term environmental management following nuclear accidents (Ohnuki and Kozai, Reference Ohnuki and Kozai2013; Benedicto et al., Reference Benedicto, Missana and Fernández2014; Chitrakar et al., Reference Chitrakar, Makita and Sonoda2014; Missana et al., Reference Missana, Benedicto, García-Gutiérrez and Alonso2014; Yu et al., Reference Yu, Ohnuki, Kozai, Sakamoto, Tanaka and Sasaki2017). Phyllosilicates such as clay minerals and micas have been investigated extensively as primary Cs+ adsorbents, and Cs+ interactions with their interlayers, frayed edges, and basal surfaces have been well characterized at the molecular scale (Bostick et al., Reference Bostick, Vairavamurthy, Karthikeyan and Chorover2002; Fan et al., Reference Fan, Tanaka, Tanaka, Sakaguchi and Takahashi2014; Fuller et al., Reference Fuller, Shaw, Ward, Haigh, Mosselmans, Peacock, Stackhouse, Dent, Trivedi and Burke2015; Mukai et al., Reference Mukai, Hirose, Motai, Kikuchi, Tanoi, Nakanishi, Yaita and Kogure2016; Ruiz Pestana et al., Reference Ruiz Pestana, Kolluri, Head-Gordon and Lammers2017; Okumura et al., Reference Okumura, Kerisit, Bourg, Lammers, Ikeda, Sassi, Rosso and Machida2018; Li et al., Reference Li, Tang, Liu, Chang and Zhang2021; Zhang et al., Reference Zhang, Liu, Dai, Zhu, Liu and Jia2022). In contrast, although manganese (Mn) oxides exhibit extremely high sorption capacities for trace metals (Post, Reference Post1999; Dyer et al., Reference Dyer, Pillinger, Newton, Harjula, Möller and Amin2000; Wegorzewski et al., Reference Wegorzewski, Grangeon, Webb, Heller and Kuhn2020; Li et al., Reference Li, Yin, Zhu and Zhuang2024), the underlying mechanisms of Cs+ adsorption by Mn oxides, particularly tunnel-structured varieties such as todorokite, remain poorly understood.
Todorokite is a common tectomanganate featuring one-dimensional nanopores approximately 6.9 Å × 6.9 Å in size, formed by 3 × 3 Mn octahedral chains (Post and Bish, Reference Post and Bish1988; Post et al., Reference Post, Heaney and Hanson2003). This mineral provides unique structural features for selective metal retention (Dyer et al., Reference Dyer, Pillinger, Newton, Harjula, Möller and Amin2000; Ohnuki and Kozai, Reference Ohnuki and Kozai2013; Chitrakar et al., Reference Chitrakar, Makita and Sonoda2014; Yu et al., Reference Yu, Ohnuki, Kozai, Sakamoto, Tanaka and Sasaki2017; Zhang et al., Reference Zhang, Zhu, Ma, Kang, Hu, Li and Chen2020). Yu et al. (Reference Yu, Ohnuki, Kozai, Sakamoto, Tanaka and Sasaki2017) systematically investigated Cs adsorption on todorokite across an exceptionally wide Cs+ concentration range of 10–10 to 10–1 M using radiotracer techniques for low concentrations; they revealed that todorokite displays significant Cs+ retention capacity comparable to that of phyllosilicates at low concentrations (<10–8 mol L–1), but negligible capacity at high concentrations. This concentration dependence suggests distinct adsorption mechanisms operating at different concentration regimes, which explains why todorokite has been overlooked in typical laboratory settings at high Cs+ concentrations (~10–6 mol L–1, ppm levels in solution). Given that 137Cs concentrations in atmospheric fall-out were estimated at ~10 ppt levels within weeks of the Fukushima nuclear accident (Ohnuki and Kozai, Reference Ohnuki and Kozai2013; Mukai et al., Reference Mukai, Hirose, Motai, Kikuchi, Tanoi, Nakanishi, Yaita and Kogure2016), a fundamental mechanistic insight into Cs+ adsorption at these dilute limits is essential for understanding the role of Mn oxides in controlling 137Cs mobility.
However, elucidating the fundamental adsorption mechanisms of Cs+ on todorokite surfaces remains experimentally challenging. Ion-exchange modeling studies have proposed two-site adsorption schemes (Yu et al., Reference Yu, Ohnuki, Kozai, Sakamoto, Tanaka and Sasaki2017; Min and Kim, Reference Min and Kim2022), but these assignments are derived solely from isotherm fitting, and do not provide crystallographic identities for the actual binding sites. Moreover, spectroscopic techniques such as Cs LIII-edge extended X-ray absorption fine structure spectroscopy require high Cs+ concentrations (0.05–0.5 mol L–1) to achieve sufficient signal-to-noise ratios to examine the molecular speciation of Cs+ (Yu et al., Reference Yu, Ohnuki, Kozai, Sakamoto, Tanaka and Sasaki2017). As a result, such spectroscopic data contain overlapping signals of multiple heterogeneous species that prevent the deconvolution of adsorption mechanisms at trace Cs+ concentrations. Thus, the molecular-scale interactions of Cs+ with todorokite under environmentally relevant, low-concentration conditions remain unresolved.
The aim of the present study was to investigate the molecular-level mechanisms of Cs+ adsorption on todorokite employing molecular dynamics (MD) simulations. MD simulation is a powerful tool for probing mineral–water interface structures at atomistic resolution and for extracting thermodynamic free energies that are difficult to obtain experimentally, thereby complementing spectroscopic and batch adsorption studies (Kerisit and Liu, Reference Kerisit and Liu2014; Loganathan and Kalinichev, Reference Loganathan and Kalinichev2017; Ho and Criscenti, Reference Ho and Criscenti2021; Li et al., Reference Li, Tang, Liu, Chang and Zhang2021; Subramanian and Lammers, Reference Subramanian and Lammers2022; Kim et al., Reference Kim, Hwang, Lee and Kwon2025). Previous MD studies on radionuclide adsorption have focused primarily on phyllosilicates, and MD simulation work for Mn oxides, particularly for tectomanganates, is lacking. In this study, todorokite tunnels and external surfaces were expected to provide concentration-dependent binding sites for Cs+. MD simulations combined with free-energy calculations were used to systematically explore Cs+ binding configurations at representative external (100) and (010) surfaces and within tunnel nanopores of todorokite, and to calculate equilibrium adsorption constants that were subsequently integrated into macroscopic isotherm models to assess the contributions of intra-tunnel and external-surface sites across concentration ranges.
Methods
Simulation models
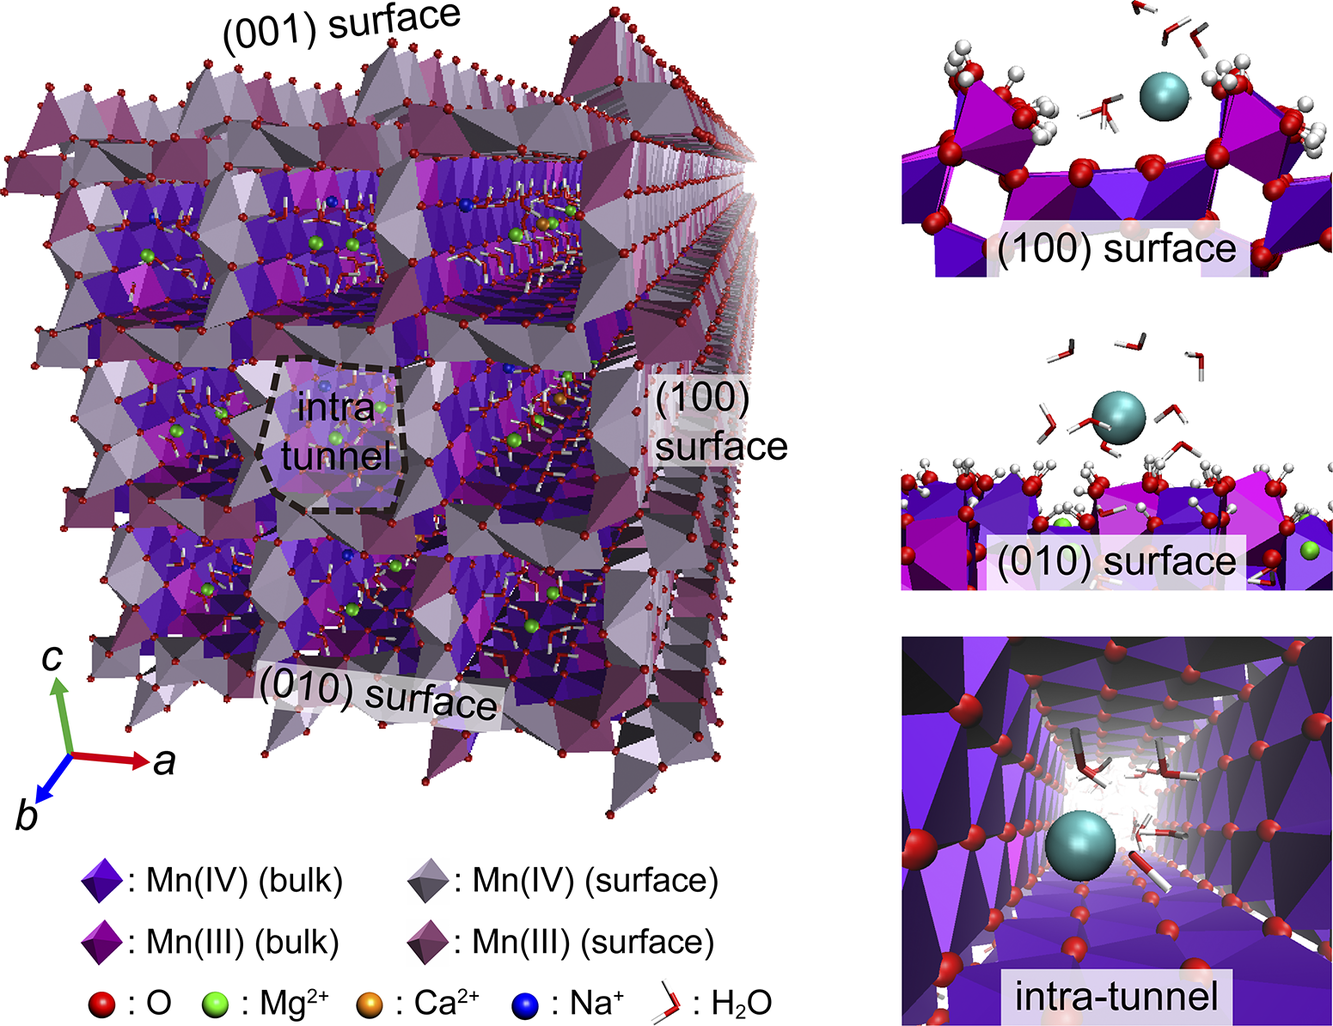
The todorokite bulk structure was constructed as a 3 × 10 × 3 supercell based on an established experimental unit cell (Post et al., Reference Post, Heaney and Hanson2003). This model has an average oxidation state (AOS) of 3.73 for total Mn and a structural formula of Mg2+0.5Na+0.4Ca2+0.1[Mn4+4.4, Mn3+1.6]‧3.6H2O; additional structural details are provided elsewhere (Kim and Kwon, Reference Kim and Kwon2022). Mn3+ was substituted randomly at corner-sharing octahedral sites of Mn, following experimental evidence (Post and Bish, Reference Post and Bish1988). Todorokite typically occurs as rod-shaped crystals. To present external adsorption sites, two slab models representing (100) and (010) cleaved surfaces were created from the bulk structure. The (100) surface corresponds to the {100} lateral walls of exposed tunnels, whereas the (010) surface is a crystallographic plane that forms the interface between the internal tunnel space and the aqueous phase (Fig. 1). Each slab model included a 50 Å-thick water column perpendicular to the cleaved surface at both sides (see Fig. S1 in the Supplementary material). The water layer contained 1330–1340 H2O molecules, corresponding to a density of 1 g cm–3, with one Cs+ or sodium ion (Na+) plus a distant chloride (Cl–) as the adsorbing ion-counterion pair. Terminal atoms of the slab models were hydroxylated to obtain charge neutral surfaces. However, hydroxylation does not compensate the structural charge arising from Mn3+ substitution in the tunnel framework. In bulk todorokite, this structural charge is balanced by tunnel cations, whereas for the (100) surface cleaving the crystal exposes Mn3+ octahedra and removes their compensating tunnel cations. To compensate the structural charge deficit, additional Cs+/Na+ ions were introduced to the (100) surface.
(Left) Perspective view of a todorokite model cleaved along the {010} and {100} planes. (Right) Representative MD simulation snapshots of adsorbed Cs+ complexes. Only a fraction of the hydrating H2O molecules is shown for visual clarity.

Figure 1. Long description
The leftmost panel presents a perspective 3D model of todorokite, cleaved along the 0 1 0 and 1 0 0 planes. The structure is built from interconnected polyhedra, with purple and gray diamonds marking M n four plus and M n three plus in bulk and surface positions. Red spheres represent O, green for M g two plus, orange for C a two plus, blue for N a plus, and small white-red clusters for H two O. The intra-tunnel region is outlined centrally. The bottom left shows crystallographic axes a, b, c. On the right, three panels display molecular dynamics snapshots: the top shows a Cs plus ion and partial H two O molecules above the 1 0 0 surface; the middle shows Cs plus at the 0 1 0 surface; the bottom shows Cs plus inside the intra-tunnel. Each right panel is labeled with its respective region. The legend at the bottom decodes all color and shape assignments for ions and atoms.
Crystallographically, the external (100) surface has heterogeneous adsorption sites arising from varied edge geometries and Mn3+ substitution patterns (see Fig. S2 in the Supplementary material). This surface consists of parallel rows of protruding Mn octahedra separated by terraces of three Mn octahedral chains, creating step-edge adsorption sites. These step edges are structurally asymmetric, forming an acute angle (Ac) on one side and an obtuse angle (Ob) on the other. Given the distinct adsorption energetics of these geometries, Ac and Ob sites were further classified according to the local Mn3+ distribution, as sites coordinated by a single Mn3+ octahedron (Ac1/Ob1) or by two Mn3+ octahedra (Ac2/Ob2). The specific location of Mn3+ is denoted by the suffixes ‘b’ for the base/terrace octahedron and ‘t’ for the top/protruding octahedron (Fig. S2).
MD simulations
All MD simulations were performed using GROMACS (Berendsen et al., Reference Berendsen, van der Spoel and van Drunen1995), with the velocity Verlet algorithm (Verlet, Reference Verlet1967) and a time step (∆t) of 1 fs in the numerical integration of the Newtonian equations of motion for all atoms. Interatomic interactions were described using the pair potentials of Newton and Kwon (Reference Newton and Kwon2020) for the Mn oxide framework, the established potentials of Babu and Lim (Reference Babu and Lim2006), Smith and Dang (Reference Smith and Dang1994b), and Smith and Dang (Reference Smith and Dang1994a) for aqueous cations including Cs+, and the SPC/E model for water (Berendsen et al., Reference Berendsen, Grigera and Straatsma1987) (see Table S1 in the Supplementary material). Lorentz–Berthelot combination rules were applied to calculate the interatomic energies of heterogeneous atom pairs (Allen and Tildesley, Reference Allen and Tildesley2017). Partial charges of surface models were determined by the bond valence concept, as described in a previous study (Kim et al., Reference Kim, Kim, Hyun and Kwon2022). Temperature was controlled using a Nose–Hoover thermostat (Shuichi, Reference Shuichi1991). A cut-off radius of 10 Å was used for short-range interaction. The bond stretching and bending modes of water molecules (Ow) were constrained using the SETTLE algorithm (Miyamoto and Kollman, Reference Miyamoto and Kollman1992). Each slab model was derived from the MD-simulated bulk structure of Mg2+0.5Na+0.4Ca2+0.1[Mn4+4.4, Mn3+1.6]‧3.6H2O (Kim et al., Reference Kim, Kim, Hyun and Kwon2022). The slab model systems underwent a 10 ns equilibration followed by a 50 ns production run in the number, volume, temperature (NVT) ensemble at 30 K. The last 30 ns of the MD trajectories were analyzed for structural analysis using GROMACS utilities and custom Python scripts. Coordination numbers were obtained by integrating the radial distribution functions up to the first-shell minimum. The simulation results were visualized using Visual Molecular Dynamics (Humphrey et al., Reference Humphrey, Dalke and Schulten1996).
Free energy calculations
Potential of mean force (PMF) calculations (Roux and Simonson, Reference Roux and Simonson1999) were performed with umbrella sampling to predict the adsorption free energy of cations to todorokite surface (Kumar et al., Reference Kumar, Rosenberg, Bouzida, Swendsen and Kollman1992; Hub et al., Reference Hub, De Groot and Van Der Spoel2010). For external surface adsorption, 60 umbrella windows were constructed by displacing a Cs+ or Na+ cation at 0.2-Å increments away from both the (100) and (010) surfaces. To ensure site-specific sampling of the heterogeneous sites (Table S2), the mobility of the target ion was confined within a 2.5-Å radius at each adsorption site. For the intra-tunnel sites, 260 reaction coordinate windows were generated, spanning the entire tunnel pathway from bulk water on one side to bulk water on the other side of the (010) slab model. Because pre-existing tunnel cations (Mg2+, Ca2+, Na+) strongly hindered sampling of Cs+/Na+ configurations within the tunnel space (6.9 Å × 6.9 Å), the tunnel cations (but not water) were removed to avoid unrealistically large, effectively infinite repulsive forces and to obtain well-converged PMF profiles. In each window, a harmonic potential with a force constant of 377 kJ/mol/Å2 was applied to constrain the cation along the reaction coordinate. This force constant ensured sufficient overlap between adjacent windows (Fig. S3). Each umbrella window (external surface and intra-tunnel) was sampled for 100 ns in the NVT ensemble at 300 K, with the sampling length selected based on convergence assessments for adequate statistical precision and reproducibility of the PMF profiles. PMF profiles were constructed from the simulation trajectories using the weighted histogram analysis method (Kumar et al., Reference Kumar, Rosenberg, Bouzida, Swendsen and Kollman1992; Hub et al., Reference Hub, De Groot and Van Der Spoel2010). Statistical uncertainties were estimated from triplicate simulations and are expressed as a shaded band around the mean profile. Site-weighted average profiles were obtained by weighting the profile of each site by its relative abundance in the corresponding model (see Table S2 in the Supplementary material).
The selectivity coefficient (
$ {{}_{\mathrm{Na}}{}^{\mathrm{Cs}}\mathrm{K}}_{\mathrm{sel}} $
 ) of Cs+ over Na+ was derived from the equilibrium constants (K) of Cs+ and Na+ adsorption. For each cation, K was obtained by integrating the PMF profiles across the sampling space (Chialvo et al., Reference Chialvo, Cummings, Cochran, Simonson and Mesmer1995; Kerisit and Liu, Reference Kerisit and Liu2014), as follows:

where W(r) is the PMF as a function of separation distance r between the ions and todorokite surfaces, and β is 1/kBT, with kB representing the Boltzmann constant. The lower integration limit (r min) at each adsorption site was defined as the shortest ion surface distance sampled in the PMF calculations, while the upper limit (r max) corresponded to the distance at which the ion was effectively in bulk aqueous solution and the cumulative integral approached a constant value. The ion exchange reaction between Na-todorokite and Cs+ is represented by:

The selectivity coefficient was then evaluated as the ratio between KCs and KNa:

Results and Discussion
Adsorption on the (100) surface
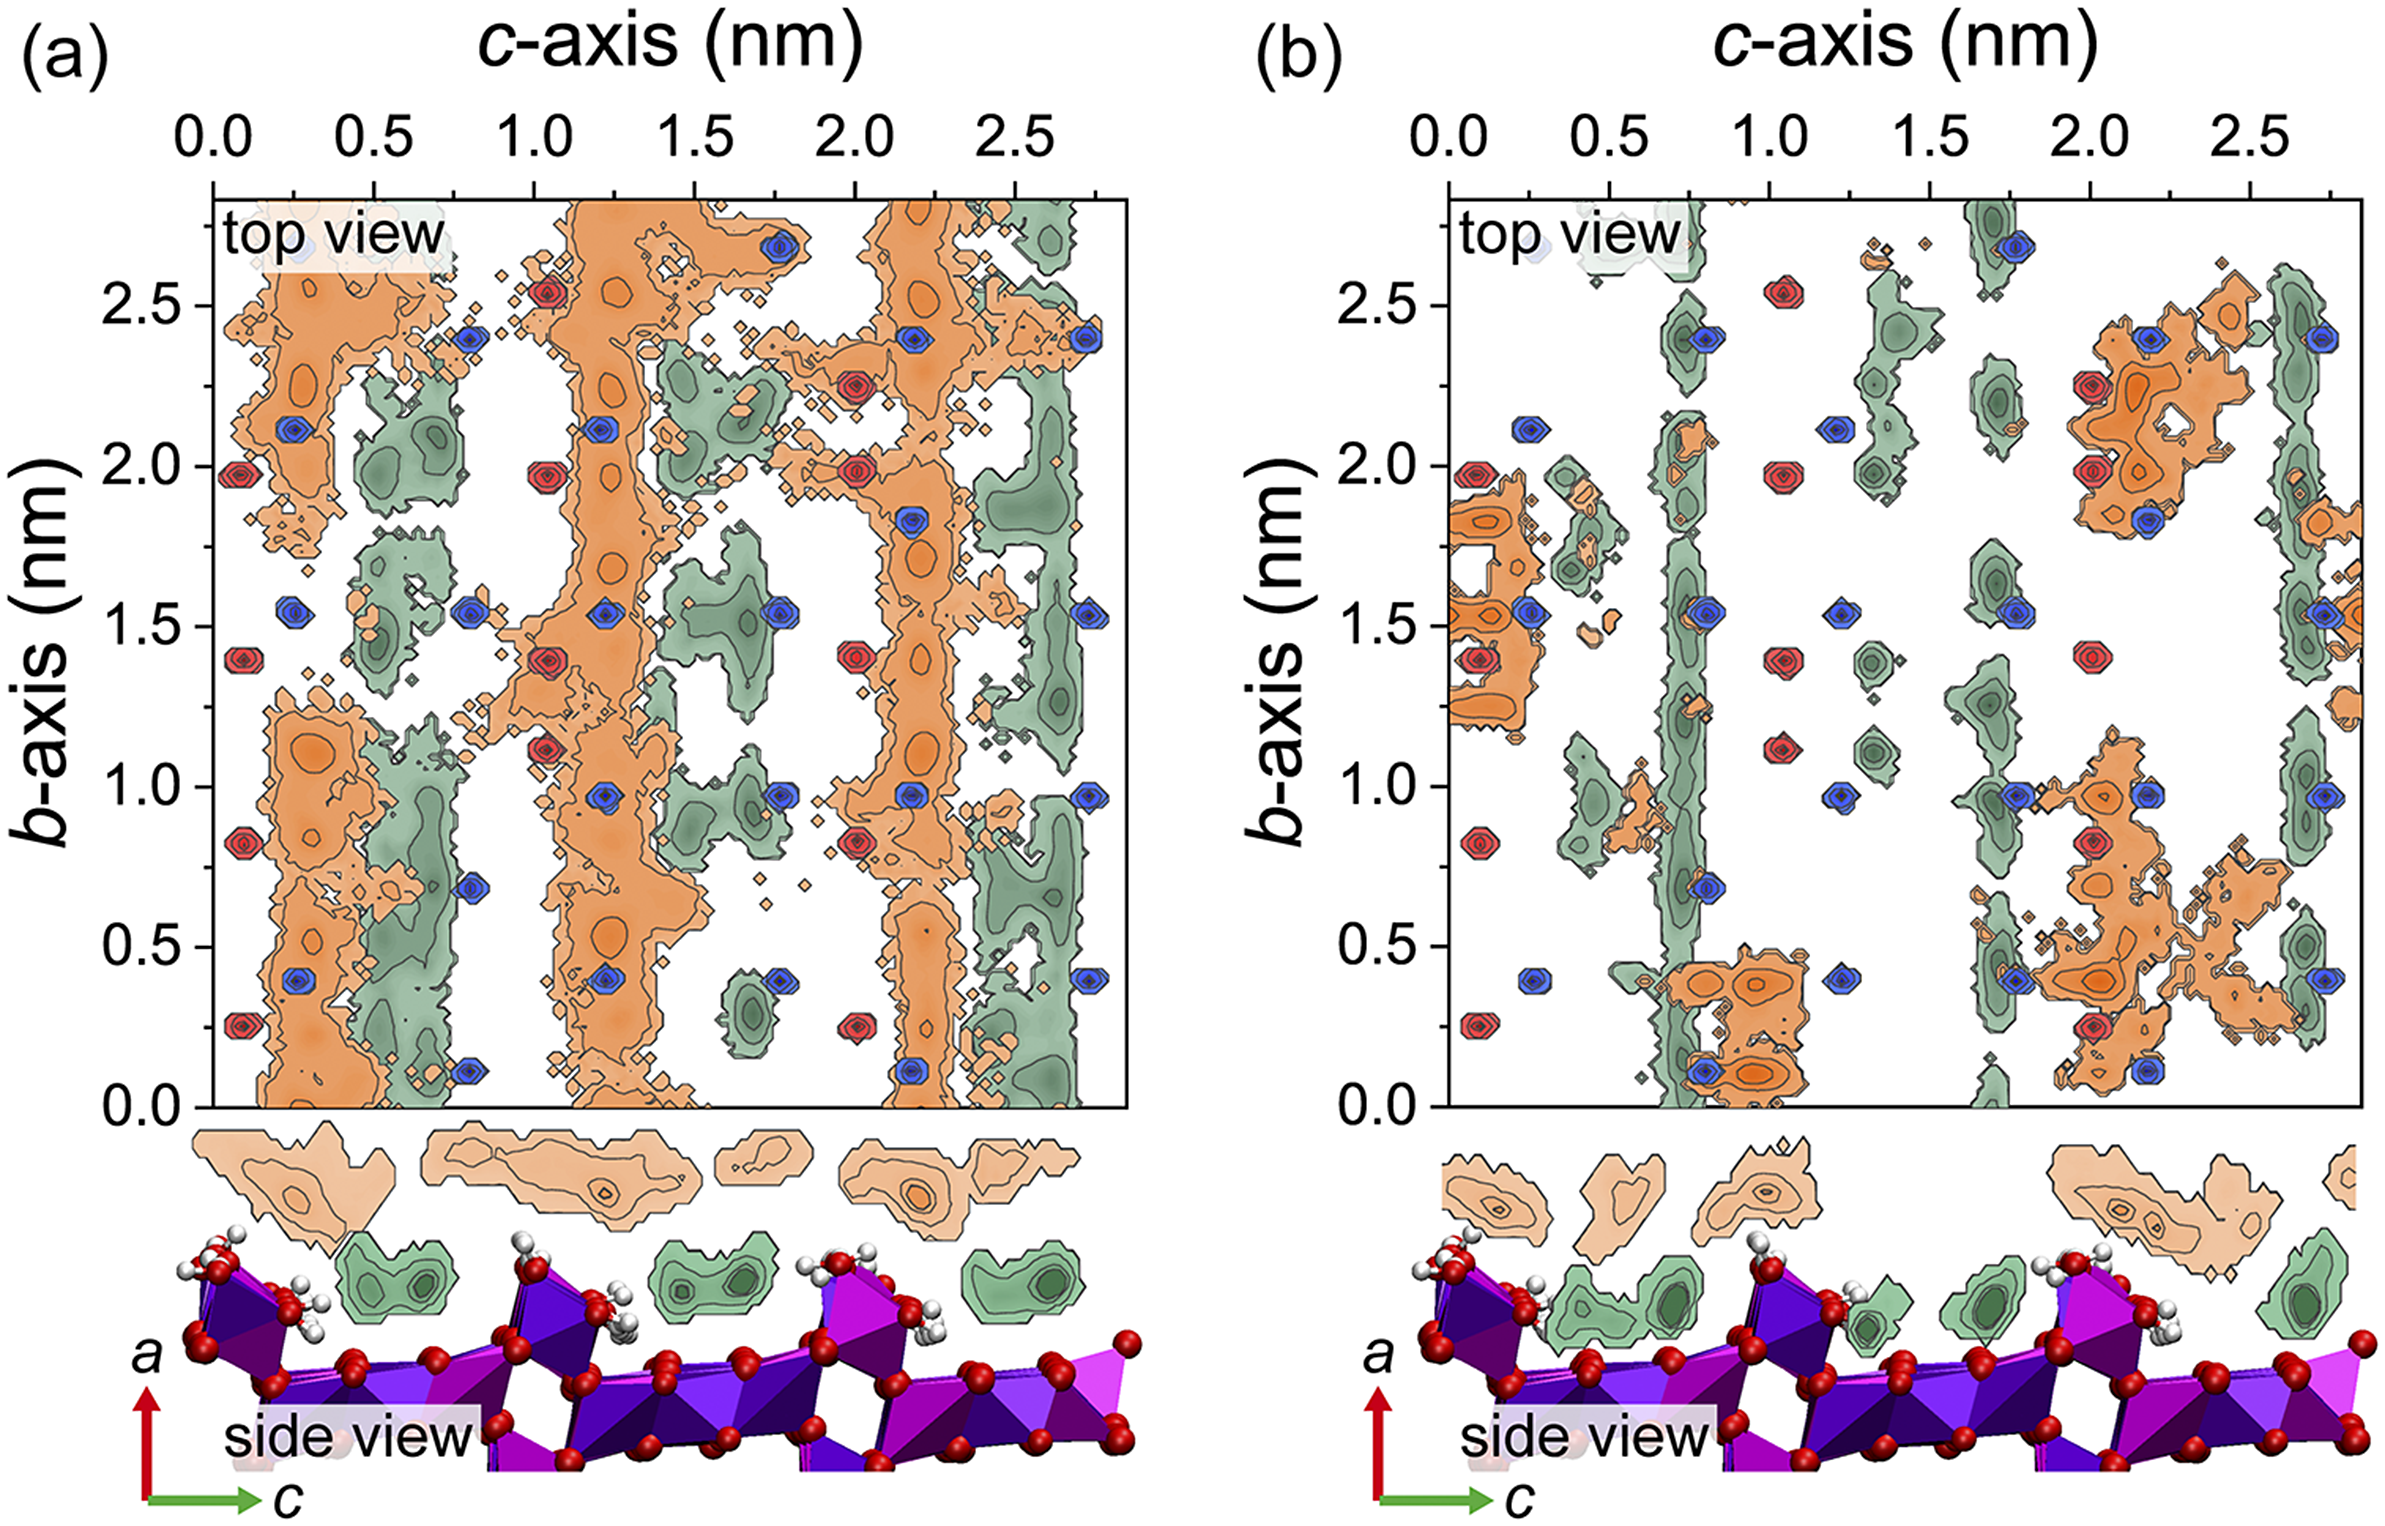
MD simulations identified two dominant adsorption sites on the corrugated (100) surface: step edges and protruding octahedra (Fig. 2). However, site preferences differed substantially between Cs+ and Na+. The Cs+ density distribution had a more delocalized and diffuse profile, whereas Na+ had a more localized and fragmented density distribution. Structural analysis showed that Cs+ ions atop protruding octahedra were coordinated by 3–4 surface oxygen atoms (Os) and 6–7 Ow at ~3.1 Å. At the step edges, Cs+ ions were coordinated by 5 Os at ~3.0 Å and 5 Ow at 3.1 Å. In contrast, Na+ ions along the step edges were coordinated by 3–4 Os and 2–3 Ow, with coordination distances of 2.4 Å; at the protruding octahedra, they were coordinated by 2 Os and 4 Ow, with comparable coordination distances.
Atomic density profiles for (a) Cs+ and (b) Na+ adsorbed on the todorokite (100) surface. Orange and green contours indicate ion densities associated with protruding Mn octahedra at ~5 Å from the surface and with step edges sites at ~2.5 Å from the surface, respectively. Upper panels show side views of the corrugated surface structure. Small red and blue centric contours represent Mn3+ positions at the corner-sharing Mn octahedra.

Figure 2. Long description
Panel a on the left shows Cs plus density on the todorokite 1 0 0 surface. The top view plot has c-axis in nanometers on the horizontal axis from 0 to 2.5 and b-axis in nanometers on the vertical axis from 0 to 2.5. Orange contours indicate ion densities near protruding Mn octahedra at approximately 5 angstroms from the surface, while green contours mark densities at step edge sites at approximately 2.5 angstroms. Small red and blue centric contours represent Mn super 3 plus positions at corner-sharing Mn octahedra. Below, the side view schematic shows the corrugated surface structure with labeled a and c axes. Panel b on the right displays Na plus density with the same axes and color scheme. The orange and green contours are more dispersed compared to panel a, indicating different adsorption patterns. Mn super 3 plus sites are similarly marked. Both panels highlight the spatial relationship between ion density and surface features, with side views reinforcing the structural context.
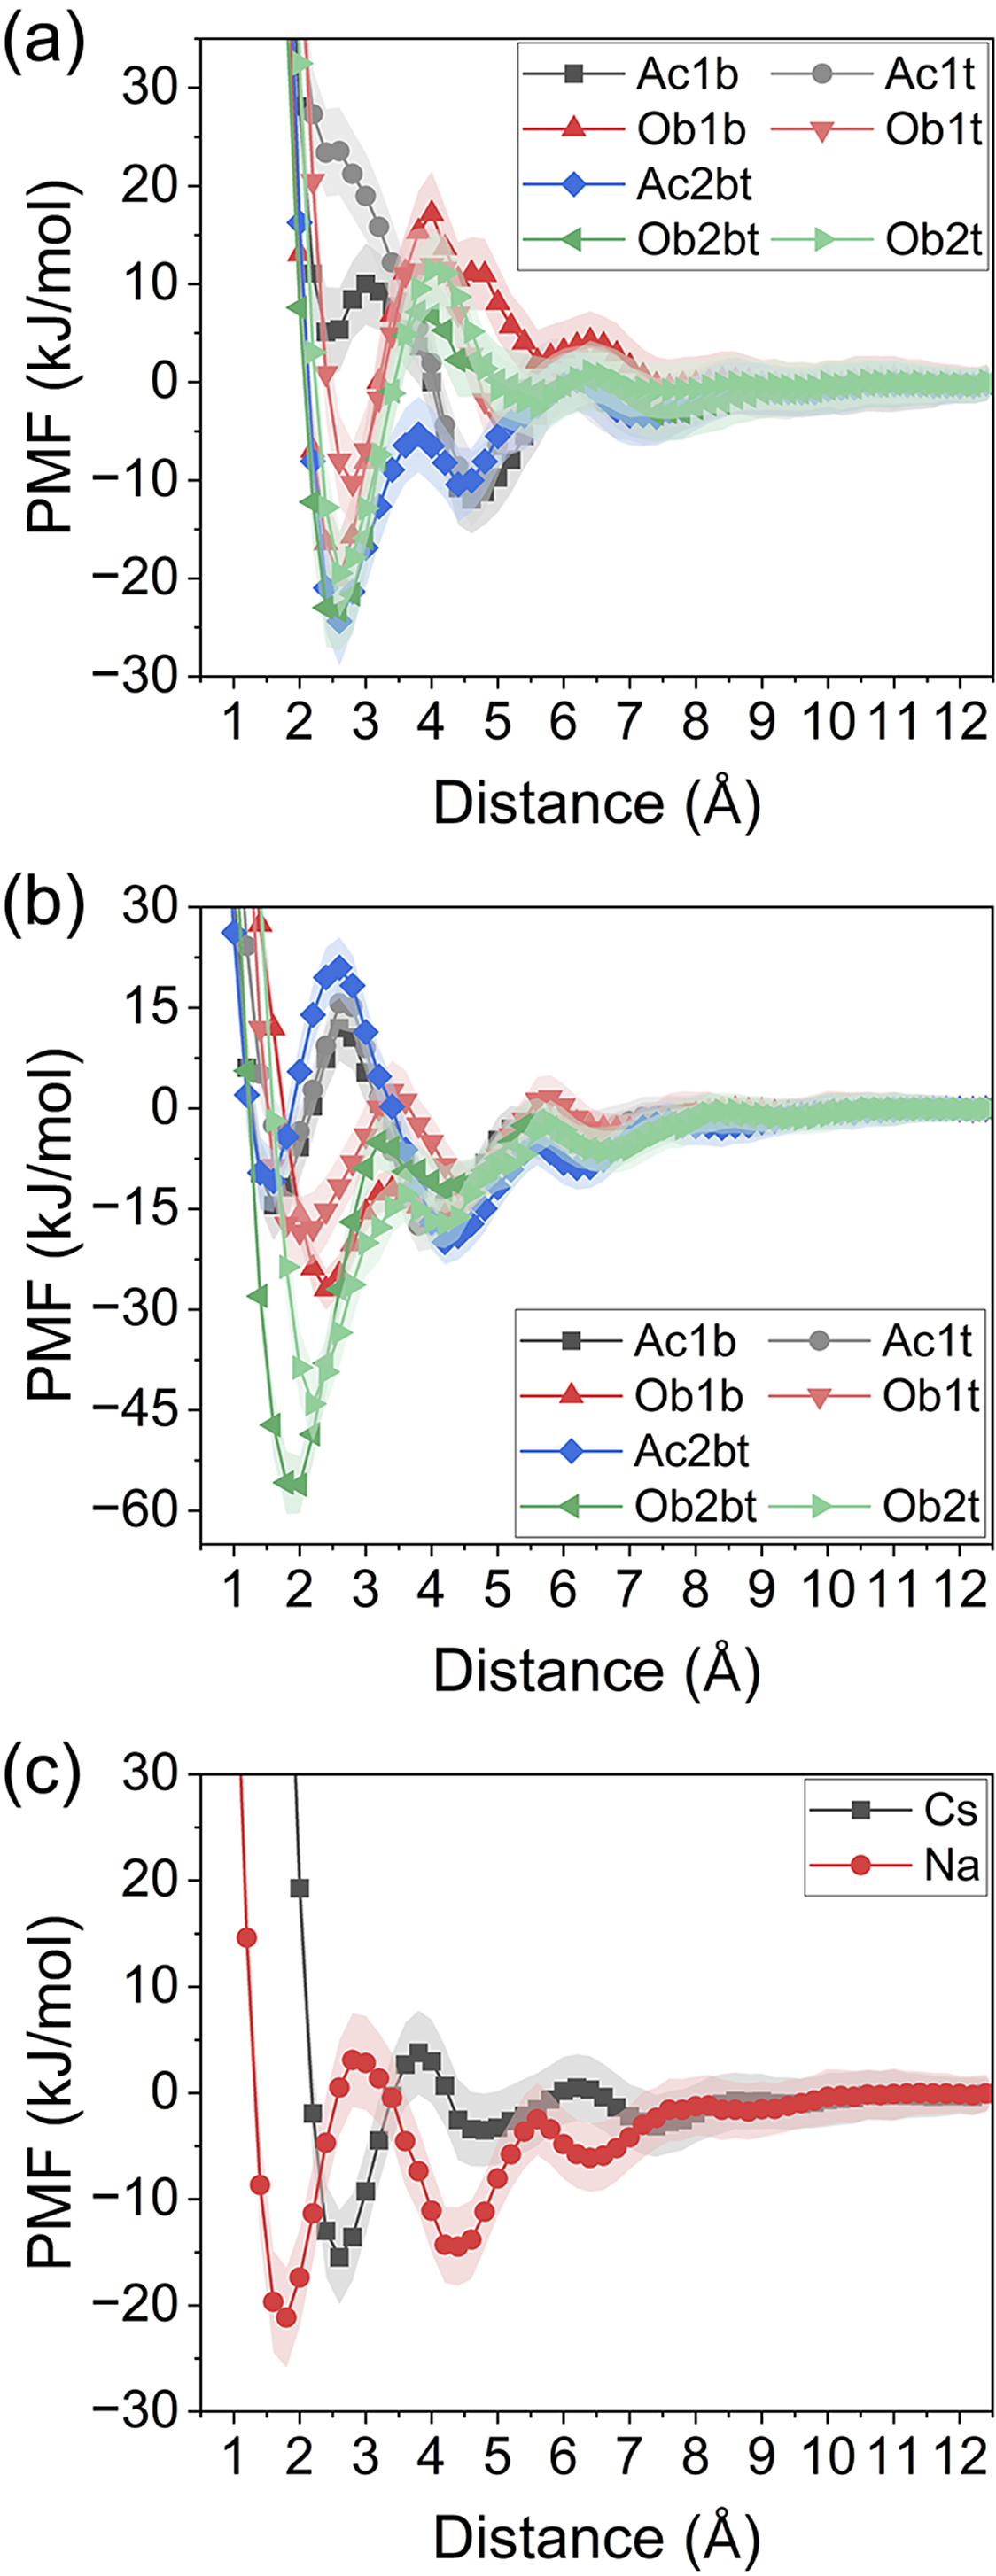
Calculated PMF profiles for Cs+ and Na+ are shown in Fig. 3 as a function of distance from the surface reference position (surface O atomic plane at step edges, as shown in Fig. S1 in the Supplementary material). The profiles revealed two inner-sphere (IS) minima (Cs+: ~2.5/5 Å and Na+: ~2/4.5 Å) and one outer-sphere (OS) minimum (Cs+: ~7.5 Å and Na+: ~6.5 Å), with the precise positions of energy minima offset by their different ionic radii (Shannon, Reference Shannon1976). This positioning difference indicates that the smaller Na+ remains closer to surface atoms, while the larger Cs+ occupies more extended binding sites. Indeed, when free energy was pooled across all sites using site-weighted averaging (Fig. 3c), Na+ exhibited more negative energy minima than Cs+.
Potentials of mean force (PMF) profiles for (a) Cs+ and (b) Na+ adsorption at candidate binding sites on the todorokite (100) surface (see Fig. S2 for site notation), shown as a function of distance from the surface for each site. (c) Site-weighted average PMF profiles comparing Cs+ and Na+ adsorption on the (100) surface.

Figure 3. Long description
Top panel labeled a shows P M F in kilojoules per mole on the y axis versus distance in angstroms on the x axis for C s plus at six sites: Ac1b, Ob1b, Ac2bt, Ob2bt, Ac1t, Ob1t, Ob2t. All lines show a sharp minimum between 1.5 and 2.5 angstroms, with Ac1b and Ob1b reaching about minus 20, Ac2bt and Ob2bt near minus 10, and Ob2t near zero. Middle panel b shows the same axes for N a plus at the same sites. All lines show a deeper minimum, with Ac1b and Ob1b reaching about minus 50, Ac2bt and Ob2bt near minus 30, and Ob2t near minus 10. Bottom panel c compares site-weighted averages for C s plus and N a plus, with C s plus (black squares) and N a plus (red circles). Both show a minimum near 2 angstroms, but N a plus reaches a lower minimum around minus 30, while C s plus reaches about minus 20. Legends in each panel identify the lines by site or ion.
For Cs+, the IS minima at 2.5 Å and 5 Å were associated with step edges and protruding octahedra, respectively, with OS complexes located above the protruding octahedra. At step edges, Ac-side sites (Ac1b, Ac1t) displayed unfavorable positive free energy, whereas Ob-side sites showed favorable negative energy (Fig. 3a; see also Fig. S4 in the Supplementary material). This energetics trend is consistent with the Cs+ spatial distribution showing Ob-side dominance (Fig. 2a), probably due to incompatibility between the larger ionic radius of Cs+ and the acute-angle Ac-side coordination environment. At the second minimum at 5 Å, Cs+ favored the Ac side through double-edge sharing coordination with protruding octahedra, with minor corner-sharing on the Ob side (see Fig. S5 in the Supplementary material). Detailed coordination environments as a function of distance from the surface are shown in Fig. S6 (Supplementary material). Na+ showed a similar pattern, with all IS minima at ~2 Å displaying negative free energy across the crystallographic binding sites and substantially lower energies on the Ob side (Fig. 3b; see also Fig. S7 in the Supplementary material), while at the second IS minimum (~4.5 Å), Na+ also favored the Ac side, forming double-edge-sharing complexes (see Fig. S8 in the Supplementary material, for the coordination environments). These site-specific energetics were in good agreement with spatial density distributions obtained from MD simulations (Fig. 2b), supporting the correspondence between occupied positions and energetically favorable sites.
Adsorption on the (010) surface
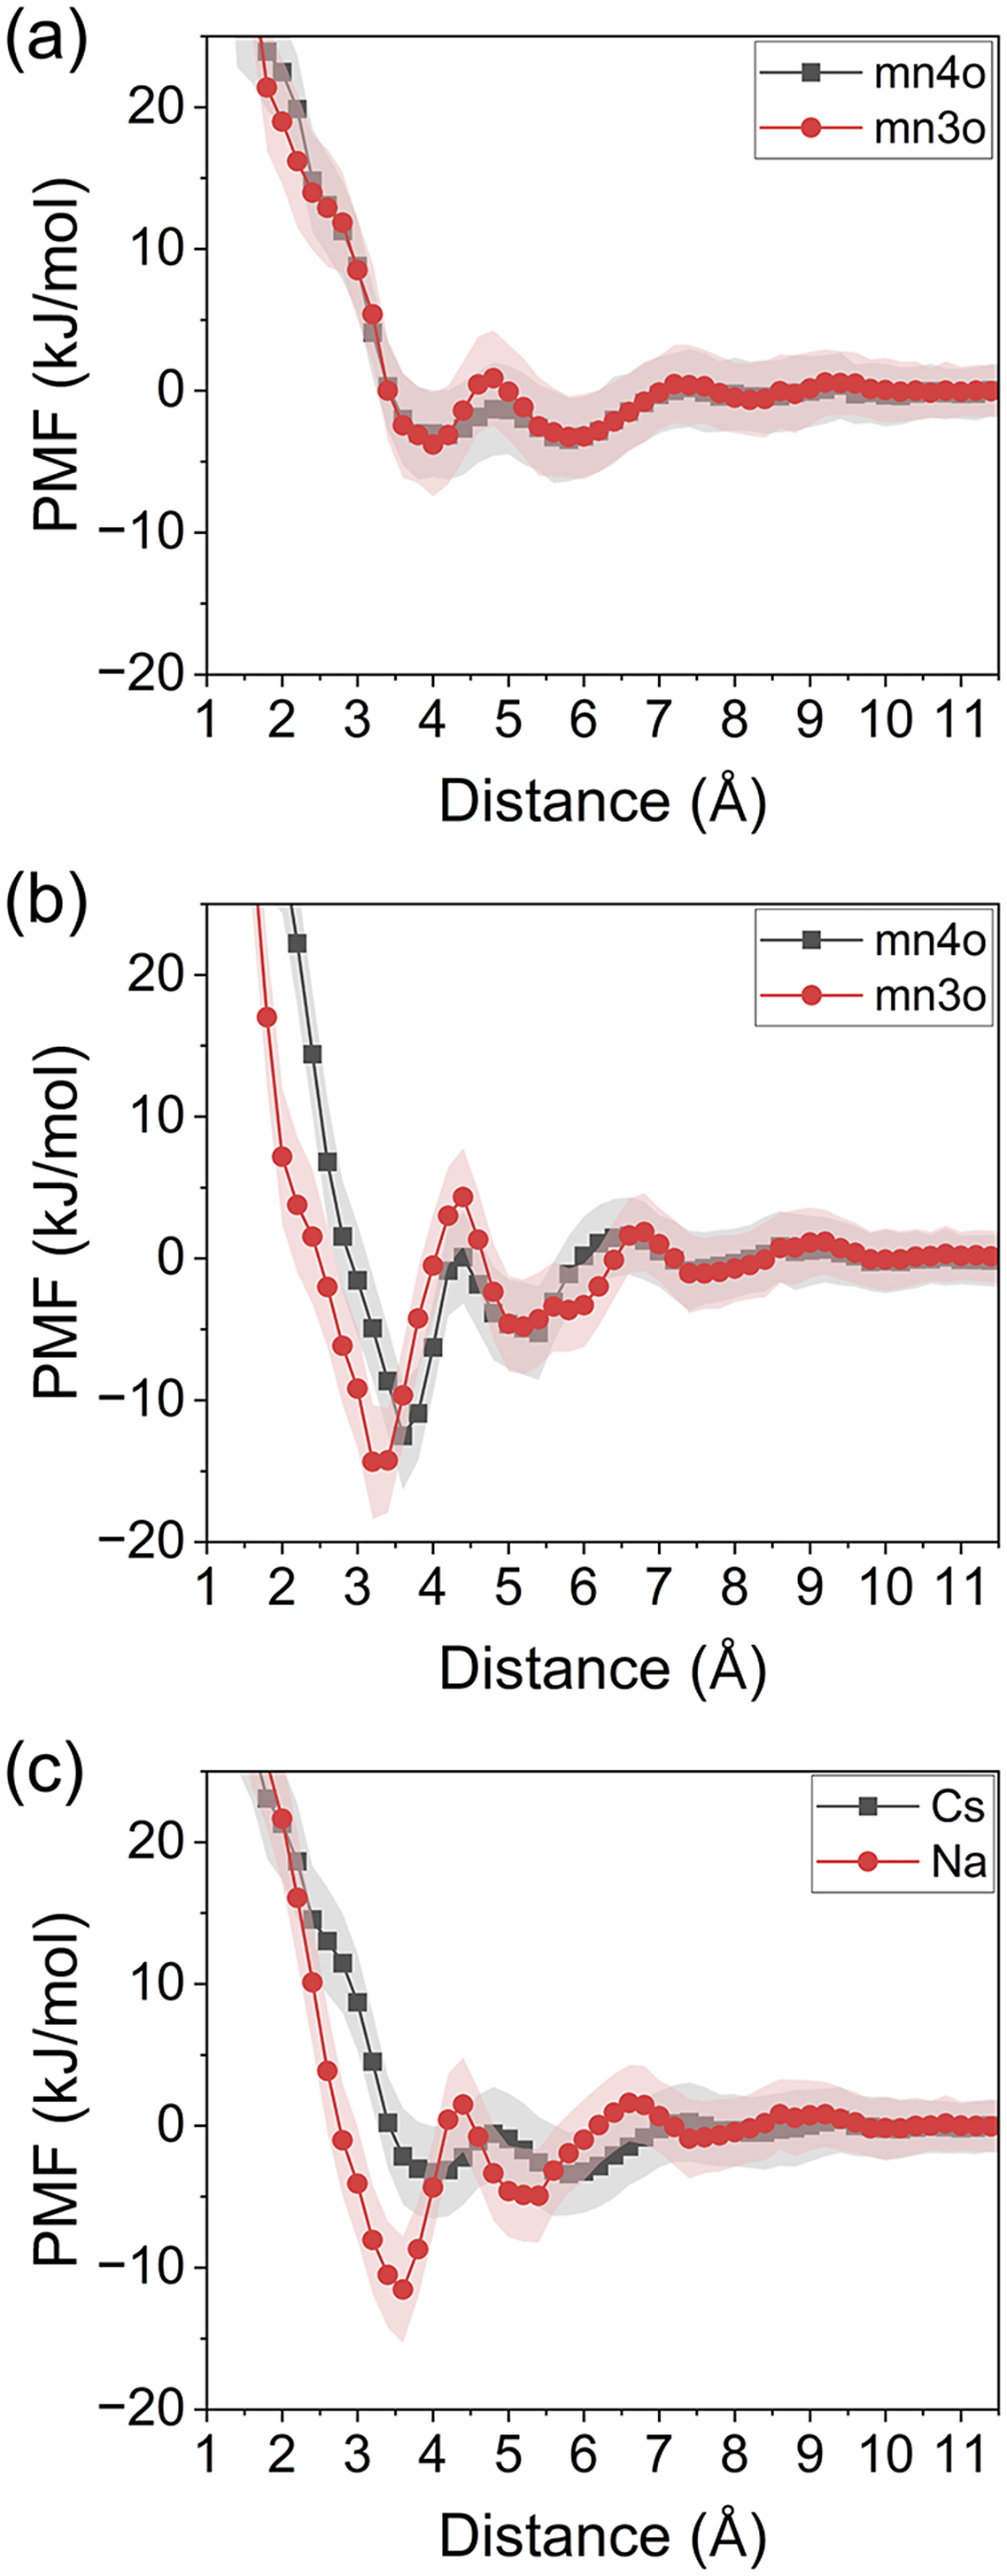
The (010) surface provided relatively planar binding sites overlying Mn3+ and Mn4+ octahedra (Fig. 1; see also Table S2 in the Supplementary material). Cs+ showed distinct free energy minima at 4 and 6 Å, corresponding to the formation of IS and OS complexes, respectively (Fig. 4a). Similarly, Na+ formed IS and OS complexes at 3.5 and 5 Å (Fig. 4b). Na+ exhibited site-specific energy minima dependent on the Mn oxidation state (Mn3+ vs Mn4+), whereas Cs+ appeared insensitive to the oxidation state. For Cs+, IS complexes were coordinated by 2–3 Os and 6–7 Ow, while OS complexes were coordinated by 8 Ow (see Fig. S9 in the Supplementary material); both complexes exhibited similar Cs–O bond distances of ~3.1 Å, consistent with the small free energy difference and relatively shallow energy wells characteristic of comparable IS and OS states for Cs+ (Fig. 4a). In contrast, for Na+, IS complexes showed much more negative free energy than OS complexes (Fig. 4b); IS complexes were coordinated by 2 Os and 4 Ow at the distance of ~2.4 Å, while OS complexes were coordinated by 6 Ow at comparable distances (see Fig. S10 in the Supplementary material).
Potentials of mean force (PMF) profiles for (a) Cs+ and (b) Na+ adsorption on the todorokite (010) surface as a function of distance from the surface, and (c) site-weighted average PMF profiles comparing the two cations.

Figure 4. Long description
The top panel labeled a plots P M F in kilojoules per mole on the y-axis versus distance in angstroms on the x-axis for C s plus adsorption. Two lines are shown: mn 4 o as black squares and mn 3 o as red circles. Both lines reach a minimum near distances 4 and 6, and level off near zero above distances 8. The middle panel labeled b shows N a plus adsorption with the same axes and legend. Both lines reach a minimum near distances 3.5 and 5, and stabilize near zero beyond distance 7. The bottom panel labeled c compares site-weighted averages for C s plus (black squares) and N a plus (red circles). Na has a minimum of minus 15 kilojoules per mole at approximately distance 3.5, but Cs has a minimum of minus 5 kilojoules per mole at approximately distance 4, and remain near zero from distance 8 to 11. Shaded regions around each line indicate uncertainty.
According to the site-weighted average PMF profiles, Na+ adsorption was more favorable than Cs+ adsorption on the todorokite (010) surface (Fig. 4c). The Na+ PMF profile exhibited two distinct thermodynamic features compared with Cs+: a higher-energy barrier between OS and IS states and a deeper IS energy minimum. These features indicate that IS complexation is thermodynamically more stable for Na+ than for Cs+. In contrast, the Cs+ PMF profile showed comparable adsorption energy between OS and IS complexes, separated by relatively small energy barriers. This shallow-energy landscape would facilitate transitions between the two binding modes on nanosecond timescales, consistent with the dynamic exchanges between IS and OS complexes observed in previous MD simulations (Kim et al., Reference Kim, Kim, Hyun and Kwon2022).
Adsorption within tunnels
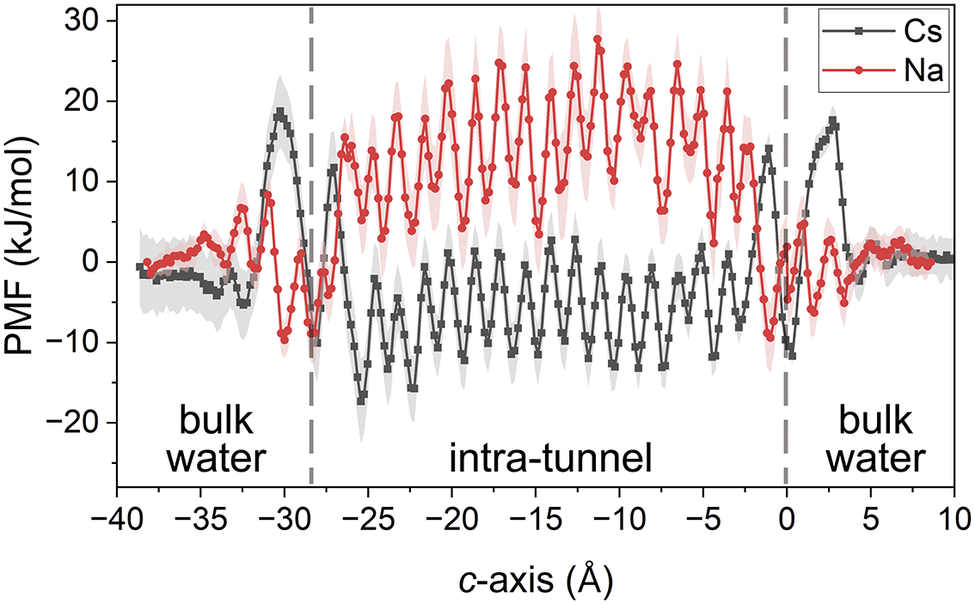
PMF profiles within the tunnel structure revealed trends opposite to those observed on external surfaces (Fig. 5), with Cs+ strongly preferred over Na+ in the tunnel nanopores. The PMF energies oscillated within tunnels as a function of cation position along the tunnel axis (from –28 to 0 Å; Fig. 5) due to periodic variation in the adsorption sites. Cs+ consistently exhibited stable binding energy (negative PMF values relative to bulk water), whereas Na+ displayed energy barriers (positive PMF values). This reversal in selectivity indicates that Cs+ ions are thermodynamically stable within the tunnel nanopores, while Na+ ions are unstable relative to the bulk aqueous phase. Local PMF profiles may be influenced by short-range Mn3+ ordering in the tunnel framework, which was not considered in the present study; however, such effects on the PMF of individual ions are expected to be minor compared with the PMF difference between Cs+ and Na+. The nearly symmetric PMF profiles for both cations further indicate adequate sampling convergence, with equivalent transition barriers for entry and exit from the tunnel space.
Potentials of mean force (PMF) profiles for Cs+ and Na+ within a todorokite tunnel structure as a function of cation position along the tunnel axis. The tunnel interior ranges from –28 Å to 0 Å, with bulk-water regions located at positions below –28 Å and above 0 Å (see Fig. 1).

Figure 5. Long description
The line graph plots P M F in kilojoules per mole on the y-axis versus c-axis position in angstroms on the x-axis, ranging from minus thirty-eight to ten. Three regions are labeled: bulk water on the left from minus thirty-eight to minus twenty-eight, intra-tunnel from twenty-eight to zero, and bulk water again from zero to ten. The C s profile is shown as a black line with square markers, and the N a profile as a red line with circular markers. Both profiles are nearly flat in the bulk water regions, with values near zero. In the intra-tunnel region, both profiles show pronounced oscillations, with N a exhibiting higher amplitude oscillations than C s. The oscillations for N a reach up to about twenty-five kilojoules per mole and down to about five, while C s oscillates between approximately zero and minus fifteen. Shaded regions around each line indicate uncertainty. The legend in the upper right identifies the black line as C s and the red line as N a.
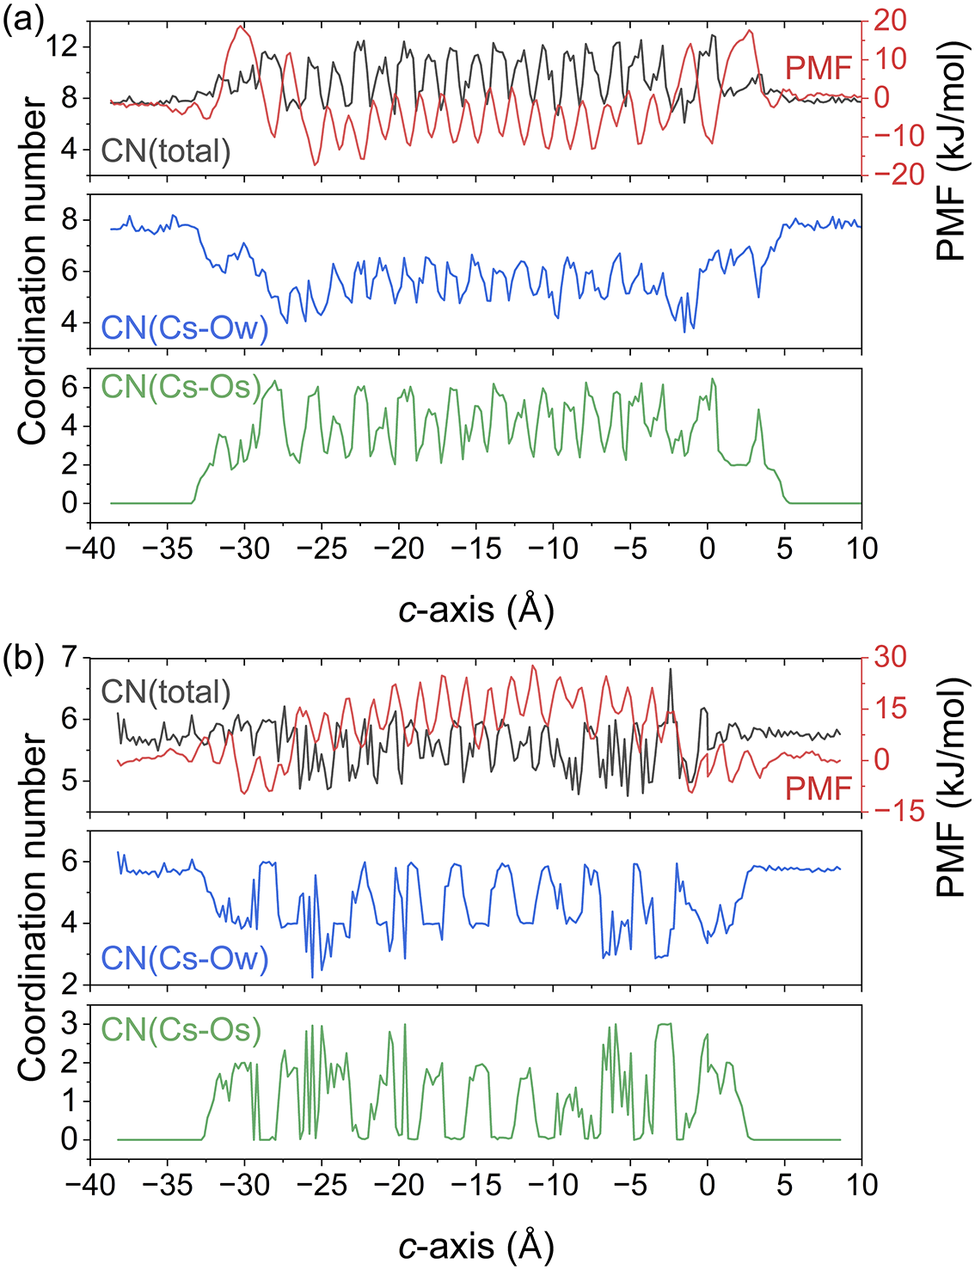
Todorokite tunnels have three primary adsorption sites: corner sites adjacent to corner-sharing Mn octahedra, edge sites along edge-sharing Mn octahedral chains, and center sites deep within the tunnel framework (see Fig. S11 in the Supplementary material). Cs+ exhibited strong site selectivity, with ~85% of occupied corner sites as IS complexes and only 3% of occupied center sites as OS complexes. Structurally, coordination environments reflect this selectivity. Cs+ IS complexes at corner sites were coordinated by 5–6 Ow and 5–6 Os; at edge sites, coordination involved 3–5 Os, whereas Cs+ OS complexes were coordinated exclusively by 7–8 Ow (Fig. 6a). The PMF profiles showed that energy minima corresponded precisely to corner site occupancy, while energy maxima aligned with edge and center sites. This clear correspondence between favorable free energy sites and observed Cs+ positions indicates that the todorokite tunnel framework provides highly selective binding sites for Cs+. In contrast, Na+ exhibited fundamentally different tunnel behavior, with no clear site preference. Approximately 40% of Na+ formed OS complexes at center sites (coordinated by 5.8 Ow), while 40% formed IS complexes at corner sites (coordinated by 2 Os and 4 Ow) (Fig. 6b). Critically, the Na+ positions showed little correspondence with the PMF energy landscape, indicating that the tunnel provides no energetically preferred site for Na+. This contrast suggests that the todorokite tunnel provides efficient adsorption sites for Cs+, but not for the smaller Na+ ion.
Coordination numbers of (a) Cs+ and (b) Na+ with water oxygen atoms (Ow) and tunnel surface oxygen atoms (Os) as a function of cation position along the todorokite tunnel axis. Positions below –28 Å and above 0 Å represent the bulk water phase. PMF profiles are overlain for correlation analysis with coordination environment.

Figure 6. Long description
The top panel, labeled a, shows three vertically stacked line graphs for Cs plus. The top subplot plots total coordination number in black and P M F in red, with the left y-axis labeled Coordination number from 3 to 13 and the right y-axis labeled P M F from minus 20 to 20 kilojoules per mole. The x-axis is c-axis in angstroms, ranging from minus 40 to 10. The total coordination number oscillates between 8 and 12, while the P M F shows peaks and troughs, with a value of approximately minus 10 kilojoules per mole. The middle subplot shows C N open parenthesis Cs dash O w close parenthesis in blue, with values decreasing from about 8 to 4 as the c-axis increases. The bottom subplot shows C N open parenthesis Cs dash O s close parenthesis in green, with values oscillating between 2 and 6. The bottom panel, labeled b, repeats this structure for Na plus. The top subplot plots total coordination number in black and P M F in red, with the left y-axis from 4 to 7 and the right y-axis from minus 15 to 30 kilojoules per mole. The total coordination number oscillates between 5 and 6, and the P M F shows a peak about 15 kilojoules per mole . The middle subplot shows C N open parenthesis Na dash O w close parenthesis in blue, with values decreasing from about 6 to 4. The bottom subplot shows C N open parenthesis Na dash O s close parenthesis in green, with values oscillating between 0 and 3. Both panels indicate that coordination numbers and P M F profiles vary periodically along the c-axis, with distinct behaviors for Cs plus and Na plus.
Significant free energy barriers were found in the Cs+ PMF profile at the tunnel interface (positions –33 to –28 Å and 0 to +5 Å; Fig. 5), particularly at entry and exit points. In contrast, the Na+ PMF profile showed negligible barriers at equivalent positions. These results imply that Cs+ intercalation and deintercalation must overcome substantial energy barriers, whereas Na+ migration is largely unimpeded. This contrasting feature may be attributable to the geometric constraints of the rigid todorokite tunnel (6.9 Å × 6.9 Å) relative to the hydrated ion sizes. The larger hydrated Cs+ ion (hydrated diameter: 6.2 Å) experiences significant steric hindrance at the interface, such that partial dehydration is required to traverse the tunnel entrance. This dehydration process is evident in the coordination profiles; CN(Cs-Ow) decreased from ~8 in bulk water to ~6 at the tunnel entrance, and further to 4–5 upon entry into the tunnel interior (Fig. 6a). Concurrently, CN(Cs-Os) increased from 0 to 2–4 at the interface. Thus, the significant energy barriers for Cs+ represent the energetic cost of the simultaneous desolvation and structural rearrangement required to coordinate with tunnel Os. In contrast, the more compact hydrated Na+ (hydrated diameter: 4.8 Å) fitted through the tunnel entrance without requiring significant dehydration, maintaining most of its hydration shell throughout the entry process.
The high-energy barriers at the interface, complemented by deep, free energy wells inside tunnels, have profound implications for Cs+ retention. Because energy barriers control entry kinetics and interior wells determine the thermodynamic stability of intercalated species, todorokite tunnels are equipped with a dual Cs+ mechanism that enables effective sequestration of Cs+ within the tunnels. Experimental studies have shown that todorokite exhibits significantly lower Cs+ desorption rates (50–70%) compared with layered birnessite and illite (> 95%) under similar conditions (Chitrakar et al., Reference Chitrakar, Makita and Sonoda2014; Yu et al., Reference Yu, Ohnuki, Kozai, Sakamoto, Tanaka and Sasaki2017; Murota et al., Reference Murota, Tanoi, Ochiai, Utsunomiya and Saito2020). According to the PMF features, the interfacial barriers would slow desorption, while the deep interior wells would keep accumulated Cs+ in a thermodynamically favorable state, which explains the pronounced Cs+ retention of tectomanganates observed at experimental time scales.
Concentration-dependent adsorption mechanisms
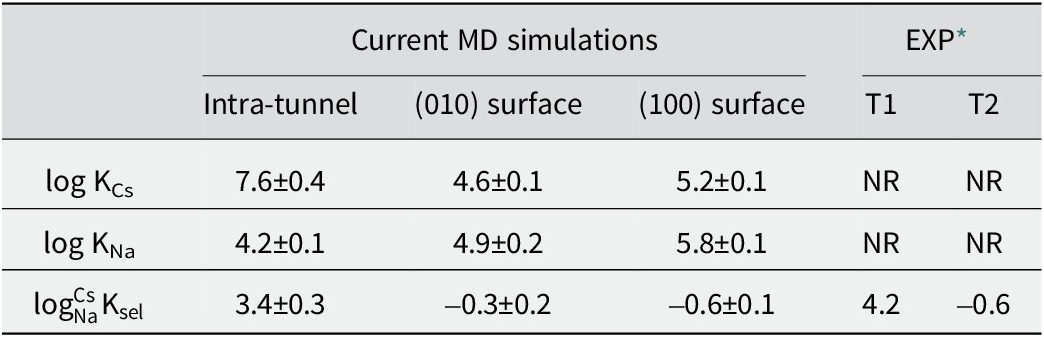
Equilibrium constants derived based on site-weighted average PMF profiles for cation adsorption are listed in Table 1. The calculated log
$ {{}_{\mathrm{Na}}{}^{\mathrm{Cs}}\mathrm{K}}_{\mathrm{sel}} $
 values indicate strong Cs+ selectivity in tunnel sites, whereas Cs+ and Na+ compete for external sites. Yu et al. (Reference Yu, Ohnuki, Kozai, Sakamoto, Tanaka and Sasaki2017) proposed two dominant adsorption sites on todorokite: a high-affinity (T1) site saturating at very low concentrations and a low-affinity (T2) site dominating uptake at higher concentrations. Although the precise crystallographic identities of these sites have not been resolved experimentally, the close agreement between the MD-derived selectivity coefficients and experimental values (Table 1) indicates that T1 and T2 sites probably correspond to intra-tunnels and external (010)/(100) surface sites, respectively.
Calculated equilibrium constants (log K) for Cs+ and Na+ adsorption and selectivity coefficients (log
$ {{}_{\mathrm{Na}}{}^{\mathrm{Cs}}\mathrm{K}}_{\mathrm{sel}} $
 ) at todorokite surfaces

Table 1. Long description
The table contains three rows for log K sub C s, log K sub N a, and log K sub sel for N a and C s, and five columns. The first column lists the property. The next three columns are under Current M D simulations: Intra-tunnel, open parenthesis 0 1 0 close parenthesis surface, and open parenthesis 1 0 0 close parenthesis surface. The last two columns are under E X P: T 1 and T 2. For log K sub C s, values are 7.6 plus or minus 0.4 for Intra-tunnel, 4.6 plus or minus 0.1 for open parenthesis 0 1 0 close parenthesis surface, 5.2 plus or minus 0.1 for open parenthesis 1 0 0 close parenthesis surface, and N R for both T 1 and T 2. For log K sub N a, values are 4.2 plus or minus 0.1 for Intra-tunnel, 4.9 plus or minus 0.2 for open parenthesis 0 1 0 close parenthesis surface, 5.8 plus or minus 0.1 for open parenthesis 1 0 0 close parenthesis surface, and N R for both T 1 and T 2. For log K sub sel for N a and C s, values are 3.4 plus or minus 0.3 for Intra-tunnel, minus 0.3 plus or minus 0.2 for open parenthesis 0 1 0 close parenthesis surface, minus 0.6 plus or minus 0.1 for open parenthesis 1 0 0 close parenthesis surface, 4.2 for T 1, and minus0.6 for T 2. N R means not reported. E X P refers to experimental results from Yu et al. 2017.
* EXP = experimental results (Yu et al., Reference Yu, Ohnuki, Kozai, Sakamoto, Tanaka and Sasaki2017); NR = not reported.
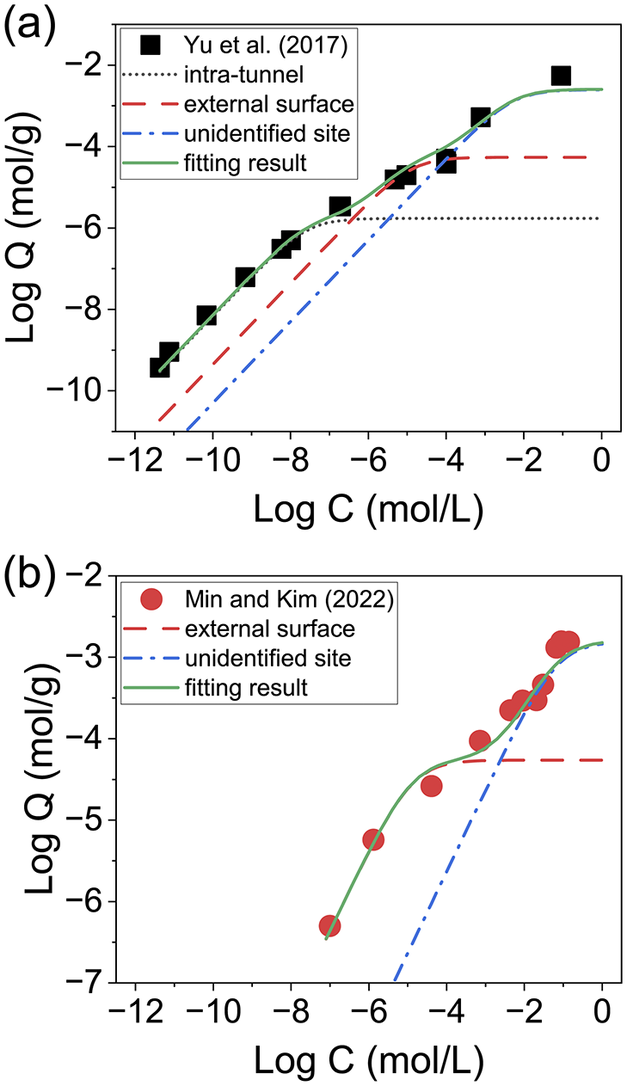
However, fitting published isotherm data with the MD-derived KCs values (Fig. 7) demonstrated that the crystallographic sites represented in the present simulations reproduced Cs+ uptake only up to [Cs+] < ~10–4 mol L–1, and failed to capture the full high-concentration regime of the experiments. A Langmuir model using the MD intra-tunnel constant (logKCs = 7.6) successfully reproduced the low-concentration proportion of the Yu et al. (Reference Yu, Ohnuki, Kozai, Sakamoto, Tanaka and Sasaki2017) isotherm ([Cs+] < ~10–8 mol L–1) (Fig. 7a), whereas external-surface constants (logKCs = 4.6 or 5.2) matched the data only over the intermediate concentration range of [Cs+] ≈ 10–8–10–4 mol L–1. Min and Kim (Reference Min and Kim2022) reported a two-site model that did not include sub-ppb concentrations; the MD external surface constants reproduced their data only between 10–8 and 10–4 mol L–1, underfitting at higher concentrations (Fig. 7b). These high-concentration discrepancies suggest the involvement of additional adsorption sites that are not fully represented in the idealized models. Such sites probably reflect heterogeneous surface terminations and/or confined pore environments arising from oxide particle aggregation.
Comparison of experimental Cs+ adsorption isotherm data for todorokite from (a) Yu et al. (Reference Yu, Ohnuki, Kozai, Sakamoto, Tanaka and Sasaki2017) and (b) Min and Kim (Reference Min and Kim2022), with Langmuir model fits using MD-predicted equilibrium constants for intra-tunnel and external-surface sites (Table 1).

Figure 7. Long description
Panel a at the top plots Log Q in mol per g on the y-axis versus Log C in mol per L on the x-axis, ranging from minus twelve to zero. Black squares represent Yu et al. 2017 data. Four lines are shown: a black dotted line for intra-tunnel, a red dashed line for external surface, a blue dash-dot line for unidentified site, and a green solid line for the fitting result. The fitting result closely follows the experimental data, with the intra-tunnel and external surface lines plateauing at different Log Q values. Panel b at the bottom uses the same axes and ranges. Red circles represent Min and Kim 2022 data. Three lines are shown: a red dashed line for external surface, a blue dash-dot line for unidentified site, and a green solid line for the fitting result. The fitting result again tracks the experimental data, with the external surface and unidentified site lines diverging at higher concentrations. Legends in both panels identify data sources and line types.
The multi-site Langmuir approach informed by the MD simulations enabled one-to-one mapping between crystallographic adsorption sites and macroscopic adsorption behavior across varying Cs+ concentrations (Table S3): intra-tunnel sites governing low-concentration uptake (ppb levels), external surface sites dominating the intermediate-concentration regime (ppm levels), and unidentified sites accounting for adsorption at much higher concentrations. These findings demonstrate the value of integrating molecular simulations with macroscopic adsorption models for interpreting complex experimental behavior.
Conclusions
Long-term radionuclide immobilization following nuclear accidents is a critical challenge in environmental and nuclear-waste management. Because radioactive fallout deposits 137Cs at sub-ppb levels, understanding its adsorption and desorption behavior under dilute concentrations is essential for risk assessment. Nevertheless, investigating Cs+ adsorption mechanisms at environmentally relevant concentrations remains challenging for conventional experimental approaches. In this study, MD simulations revealed that Cs+ predominantly forms IS complexes within todorokite tunnels, whereas both IS and OS complexes coexist on external surfaces. PMF calculations combined with isotherm comparison further revealed a concentration-dependent shift in Cs+ binding from intra-tunnels at trace concentrations to external surfaces at higher loadings. Mechanistically, the tunnel framework imposes substantial energy barriers that kinetically inhibit Cs+ desorption to bulk water. These results demonstrate that the unique 3 × 3 todorokite tunnel framework selectively stabilizes Cs+ at trace concentrations through partially desolvated IS coordination, whereas external surfaces provide less selective, reversible adsorption at higher adsorbate levels. These findings identify todorokite as a potentially important geochemical scavenger for long-term 137Cs immobilization following nuclear contamination events.
Supplementary material
The supplementary material for this article can be found at https://doi.org/10.1017/cmn.2026.10034.
Author contributions
Juhyeok Kim: Conceptualization, Methodology, Software, Formal Analysis, Investigation, Writing – Original Draft. Kideok D. Kwon: Conceptualization, Resources, Supervision, Writhing – Review & Editing.
Data availability statement
The data that support the findings of this study are available from the corresponding author upon reasonable request.
Financial support
This research was supported by the Basic Science Research Program through the National Research Foundation of Korea (NRF) (RS-2024-00333926), and the computations were performed using the supercomputing resources of the Korea Institute of Science and Technology Information (KSC-2025-CRE-0030). J.K. acknowledges scholarship support from the Korea Ministry of Education (RS-2023-00273714).
Competing interests
The authors declare no competing interests.none.