Studies of policy diffusion across political boundaries have themselves diffused through political science (Graham, Volden and Shipan Reference Graham, Volden and Shipan2013), encompassing a growing variety of jurisdictions and contexts (Meseguer and Gilardi Reference Meseguer and Gilardi2009) that ranges from policy diffusion in US states (for example, Walker Reference Walker1969; Berry and Berry Reference Berry and Berry1990; Nicholson-Crotty Reference Nicholson-Crotty2009) to the adoption of neo-liberal policies across nations (for example, Simmons and Elkins Reference Simmons and Elkins2004; Brooks Reference Brooks2005; Gilardi Reference Gilardi2005; Swank Reference Swank2006; Hays Reference Hays2009). While it is now well established that policies diffuse, it is still unclear what causal mechanisms are at play (Gilardi Reference Gilardi2010), even when studies make a conceptual distinction among diffusion between units deriving from competition, learning, emulation and imposition (Graham, Volden and Shipan Reference Graham, Volden and Shipan2013).
Our argument is that competition and learning are likely to be intimately related to each other. By learning from the successes of others, an organization may compete more effectively while avoiding some of the costs of in-house policy innovation, including political risk. Moreover, the resources freed up by such learning can be used to push up short-run performance levels higher than would otherwise be feasible. Firms enjoy latecomer advantage because they can adopt, purchase or reverse engineer innovations at a fraction of the original cost of development (Fagerberg and Godhino Reference Fagerberg and Godhino2005; Perkins and Neumayer Reference Perkins and Neumayer2005). Latecomer advantage may be more relevant in competitive political markets than in economic ones, because public policies are not subject to patent protection.
We distinguish between copying others for competitive purposes and learning that is related to purely internal processes within an organization. That is, policy transfer can take place either for competitive reasons (competitive learning) or because the organization has an internal preference for learning (pure learning). Although there can be blind copying, we prefer the term ‘learning’ because it incorporates the decision-making processes that take place within a political organization. Drawing on the recent literature in economics on games played on networks (Goyal Reference Goyal2007), we develop a model in which units are linked by two sorts of ties: (1) a network of competition that specifies for each pair of units the degree to which mobile taxpayers and businesses are likely to move between them in response to performance differentials and (2) an information network that specifies for each unit i the proportion of attention it will pay to the performance of unit j when seeking performance-enhancing policies. Here competitive pressure is a function of an organization's centrality in the competition network and performance differentials. We show that the greater the degree of competitive pressure an organization is under, the greater its disposition to learn from others. We show that the influence of unit j's performance on unit i is conditioned by the competitive pressure on i, how well j performs, and the strength of informational ties between i and j. Our approach builds on formal models of diffusion that discuss the advantages of freeriding on others’ policy innovation (Volden, Ting and Carpenter Reference Volden, Ting and Carpenter2008) and competition for geographically mobile assets (Baybeck, Berry and Siegel Reference Baybeck, Berry and Siegel2011).
The model allows us to ask the counterfactual question ‘what would organizations do if they did not compete with others for mobile voters and economic assets?’ (that is, if competitive learning were absent). This counterfactual suggests that it is possible to develop an empirical test that sharply differentiates between processes of diffusion that are ultimately based on the competition for mobile assets, on the one hand, and forms of learning that do not have a rationale in competition with other units, on the other. Our econometric approach builds on the work of authors who use spatial econometrics to examine diffusion (Swank Reference Swank2006; Franzese and Hays Reference Franzese and Hays2008; Cao Reference Cao2010). We use data on the performance levels of large English local government units, which provides a particularly suitable empirical context: a clear policy decision to change performance and limited unit heterogeneity. We find evidence for both pure learning and competitive learning, although the evidence leads us to question whether the organizations we deal with are best treated as unitary actors.
Our main contribution is to develop a theory and a method of testing different diffusion mechanisms that are potentially transportable to other political systems and across international borders. Our formal model sharpens the focus on mechanisms that cause diffusion and generates simple methods of testing for competitive learning between units, which will inform future studies in areas such as the diffusion of taxation policies and structural reforms.
We begin by surveying the recent international and domestic literature on diffusion, stressing the relative lack of attention given to the interaction between learning and competition. We then make the case for using games played on social networks. After developing our formal model, we describe the context for performance measures in English local government and conduct statistical tests.
Policy diffusion across borders
Surveying hundreds of articles in the diffusion literature, Graham, Volden and Shipan (Reference Graham, Volden and Shipan2013) find it is possible to organize the discussion of causal mechanisms into four categories: learning, competition, coercion and socialization.Footnote 1 Learning occurs when the policy choices of others convey useful information in a context of uncertainty about which policy is best (Simmons, Dobbin and Garrett Reference Simmons, Dobbin and Garrett2006). Competition drives diffusion when there are spillovers from one unit's adoption of a policy onto others’ payoffs due to the movement of assets that respond to relative performance (Shipan and Volden Reference Shipan and Volden2008). For example, a country that is seeking to avoid pressure on its revenue base—for example if investors are moving mobile capital to a country with a better tax regime—could be under pressure from a neighbor.
While latecomer advantage is an underdeveloped theme in the political science literature, the complementary idea of innovator premium was certainly present in the earliest studies in the more general literature on technological diffusion. Yet this concept was usually accompanied by a more sociological account of diffusion: although innovators might reap a competitive premium, others copied what they recognized to be good practice among those in their information networks, and tended to network with people they perceived as similar (Rogers Reference Rogers2005, 39–101). This is one of the causal processes that can lead to cohesion models of the classic S-shaped diffusion curve (Valente Reference Valente1995). Alternatively, organizations in isomorphic positions within networks tend to adopt similar policies because they have similar functional requirements (Burt Reference Burt1987). Yet failing to copy others’ successful policies may be costly when competitive pressure is intense. Though Simmons and Elkins see competition and learning as ‘conceptually distinct’ (Reference Simmons and Elkins2004, 174), recent applied studies by political scientists certainly recognize that there are links between competition and learning in areas such as the adoption of neo-liberal policies: nations copy other nations that are successful in international trade competition (Simmons and Elkins Reference Simmons and Elkins2004; Brooks Reference Brooks2005). Graham, Volden and Shipan (Reference Graham, Volden and Shipan2013) recognize that there is a link between learning from other US states and competition for office within that state, if imported policies succeed. Yet until recently, the link between competition and learning has received little theoretical attention in political science.
Volden, Ting and Carpenter (Reference Volden, Ting and Carpenter2008) ask whether apparent diffusion through learning or emulation is actually due to independent adoption; they contrast models with and without strategic interdependence of decision making between units. In the game-theoretic model, decision makers recognize the benefits of letting others experiment with policy, and thus avoid the risks of temporarily adopting a policy that turns out to be ineffective. As a result, there is less policy experimentation in equilibrium than would be the case if decisions were made independently, as in their model with parametric decision making. In Baybeck, Berry and Siegel's (Reference Baybeck, Berry and Siegel2011) model, states within a federal system compete for individuals who can choose jurisdictions, based on their relative policies and the costs of relocation. There is a negative spillover if one state adopts the advantageous policy, because individuals move. In quantal response equilibrium, the probability that a state adopts a policy increases with revenue gains and decreases with costs. Revenue gains are conditioned by whether the other state has adopted that policy and (in effect) the geographical location of individuals within the two states.
Whereas both of these studies essentially involve two political units, we consider a game played between n >2 units. Success in attracting mobile individuals and firms is governed by relative performance (assessed by some yardstick measure) and by a social network that in essence specifies transaction costs for relocation (Baybeck, Berry and Siegel Reference Baybeck, Berry and Siegel2011). While we do not explicitly model the relationship between particular policies and performance, we assume that there are better and worse policies underlying the performance yardstick. Public authorities make a series of decisions or policies that affect performance; since the costs of deciding which of these decisions or policies are better are partly determined by how much can be learned from other units, informational freeriding is advantageous (Volden, Ting and Carpenter Reference Volden, Ting and Carpenter2008). How much can be learned depends on how well others perform based on some yardstick of competition, and a network governing the flow of information between units. Thus we bring together different aspects of recent formal work in political science.
To build our model, we draw on developments in the economics of games played on networks (Goyal Reference Goyal2007; Galeotti et al. Reference Galeotti, Goyal, Jackson, Vega-Redondo and Yariv2010). Generally in such games, the payoff for player i of choosing a particular strategy depends not only on the strategies of other players but also on the nature of the network that links i with other players. For instance, if j has no network relationship with i, i's payoff may not be directly dependent of j's choice. However, a network typically induces indirect dependency if k's rational course of action is linked with j's, and i's with k's, and so on. Because of the feedback induced by network connections, causality is complex and behavior depends on the properties of the overall network system, not just dyadic ties. Indirect dependencies also make it difficult to answer questions about the existence and nature of equilibria in network games, but considerable headway has been made in relation to potentially relevant areas such as competition between firms linked by learning networks (Goyal and Moraga-Gonzalez Reference Goyal and Moraga-Gonzalez2001), conformity and diversity when information is shared through networks (Bala and Goyal Reference Bala and Goyal2001), and games with public-goods externalities (Ballester, Calvó-Armengol and Zenou Reference Ballester, Calvó-Armengol and Zenou2006). Although it seems natural to model policy diffusion using such tools, especially given the prominence of ideas about networks in the relevant political science literature, we are not aware of any application of network games to date. However, urban economists have made extensive use of game theory to model interactions between local government units, and have estimated reaction functions using spatial weights to model network connections.Footnote 2
Empirically distinguishing different diffusion mechanisms presents methodological challenges (Bailey and Rom Reference Bailey and Rom2004), because a number of mechanisms are typically consistent with a given pattern of spatial adoption. At first sight, learning that is linked to purely internal processes appears to be hard to empirically differentiate from competitive learning. Even if there is no threat of losing mobile assets, failure to score well on performance yardsticks can have domestic electoral costs (Besley and Case Reference Besley and Case1995) and may reduce organizational autonomy or lead to low morale. The principle advantage of our formal model is that it immediately generates an econometric approach that allows us to test whether these forms of learning occur.
Model
In this section we develop a model in which authorities compete for investment and for the sort of voters they see as desirable—affluent professionals likely to pay local taxes and demand relatively little from the local welfare state. Authorities compete by performing well on a performance measure in which a high score indicates that the authority has adopted a set of ‘good practices’ in its policies. The extent to which an authority competes with others varies, based on factors such as how close together they are and how similar their local economies are. We represent the degree of competition between two authorities with a numerical score. The higher the competition score, the greater the strength of the tie between two authorities in the competition network. Success in competition can be attained by trying harder, but this has opportunity costs. For instance, an authority may bear the costs of policy innovation, including the failure of some ideas that are tried. Some of these opportunity costs can be avoided by learning methods and ideas from other authorities that have high performance scores. If an authority saves in this way it has more resources left to put into implementing policies, allowing it to perform better on the yardstick. Bureaucrats and elected politicians can also retain some of the resources that are saved to use at their discretion as rent income. The extent to which cost saving is possible depends on how easy it is for an authority to find out what other (successful) authorities are doing. Costs depend on how easy it is to get access to information. For instance, costs will be lower if officials regularly meet in regional forums. If information links with high-performing authorities are poorly developed, borrowing ideas from others is less useful. We represent the strength of information links by a second network.
Competition
Where there is a yardstick to measure the relative performance of units (Besley and Case Reference Besley and Case1995; Baybeck, Berry and Siegal Reference Baybeck, Berry and Siegel2011), mobile taxpayers and businesses may move to higher-performing units, depending on the costs of relocating and the relative tax rates. Policy can contribute to high scores and an improved competitive position, but in-house policy innovation is not costless. It may entail considerable bureaucratic effort, risks of failed experiments, and political resistance. Learning from the policies that lead others to perform well is likely to be cheaper. In addition to avoiding effort and failed initiatives, political resistance is likely to be lower if organized interests and vetoes can see that the policy has succeeded elsewhere. There are potential dangers of learning from others if their policies are actually poor ones that harm performance. Though mistakes are no doubt made on occasion, the cost of avoiding them by thoroughly checking information and tailoring others’ policies to local circumstances when necessary are probably lower than the costs of in-house innovation. Thus learning is likely to free up resources. Decision makers may retain this surplus as rents, but it is likely to be rational to use part of it to further enhance performance.
We model competition between n > 2 authorities. Mobile assets are tempted to move between i and j by performance differentials. But moving incurs transaction and relocation costs. The lower these are, the more any performance differential will tempt an asset to move, and the greater the potential for competition between i and j. The potential for competition between i and j is cij ≥ 0, cij = cji, cii = 0. If i performs better than j, i expects to attract mobile local taxpayers and mobile businesses from j; the greater the extent of competition between i and j, the larger the value of cij. A valued, non-directed graph is generated across n authorities; the edge between i and j takes on the value cij. We call this the extent of competition (for brevity competition) network.
Information and Attention
Information can be produced in-house, at some cost, or obtained by learning from others, which reduces the cost of performing at any given level. Let gij ≥ 0, gii = 0, denote a network link between i and j over which information about performance can flow. The network may be directed; that is, we do not necessarily assume gij = gij, i ≠ j. Let  $$${{{\rm{g}}}_{{\rm{ij}}}}'\,{\rm{ = }}\,{{{\rm{g}}}_{{\rm{ij}}}}{\rm{/}}\mathop{\sum}\limits_{{\rm{k}}\, \ne \,{\rm{i}}} {{{{\rm{g}}}_{{\rm{ik}}}}} $$$
.
Then we assume that in any given period, the proportion of time that i pays attention to j's performance is gij′; that is, i is more likely to pay attention to other authorities with which it has strong network ties. This could be motivated by a simple learning rule: if you do not know where you are likely to find the most useful information, attention is distributed in proportion to the marginal costs of enquiry, gij. We assume that if i pays attention to j, it learns more from it the higher j's performance. We denote the performance level of authority i by pi ε [0, ∞). So i's costs of performing at a given level are a decreasing function of:
 $$\mathop{\sum}\limits_{{\rm{j}}\, \ne \,{\rm{i}}} {{\rm{g_{ij}}}'{{{\rm{p}}}_{\rm{j}}}.} $$
This sum is the weighted average of the performance level of other authorities, where j's weight is higher if i has strong links with j and can learn more easily from it. That is, ideas about good practice should be available at lower cost if easy access to high-performing authorities is available.
Utility Functions
We assume local politicians’ payoffs increase with the net flow of mobile voters and businesses they can attract by relatively high performance. We also assume that high performance brings other payoffs. For politicians, these include greater chances of re-election and/or promotion; for bureaucrats they are higher salaries or increased chances of moving to more lucrative posts in other authorities. On the other hand, improving performance has costs, including rents foregone through shifting resources that had been used at the discretion of decision makers into areas that deliver a measureable service improvement.
We represent the utility function of decision maker in authority i as follows:
 $$\matrix{ {{{\rm{U}}}_{\rm{i}}}\, \,=\, \,{{{\rm{\ralpha }}}_{\rm i}}{{{\rm{p}}}_{\rm i}}\, \quad+\quad \,{\mathop{\sum }\limits_{{\rm {j\, \ne \,i}}}} {\rm{c_{ij}}}\,{\rm{(}}{{{\rm{p}}}_{\rm{i}}}{\rm{ - }}{{{\rm{p}}}_{\rm{j}}}{\rm{) \quad-\quad }}({{{\rm{\rkappa }}}_{\rm i}}{\rm{ - }}{{{\rm{p}}}_{\rm{i}}}^{2} {\rm{ - }}{{\rphi }_{\rm{i}}}{{{\rm{p}}}_{\rm{i}}})/{\mathop{\sum }\limits_{\rm {j\, \ne \,i}}} {\rm {g}_{ij}}{\rm{'}}{{{\rm{p}}}_{\rm{j}}}\end{}$$
Term 1 Term 2 Term 3
Term 1 represents payoffs from factors such as improved chances of re-election, with αi > 0. Term 2 represents payoffs from competition, which we treat as the numeraire relative to the first form of benefits and costs. For a given extent of competition between i and j, cij, i expects to attract mobile voters and capital if pi > pj and to lose them if pi < pj. Term 3 represents the costs of performance. We assume these are strictly concave in pi, with κi > 0, ϕi > 0 and κi sufficiently greater than ϕi to ensure that across the range of pi the expression in brackets is strictly increasing in pi. The squared term in part of the expression for costs placed in brackets represents the increasing marginal costs of performance in the current year. However, there is learning by doing as well as learning from others. The second term represents the information generated this year that can be used in future years, which we treat as reducing costs.Footnote 3 The term in brackets is divided by ∑ gij′pj, to reflect learning from others’ performance, which also reduces costs.Footnote 4
Best-reply Functions
We assume simultaneous play. Because Expression 1 is strictly concave in pi, assuming that i never plays the corner solution pi = 0, we can derive its best response from the first-order condition. Noting that gii = cii = 0 ∀ i,
 $${\rm{d}}{{{\rm{U}}}_{\rm{i}}}{\rm{/d}}{{{\rm{p}}}_{\rm{i}}}\,{\rm{ = }}\,{{{\rm{\ralpha }}}_{\rm{i}}}\,{\rm{ + }}\,{\mathop{\sum }\limits_{{\forall {\rm{j}}}}} {{{\rm{c}}}_{{\rm{ij}}}}{\rm{ - (2}}{{{\rm{\rkappa }}}_{\rm{i}}}\,{{{\rm{p}}}_{\rm{i}}}{\rm{ - }}{{\rphi }_{\rm{i}}}{\rm{)/}}{\mathop{\sum }\limits_{{\forall {\rm{j}}}}} {{{\rm{g}}}_{{\rm{ij}}}}{\rm{'}}{{{\rm{p}}}_{\rm{j}}}\, = \,0.$$
Thus i's best response pi(p−i) is given by:
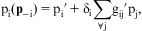 $${{{\rm{p}}}_{\rm{i}}}({\rm {\bf p}_{{\rm{ - }}i}})\,{\rm{ = }}\,{\rm {p}_i}'\, + \,{{{\rm{\rdelta }}}_{\rm{i}}}{\mathop{\sum }\limits_{{\forall {\rm{j}}}}} {{{\rm{g}}}_{{\rm{ij}}}}'{{{\rm{p}}}_{\rm{j}}},$$
where p−i is the vector of performance levels for other authorities; pi′ = ϕi /2κi is i's autonomous play performance level if there is no learning connectivity; and δi = (αi +∑ cij)/ 2κi is a payoff impact parameter for others’ performance on i's effort.
From Expression 2, i's best response is linearly increasing in the performance of j: the higher j's performance, the better i will want to perform. This relationship is conditioned by three factors. First, it is more pronounced, to the extent that i places more weight on benefits such as office holding, represented by αi. Secondly, i responds more to j to the extent to which it is likely that i pays attention to j's performance, represented by the term gij′. Thirdly, it is more pronounced the greater the overall extent of competition i faces, which is represented by the summation of terms cij. Conceiving terms cij as constituting the edges of a valued graph as above, this summation is i's degree centrality in the competition network (Freeman Reference Freeman1978/9). Without developing a formal model, it would not be obvious why centrality should be a key variable, or why i's response to j depends on i's position in the whole network of competition. In our model this arises from the fact that i is not just competing with j but with other authorities such as k, yet it has but one level of performance in relation to all competitors. So whether it will sacrifice other goals to respond to j depends on the extent of the competition it faces from all other authorities.
Existence of Equilibria
There is no guarantee in network games with concave payoff functions that equilibria exist, let alone that they will be stable. Our game is one of ‘strategic complements’ (Bramoullé, Kranton and D'Amours Reference Bramoullé, Kranton and D'Amours2010) in which i performs at a higher level to the extent that other authorities do so, because learning from others’ high performance reduces its costs. It is intuitive that if connectivity in the information transfer network is great enough relative to the cost of performance, there will be no equilibrium if performance levels are unbounded above: explosive positive feedback sets in with each increase in performance, triggering further increases among other authorities.Footnote 5
However we can state necessary conditions for the existence of equilibria. There are n equations like Equation 2, one for each local authority. There are n unknowns – the performance levels. The system of linear equations can be written in matrix form as:
 $${\rm{\bf Cp}}\,{\rm{ = }}\,\brvarphi $$
where C is an (n × n) matrix where Crr = −2κr and Crs = (αr + ∑ crs)grs′, r ≠ s; p is an (n × 1) column vector, j-th entry pj; and ϕ is an (n × 1) column vector j-th entry - ϕi.
Equilibrium performance levels are defined by:
 $${{\bf p}^ \ast } \,{\rm{ = }}\,{{\bf C}^{{\rm{ - 1}}}} \brvarphi $$
if the inverse of C exists and all if resultant entries in p* given by (4) are on the interval
[0, ∞).
Our empirical results are based on estimates of best reply functions, because we find little evidence that equilibria exist. Over the years for which we have data, the general upward trend in performance tends to indicate that equilibrium, if it exists, had not been reached. We can use empirical results to estimate Matrix C. We find that the resulting matrices are generally not invertible, which suggests that in the case at hand equilibria do not exist.
Testing for Competitive Learning versus Pure Learning
Re-arrange Expression 2 as follows:
 $$\matrix{ {{{\rm{p}}}_{\rm{i}}}({{\bf p}_{{\rm{ - }}\rm i}}{\rm{)}}\,{\rm{ = }}\,1/2{{{\rm{\rkappa }}}_{\rm{i}}}\,\left[ {{{{\rm{\ralpha }}}_{{\rm{i}}{\rm{.}}}}{\mathop{\sum }\limits_{{\forall {\rm{j}}}}} {{{\rm{g}}}_{{\rm{ij}}}}'{{{\rm{p}}}_{\rm{j}}}\, \quad\quad+ \,{\mathop{\sum }\limits_{{\forall {\rm{j}}}}} {{{\rm{c}}}_{{\rm{ij}}}}.\,{\mathop{\sum }\limits_{{\forall {\rm{j}}}}} {{{\rm{g}}}_{{\rm{ij}}}}'{{{\rm{p}}}_{\rm{j}}}\, \quad\quad+ \,{{\rphi }_{\rm{i}}}} \right] \cr\ \; \; \; \; \; \; \; \; \; \; \; \; \quad\quad\quad{\rm{Term}}\,{\rm{1}}\; \; \; \; \; \; \; \; \quad\quad\quad{\rm{Term}}\,{\rm{2}}\; \; \quad\quad{\rm{Term}}\,{\rm{3}} \\ \end{}$$
Term 1 represents pure learning by i from j, related to i getting internal rewards from performing better. Term 2 exhibits the interaction between yardstick competition and learning (competitive learning). Suppose that yardstick competition was irrelevant to authorities. Then competition parameters cij = 0, and Term 2 drops out of the model leaving a pure learning effect. We can estimate unknown parameters in Expression 3 using spatially weighted regression. Thus the principle advantage of our formal model is that it directly gives rise to an econometric approach to distinguishing competitive from pure learning. We go into more detail in the next section.
Estimation strategy
There are different types of spatial models, such as the spatial error model, the geographically weighted regression model and the spatial lag model (Anselin Reference Anselin1988; Fotheringham, Brunsdon and Charlton Reference Fotheringham, Brunsdon and Charlton2002). The spatial lag model (or spatial autoregressive modelFootnote 6) is often considered conceptually more appropriate for the study of policy diffusion, because the dependent variable for a unit is better conceptualized as being affected by the values of the dependent variable in nearby units rather than by unmeasured factors.Footnote 7 This approach explicitly models cross-sectional dependence of the data that would otherwise lead to biased estimates. Its use requires the consideration of some econometric and estimation issues, which we discuss in this section.
We use spatial lag models in which i's performance is influenced by j's, proportional to a weight specified in a weighting matrix. In relation to pure learning, entries in the weighting matrix just reflect informational ties between i and j. In relation to competitive learning, entries in the weighting matrix interact ties between i and j in the information network with i's competition centrality score, based on the results of the formal model. The test for competitive learning is whether the spatial lag coefficient on the second weighting matrix is significant, controlling for the first lag and other background factors. In formal terms we use a model with multiple spatial lags:
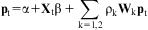 $${\rm {\bf p}_t}\: = \:{\rm{\ralpha }}\: + \:{\rm {\bf X}_t}{\rm{\rbeta }}\:\,+ \:\mathop{\sum}\limits_{{\rm{k}}\:{\rm{ = }}\:{\rm{1,2}}} {{{{\rm{\rrho }}}_{\rm{k}}}{{{\rm{\bf W}}}_{\rm{k}}}{{\bf p}_{\rm t}}} $$
where p is an NT × 1 vector of observations of performance, for N ≈ 148 English local authorities over T = 5 years,Footnote 8 and X is the battery of controls pertaining to processes within units. We include fixed effects in X to capture idiosyncratic unit factors that affect performance. The connectivity matrix, Wk, is an NT × NT block-diagonal matrix with T N × N sub-matrices along the leading diagonal, and typical element wijkFootnote 9 capturing relative connectivity or influence from unit j to i at time t for the k-th process. The estimate of ρ k is the spatial coefficient that captures the strength of policy interdependence for the k-th process, relative to the weighting matrix, Wk.
Because the dependent variable is on both sides of Equation 6, there is simultaneity bias if the model is estimated by ordinary least squares (OLS) (Anselin Reference Anselin1988; Beck, Gleditsch and Beardsley Reference Beck, Gleditsch and Beardsley2006; Franzese and Hays Reference Franzese and Hays2007b, Reference Franzese and Hays2008). One simple strategy to get around this is to time lag the spatial lag Wp by one year and then use OLS to estimate the model (Beck, Gleditsch and Beardsley Reference Beck, Gleditsch and Beardsley2006). Temporally lagging the spatial lags and estimating the spatial lag model using OLS is only a solution to simultaneity bias if the errors,  $$${{{\epsilon}}_{i,t}}$$$
, are serially independent (Franzese and Hays Reference Franzese and Hays2007a, Reference Franzese and Hays2008). Including a temporally lagged dependent variable often helps to eliminate serial correlation in the errors, but there is no guarantee.Footnote 10 More importantly, the assumption in this approach is that it takes a time lag to affect the policy outcome in another connected authority. With budgetary cycles coordinated across local authorities and performance reported at the end of the year, assuming that there can be no effect within the year concerned seems to us to be unjustified. In many contexts latecomers can only reap the advantage of learning from others after considerable time lags, but we expect authorities to be able to learn quickly, especially in relation to the methods of presenting policy that were important to getting high scores on the performance indicators we discuss.Footnote 11 Moreover, even in the best situation, in which learning takes place with a temporal lag, as Franzese and Hays (Reference Franzese and Hays2007b) have pointed out, the OLS model with time-lagged spatial lags only provides unbiased estimates if the first observations are non-stochastic—that is, if they are fixed across repeated samples. In our case, the spatial maximum likelihood approach is suggested, as it need not assume a temporally lagged spatial lag and addresses the simultaneity bias head on (Elhorst Reference Elhorst2001; Franzese and Hays Reference Franzese and Hays2008).Footnote 12
To test competitive learning against pure learning we need to estimate models with two spatial lags. W1 will generally reflect pure learning. The coefficient on this spatial lag, ρ1, can be seen from Expression 3 to be an estimate of α/2κ—the utility derived from a unit increase in greater performance due to an authority's internal political processes, such as improved electoral success, scaled in unit costs of additional performance. In the N × N sub-matrices along the leading diagonal wij1 = gij′, the normed measure of connectivity of information flow between i and j at time t. An issue in estimating spatial lag models is whether the spatial weighting matrices should be row standardized. Plümper and Neumayer (Reference Plümper and Neumayer2010) argue that this decision should be made on the basis of a theory about the underlying process. In effect, Matrix W1 is a row-standardized version of a matrix with typical term wij1 = gij. Row standardization arises from our assumption about the proportion of attention that is paid to another authority's performance; from the perspective of pure learning, i's performance is affected by the weighted average of the performance of other units. In formal terms row standardization involves dividing cell entries by the row total, which is precisely what we require, because gij′ = gij/∑ gik.
Matrix W2 reflects competitive learning. The coefficient on this spatial lag, ρ2, is an estimate of 1/2κ. Given that we treat payoffs from competition as a numeraire, this is the benefit from extra performance due to competition from mobile assets, scaled in terms of costs—see Expression 1. In the N × N sub-matrices along the leading diagonal, wij2 = gij′ ∑ cij; so in row i of such a sub-matrix each term is multiplied by the degree centrality of i in the competition network. Terms in such a row do not add to 1; that is, we do not row standardize W2. To see whether there is convincing evidence for competitive learning we simply need to see whether the spatial lag coefficient ρ2 for W2 is significant.Footnote 13
Measurement
We use data on a performance yardstick generated by the Audit Commission of England as part of its Comprehensive Performance Assessment (CPA) initiative. For 2002 to 2006, the Audit Commission used the same methodology to generate CPA scores for all upper-tier authorities in England (London Boroughs, Metropolitan Districts, county councils and unitary authorities).Footnote 14
Scores were based on assessments of service performance and ability to improve. Ability to improve was based on a self-assessment by authorities and external assessment. Because of the subjective component of measuring ‘ability to improve’, we focus on service performance scores, sp_per. They are based on weighting performance assessments typically carried out by the Audit Commission and other government agencies of six core services: education, social care for children, social care for adults, housing, environment, and library and leisure facilities. Greater weight was given to education and social services than to housing, and the lowest weight was given to environment and facilities. Service performance scores proved controversial, partly because the central government targeted funds to improve performance, though the amounts available were relatively low compared to other sources of central funding, which constitute some 75 per cent of local authority revenue. The performance measures were regarded as representing desired policy choices that are incentivized by central government (Audit Commission 2002).
This performance data gives us a valuable opportunity to assess the relative importance of pure learning and competitive learning. Despite the potential for authorities to receive better scores by improving the presentation (rather than the substance) of their policies, the measure was certainly taken seriously by local politicians and bureaucrats. They engaged in redesigning services and reorganizing the internal scope of the authorities (Boyne et al. Reference Boyne, James, John and Petrovsky2012). Overall the number of cases for which we have data is relatively high, around 148 authorities for five years.Footnote 15
By focusing on English local authorities, our research design controls for a number of factors: common aspects of center-local relations, common changes in central funding and policy initiatives, and common factors in the macro-economic cycle. This helps get around the common problem of heterogeneity in cross-country designs. As is typical in the empirical literature on diffusion, we assume unit homogeneity in the preferences of decision makers.
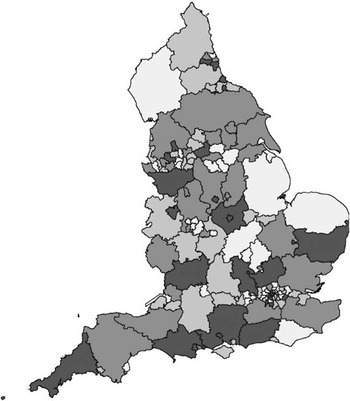
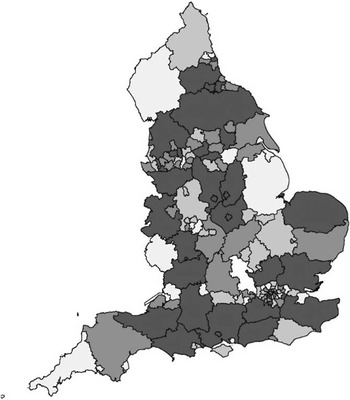
To give a visual impression of how performance changed, and of the way it geographically clusters, Figure 1 and Figure 2 show chloropleth maps of sp_per for performance in 2002 and 2006, respectively. Cases were split into five levels of performance, with darker shading indicating higher performance. Performance generally improved over time, although the scores for some authorities bounce around quite a lot in the intervening years, and not all authorities improved performance. Visual inspection tends to indicate geographical clusters of adjacent authorities with similar levels of performance—for example, the group of relatively high-performing authorities near the south coast in 2006. Over the five years for which we have observations, clustering by adjacency is confirmed by a significant value of Moran's I (0.149, z = 5.473, p < 0.000).
Spatial clustering of performance levels in 2002

Spatial clustering of performance levels in 2006

It is impossible to tell from such clustering what causal mechanism or mechanisms are at work, because all the mechanisms that are commonly proposed in the literature plausibly feature geography as a factor (Graham, Volden and Shipan Reference Graham, Volden and Shipan2013). Specifically it is likely that units i and j compete if they are close to one another, because this will reduce the costs of relocation for mobile taxpayers and businesses. However, it is also plausible that i and j will learn more from each other if they are close because this will reduce the transaction costs of finding out what the other is doing. The literature indicates that learning may also be related to non-geographic factors, such as similarity of political control between i and j, which can also be represented using spatial lags (Beck, Gleditsch and Beardsley Reference Beck, Gleditsch and Beardsley2006). This helps to some extent, because it is not especially plausible that people or firms will find it less costly to move because of this. However, better theory is ultimately needed to help disentangle why geography and other factors that can be represented by networks and spatial weights, such as similarity of control, matter. To give the greatest chance of capturing underlying processes, we operationalize W1 and W2 in a number of different ways.
Spatial Weighting Matrix W1
The conventional starting point for spatial analysis of diffusion is the idea that units that are close to each other geographically influence each other. To allow for this, we started by defining weighting matrices such that:
In any N × N sub-matrix, for i ≠ j, entry wij = 1 if i and j share a common border and 0 otherwise (that is, based on adjacency); and
In any N × N sub-matrix, for i ≠ j, entry wij = 1/(1 + p_dist ij), where p_dist ij is the (Euclidean) distance between the centroids of the two authorities’ areas (that is, it is based on the reciprocal of distance).Footnote 16
Versions of W1, respectively adjacency and rec_p_dist, were then derived using row standardization.
A common idea in the literature is that there will be regional effects. In our empirical context it is particularly likely that authorities in the same metropolis will influence each other. London boroughs and metropolitan districts in areas like Greater Manchester belong to forums where they meet regularly with others from their city and exchange information. Based on the major metropolitan areas,Footnote 17 we define a matrix such that in any N × N sub-matrix, for i ≠ j, entry wij = 1 if i and j belong to the same metropolis and 0 otherwise (that is, based on belonging to the same metropolis). A version of W1, samemet, was then derived using row standardization.
In the period for which we have data, England was also split into 10 regions for the purposes of implementing government policy, economic planning and development. Again, local authority representatives regularly met with others from their region, in some cases through regional assemblies. Based on these regions we define a weighting matrix such that: in any N × N sub-matrix, for i ≠ j, entry wij = 1 if i and j belong to the same region and 0 otherwise (that is, based on belonging to the same region). A version of W1, sameregion, was then derived using row standardization.
An authority is more likely to pay attention to the performance of another authority the bigger that authority is: bigger authorities generate more coverage of their activities, communicate more information about themselves (because they have better-developed specialist public relations departments), are more prominent in representative bodies of local authorities and are more likely to be the source of key individuals who transfer practices by moving jobs. Another common idea is that units controlled by the same political party influence each other. A possible basis for this is that relevant decision makers caucus together at national or regional party events, forming affiliation networks. Also in the most informative equilibria in games of information transfer, the credible transmission of information depends on how close j and i's preferences are (Austen-Smith Reference Austen-Smith1997). On this basis, whether i expects to get reliable information about how to perform well from j would depend on them having similar preferences, which is more likely if the pattern of political control is the same. To allow for these possibilities, we defined weighting matrices such that: (1) in any N × N sub-matrix, for i ≠ j, entry wij = (populationj – populationi1) if populationj > populationi and 0 otherwise; (2) in any N × N sub-matrix, for i ≠ j, entry wij = 1 if the same political party controlled authorities i and j and 0 otherwise.Footnote 18 Versions of W1, respectively popgreat and simcontrol, were then derived using row standardization.
Centrality in the Competition Network
To define the weighting matrix relevant to competitive learning, W2, we first have to operationalize competitive pressures on each unit, which we take as its centrality in the competition network, ∑cij. Firms are unlikely to move from a local economy that is based on high value-added production utilizing a skilled workforce to a local economy based on standard products produced with low-cost labor: firms cluster because of network externalities and specialized local labor markets. Other things equal, a firm is less likely to move the further away the alternative. So our prediction is that yardstick performance competition will be strong between local authorities that are geographically close to one another and are similar in their industrial structure.
To operationalize similarity of economic structure we used Huggins’ index scores (Reference Huggins2003). These are based on a combination of official data about input factors (economic start-up rates, number of businesses per 1,000 inhabitants, educational attainment of workforce, proportion of knowledge-based industries), output factors (gross value added per head, labor productivity, employment rates) and outcomes (gross weekly pay and unemployment levels). We generated scores for shire counties by taking the average of their constituent authorities weighted by population. We used the data for 1997, comp i.Footnote 19 We then defined a centrality score for each unit as follows:Footnote 20
 $$cent\_com{{p}_{\rm{i}}}\,{\rm{ = }}\,{\mathop{\sum }\limits_{\rm {j\, \ne \,i}}} \,{\rm{(1/(1}}\,{\rm{ + }}\,{\rm{|}}\,com{{p}_{\rm i}}{\rm{ - }}com{{p}_{\rm j}}\,{\rm{|)}}{{\,}^{\rm{\ast}}} \,{\rm{1/(1}}\,{\rm{ + }}\,p\_dis{{t}_{\rm ij}}{\rm{))}}$$
Thus for each unit j, i's centrality increases as unit j is more similar in its economic structure to i and is closer to i geographically.
While English taxpayers may share similar concerns to firms, in the period under consideration they were also likely to be particularly concerned with relative levels of social deprivation in jurisdictions they were comparing, because this influenced capital appreciation on property. Based on the idea that two authorities would be in closer competition if they were near each other and had similar levels of social deprivation, we defined an alternative centrality score. This score correlated quite highly with the main one we employ (0.61, n = 148), which helps give confidence and allows robustness checks.Footnote 21
Spatial Weighting Matrix W2
The general form of W2 is that cells in a given row of W1 are each multiplied by the centrality score for the corresponding unit, so a typical term is gij′ ∑ cij. Spatial weighting matrix cent_compXadjacency was defined in this way by multiplying cells in rows corresponding to unit i of adjacency by cent_comp i. In the same way we defined other versions of W2: corresponding to cent_comp: cent_compXsamemet, cent_compXsameregion, cent_compXrec_p_distance, cent_compXpopgreat and cent_compXsimcontrol.
Control Variables
While the Audit Commission initially denied that deprivation correlated with performance, some local politicians pointed out that it was hard to perform well in a deprived area. Later research tended to indicate that there was indeed some correlation, though relatively little of the variance in service performance could be explained in this way (Andrews et al. Reference Andrews, Boyne, Law and Walker2005; Haubrich and McLean Reference Haubrich and McLean2006). Although we have two observations on social deprivation during the period of our study, they are highly correlated because deprivation is slow moving (bivariate correlation 0.96, n = 1,184). Models with fixed effects estimate the effects of variables with little within variation very inefficiently. If we consider the amount of missing data on the social deprivation index, it was better to use a control that had more within variation and less missing data. The q1claimrate, which is the numbers seeking work and in receipt of state benefit, is suitable in this regard (bivariate correlation ≈ 0.82, n = 1,184). As a further check we include a measure of average house prices, all_ghp, which should correlate with deprivation.
Earlier work on performance using the same data we employ reports that political control was an influence (Boyne et al. Reference Boyne, James, John and Petrovsky2012). We define dummy variables for control by the Conservative, Labour and Liberal Democrat (Lib-Dem) parties (the excluded category was no overall control).
Yardstick competition involves people or businesses moving to get a better overall deal, taking both performance and taxation levels into account. Higher levels of local taxation might also give authorities greater scope to perform well. We control for the level of local taxation by taking the average level of council tax per annum, paid per household, counciltax.Footnote 22 Rates of local business taxation were uniform across units in the study period. English local authorities received the majority of their revenue from the central government under formula-driven funding mechanisms during this period. It is possible that greater central flows allow lower local taxation or greater possibilities for good performance. Hence we control for the level of revenue support grant per capita, rsgpercap.
Estimated models
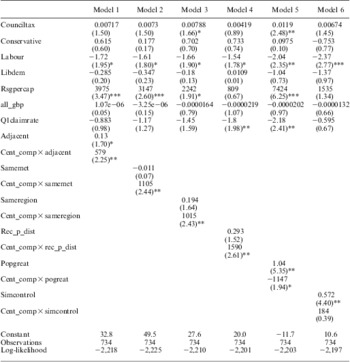
Table 1 reports estimates for statistical models using matrices W2 based on our centrality measure, which is derived from similarity of economic structure. Therefore, to avoid very large tables we do not report fixed effects. Following from our theoretical focus on best-reply functions, our interest here is in instantaneous effects rather than long-run equilibrium effects; so we directly consider coefficients and their significance. In each model, results on control variables (tax level, political control, central transfers, house prices and claimant rate) are reported first. Coefficients generally have the anticipated signs, though significance levels vary across the table, and some controls that might be expected to feature fail to be significant at conventional levels. Results on the Labour dummy largely reflect prior research: Labour-controlled authorities performed worse (Boyne et al. Reference Boyne, James, John and Petrovsky2012). The results for counciltax and rsgpercap show that authorities that access more resources increase their performance.
Models for sp_per with Centrality Scores Relating to Similarity of Economic Structure

Note: fixed effects omitted; absolute z-values in brackets.
*significant at 90 per cent level; **significant at 95 per cent level; ***significant at 99 per cent level.
In Table 1, with the exception of Model 2, the spatial lag coefficient, ρ1 on W1 (reflecting pure learning and internal political rewards) is positive, as we expected on theoretical grounds. However coefficients only achieve significance at conventional levels in Models 5 and 6, in which pure learning is likely to be based on the relative size of authorities and similarity of political control rather than geographical nearness or region (Models 1 to 4). This suggests that pure learning did not necessarily take place between authorities that are close to each other. With the exception of Regression 5, the spatial lag coefficients on W2, ρ2 (reflecting competitive learning and payoffs due to success in external competition) are positive. They are also significant at conventional levels in Models 1 to 4, whereas they are not significant in Models 5 and 6. Where a model captures competitive learning based on geographical factors (Models 1 to 4), there is significant evidence for competition. This is in line with the view that authorities were concerned about performing well in order to prevent businesses moving to nearby authorities with similar economic structures, or to attract business under the same conditions. As pointed out above, ρ1 estimates α/2κ and ρ2 estimates 1/2κ, so we can solve for estimates of α and κ. Using data from the matrices W1 and W2, we can then construct an estimate of Matrix C for each model in Table 1. In each case we found that the estimated Matrix C was not invertible, suggesting that with the data we employ, a necessary condition for an equilibrium of the game to exist is not satisfied.
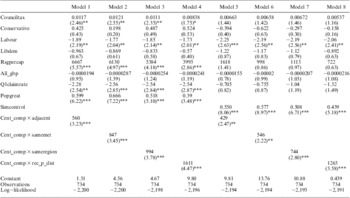
In Table 1 we find a pattern in which evidence for pure learning is stronger where the non-transfer of information relates to non-geographic factors, whereas evidence for competitive learning is stronger where geographical factors are at play.Footnote 23 Where competition is a feature in our models, the evidence suggests that it is probably over the location of potentially mobile businesses, because similarity of economic structure seems to be what matters.Footnote 24 Authorities have specialist departments and bureaucrats that are concerned precisely with attracting and retaining business—‘economic development’ as it is generally termed in the UK. Those concerned with economic development are quite likely to look towards authorities that are geographically close to them for examples of good practice influencing performance scores, because this is where they see significant competition. They would seek to influence the components of overall performance scores that are most important to business: education (because of its influence on the supply of skilled labor), service provision and the environment. The other main components of the performance scores we use relate to welfare provision, which has its own specialists and departments within authorities. While it is highly plausible that their leaders will desire to perform well because of factors like performance-related career rewards, economic development is probably less salient to them. It is quite likely that the places they look to for examples of good practice would be different from those analyzed by local politicians and bureaucrats concerned with economic development. These could plausibly include bigger authorities (visibility) and those with similar party control (trust). If this argument is correct, there should be evidence of both pure learning and competitive learning if we specify the model in such a way that W1 (the spatial weight matrix capturing pure learning) relates to non-geographical factors and W2 (the spatial weight matrix relating to competitive learning) is specified in terms of geographical factors together with our measure of competitive pressure based on similarity of economic structure. In Table 2 we report models of this sort. In Models 1–4 W1 is popgreat and in Regressions 5–8 it is simcontrol. There are four specifications of W2 based respectively on adjacency (Models 1 and 5), samemet (Models 2 and 6), sameregion (Models 3 and 7) and r_p_distance (Models 4 and 8). In line with the idea that different agencies focus on different sources of information, the coefficients on all spatial lags are positive and significant in these models. Coefficients on controls are quite stable across models and are similar to those reported in Table 1. As degrees of freedom are the same across models in Tables 1 and 2, some idea of which models have the best fit can be gained through a comparison of log-likelihoods, which suggest that Model 6 is the best fitting in Table 1 and Model 8 in Table 2. Based on Clarke's non-parametric test for non-nested models (Reference Clarke2007), Model 8 in Table 2 fits significantly better than Model 6 in Table 1, supporting the view that different links are important to pure learning and competitive learning.Footnote 25 We conclude that our data suggest that it may be fruitful to look inside the units of analysis and to ask whether distinct links and mechanisms connect different agencies. While the significance of W2 in Table 2 suggests the importance of learning from geographically proximate authorities in order to compete better, more fine-grained data and qualitative evidence would be needed to show through what channels information flows from neighbors.
Models for sp_per with Non-geographical Model of Pure Learning, a Geographical Model of Competitive Learning and Centrality Scores Relating to Similarity of Economic Structure
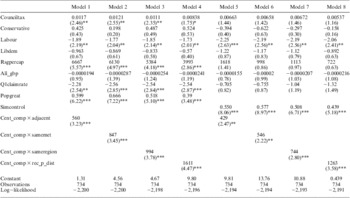
Note: fixed effects omitted; absolute z-values in brackets.
**significant at 95 per cent level; ***significant at 99 per cent level.
Conclusion
In this article, we have advanced theoretical work on diffusion by setting out the incentives to learn more clearly. We have made a conceptual advance by distinguishing competitive learning from pure learning, which brings together mechanisms that are usually treated as distinct and dealt with in separate literatures. We set out a formal model that sharply delineates these distinctions and permits an effective test using spatial lags to model mechanisms, based on a clearly stated set of assumptions about the utilities of decision makers. English local government is a useful context for applying the test because there is good data on performance and factors that affect competition between units. Our results show evidence of both pure learning and competitive learning. They also suggest that different mechanisms are at play across parts of local government organizations, and that the diffusion process is contingent upon the particular element of the bureaucracy at work. Further research should continue to lift the lid on diffusion by exploring internal processes—for example, by modeling payoffs to different sub-bureaucracies. While local politicians and bureaucrats in the UK seem to believe they can attract mobile investors and tax payers with higher performance (Boyne et al. Reference Boyne, James, John and Petrovsky2012), it remains to be seen whether the performance scores we focus on mattered in this way. Some headway might be possible on population movement using census data, but it is hard to capture investment flows across units in England. It will also be important to look at specific policies and to allow for slippage between policy outputs and economic and social outcomes that can be presumed to matter to voters and businesses.
It should be fruitful to consider whether competitive learning exists in other jurisdictions and policy contexts, such as in state and city politics in the United States, or from international competition between states over taxation, environmental regulation and neo-liberal policy reforms. Like us, researchers may be able to use spatial lags to adjudicate the causal process at work, but it is also important to consider other methods of modeling spatial dependence, such as latent space analysis (Ward, Siverson and Cao Reference Ward, Siverson and Cao2007). Here we assumed that all units had the same motives. It may be possible to derive hypotheses from political economy and comparative politics to predict the balance between competitive learning and pure learning. For instance, institutional theory might suggest that when macro-institutions determine the rules of the game within which diffusion and learning take place across sub-governments within states, competitive learning may be more prevalent in Anglo-American democracies while pure learning may be more prevalent in European welfare state models.
While we have helped clarify the relationship between competition and learning, there is still considerable work to be done. Emulation can be thought of as involving authorities that copy others’ policies without rationally assessing information. If emulation of large or ideologically similar authorities is at work rather than learning, the way policies relate to a performance yardstick should not matter. If there is data on specific policies as well as the performance yardstick, spatial lags on specific policy adoption should be significant even for those that have a significant negative correlation with the performance yardstick. Creative modeling and use of data might help disentangle both the rational aspects of diffusion and those that do not relate to the rational use of information.