Illness of unweaned calves has a huge impact on the dairy and beef industry worldwide (Svensson & Jensen, Reference Svensson and Jensen2007; Gulliksen et al. Reference Gulliksen, Jor, Lie, Løken, Åkerstedt and Østerås2009). The importance of this to animal welfare and economics is evident from the high mortality rates (7·8%) in unweaned heifers (USDA, 2010). Morbidity of calves during the first 6 to 8 wk is even higher (Godden et al. Reference Godden, Fetrow, Feirtag, Green and Wells2005; Svensson & Liberg, Reference Svensson and Liberg2006). In a German study (Trilk, Reference Trilk2008) evaluating 270 heifers, only 27% of the calves were not affected by any disease during the rearing period.
Immunity of the young calf mediated by successful transfer of immunoglobulins (Ig) directly after birth plays a predominant role in the aetiology of diseases. Several factors, including timing of colostrum ingestion, the Ig concentration of the colostrum ingested, and the volume and method of colostrum administration have been demonstrated to affect the rates of Ig absorption (Weaver et al. Reference Weaver, Tyler, VanMetre, Hostetler and Barrington2000). Furthermore, the absorptive capacity of the gut decreases rapidly after 12 h (Stott et al. Reference Stott, Marx, Menefee and Nightengale1979). To ensure adequate transfer of immunity a minimum amount of 150 to 200 g Ig in the first 12 h is recommended (Kruse, Reference Kruse1970; Hopkins & Quigley, Reference Hopkins and Quigley1997; Godden et al. Reference Godden, Haines and Hagman2009a).
The most important and abundant Ig in calves is IgG (Larson et al. Reference Larson, Heary and Devery1980). If the serum concentration of IgG is below 10 mg/ml 24 to 48 h after birth the calf is considered to have a failure of passive transfer (FPT) and to be at risk of ill-health (Besser et al. Reference Besser, Gay and Pritchett1991).
Several studies have shown that 4 L of colostrum is needed at the first feeding to reach the recommended serum concentration of 10 mg/ml IgG (Besser et al. Reference Besser, Gay and Pritchett1991; Hopkins & Quigley, Reference Hopkins and Quigley1997; Kaske et al. Reference Kaske, Werner, Schuberth, Rehage and Kehler2005). The median voluntary intake of colostrum of Holstein heifer calves within 6 h after birth, however, varied between 2·2 l and 3·3 ± 1·3 l (Urday et al. Reference Urday, Munashe and Tyler2008; Vasseur et al. Reference Vasseur, Rushen and de Passillé2009; Chigerwe et al. Reference Chigerwe, Coons and Hagey2012). To ensure that all calves reach an adequate concentration of antibodies within 24 h after birth oesophageal tube feeding has been recommended (Besser et al. Reference Besser, Gay and Pritchett1991; Kaske et al. Reference Kaske, Werner, Schuberth, Rehage and Kehler2005; Chigerwe et al. Reference Chigerwe, Tyler, Middleton, Spain, Dill and Steevens2008). The question, however, of whether tube-fed calves have higher absorption rates of antibodies compared to bottle-fed calves is controversial (Adams et al. Reference Adams, Bush, Horner and Staley1985; Godden et al. Reference Godden, Haines, Konkol and Peterson2009b; Chigerwe et al. Reference Chigerwe, Coons and Hagey2012). In the United States feeding colostrum by oesophageal feeder is used as a routine measure in about 14% of dairy heifer calves (USDA, 2010). In Europe the discussion on routine force-feeding colostrum is somewhat controversial because “no animal shall be provided with food or liquid in a manner which may cause unnecessary suffering or injury” (Council of the European Union, 1998). In some European countries animal welfare legislation prohibits force feeding of animals except for medical reasons (Lorenz et al. Reference Lorenz, Mee, Early and More2011). Additionally, there is a risk for aspiration pneumonia or regurgitation and inhalation of force-fed colostrum (Bradley & Niilo, Reference Bradley and Niilo1985). Overall, there is a dearth of information on the impact of oesophageal tube feeding on behaviour of dairy calves. Therefore the objective of this study was to compare lying behaviour and IgG-levels of newborn dairy calves fed via oesophageal tube or bottle at their first feeding. Specifically, we set out to test the following hypotheses: (1) lying behaviour of tube fed calves will differ from that of bottle fed calves, and (2) serum IgG concentration between tube- and bottle-fed calves will not differ after 24 h.
Materials and methods
This study was conducted at the University of British Columbia's Dairy Education and Research Centre (Agassiz, British Columbia, Canada). Calves were managed according to the guidelines set by the Canadian Council on Animal Care (2009).
Animals and housing
Thirty-seven bull calves born at the UBC Dairy Education and Research Centre were used. The calves were enrolled directly after birth. Calves were randomly assigned to 1 of the 12 replicates, balancing for birth weight. Within replicates the calves were randomly assigned to 1 of the 3 treatment groups (bottle, placebo tubing, tubing). To ensure identical colostrum quality among treatments the same colostrum batch was used for the 3 calves of a replicate. Each of the 12 replicates consisted of 1 calf per treatment within a weight range of 5 kg at birth. One replicate involved a fourth calf because the calf of the bottle group had to be replaced due to no voluntary colostrum intake.
Each calf had a complete birth record including time of calving, birth weight, parity of the dam and any noticeable newborn calf abnormalities. Each calving was assessed and categorised utilising a 4-point calving ease score (1 = unassisted; 2 = light pull; 3 = hard pull; 4 = veterinarian assisted delivery) as described previously (Leister, Reference Leister2010). Calves met the inclusion criteria when not showing any newborn calf abnormalities, drinking sufficient colostrum spontaneously to attain 180 g IgG within 4 h after birth and surviving for 4 d. All health events and treatments were recorded. Diseases of interest included diarrhoea, pneumonia and navel infections.
Within 30 min after birth, the calves were removed from their dams and put in 1 of 6 individual pens of identical size (1·16 × 2·0 m) bedded with wood shavings where they stayed for 4 d. These 6 pens were located side by side and the calves had visual contact.
Procedures and observations
In the single pen, the navel was cleaned and disinfected with iodine solution and calves were fitted with a HOBO® data logger (HOBO Pendant G Data Logger, Onset, Pocasset, MA, US) on the right hind leg to measure lying behaviour for 3 d following birth with a 60 s measuring interval (Bonk et al. Reference Bonk, Burfeind, Suthar and Heuwieser2013).
Vitality parameters (i.e. rectal temperature, respiration rate, heart rate) and reflexes (i.e. menace reflex, pulling back the tongue, reaction to a sensory stimulus of the nasal mucosa) were recorded directly after birth and 2 h after birth, right before colostrum feeding. A modified APGAR-score (Apgar et al. Reference Apgar, Holaday, James, Weisbrot and Berrien1958) was used to classify respiration rate, hearth rate, muscle tonus and reflexes each on a scale from 0 to 2 and calves classified as vital (7–8 points), in peril (4–6 points) or non vital (1–3). Body Temperature, auscultation and faecal score (i.e., normal, pasty, slurry, watery, bloody) were recorded daily. On day 4, all calves were weighed again.
Colostrum management and feeding
First milking colostrum with an IgG concentration >60 mg/ml was collected from 2 to 3 cows or heifers and pooled to form a batch of 16 l colostrum and stored in 2 l plastic bottles at −20 °C. A colostrodoser (Ethicom Inc., Kemptville, ON, Canada) was used to estimate quality. Two aliquots (3 ± 1 ml) of each batch were taken and stored at −20 °C until determination of IgG concentration with radial immunodiffusion assay. Each batch was enough to feed 3 calves, with an additional volume for a fourth calf in case one of the three calves did not meet the inclusion criteria.
When a calf was born, 4 l of colostrum was thawed in a 20 l water bath at 40 °C.
Within 2·0 ± 0·25 h after birth 3·5 l colostrum (38 °C) were offered (bottle and placebo tubing group) or administered (tubing group).
The bottle group calves were fed with two 2-l nipple bottles. Calves of the placebo tubing group were tubed for 4 min but colostrum was not fed. After removing the tube (external diameter of the hard tube: 0·96 cm; external diameter of ball: 2·2 cm; length of the hard tube: 34·9 cm; length of the soft tube: 50·0 cm) the calves were fed with the same 2 nipple bottles as in bottle group. Calves of the tubing group received 3·5 l colostrum via the oesophageal tube. If calves of the bottle or placebo tubing group did not drink 3·5 l at the initial feeding the remaining colostrum was offered at a second session 4 h after birth.
All calves were fed according to a standard operating procedure as previously described (Vasseur et al. Reference Vasseur, Rushen and de Passillé2009). If the calves were able to stand they were put into the left back corner of the individual pens. The posterior of the calves were against the back and the calves left flank was against the left wall of the pen. The investigators left leg kept the flank of the calves against the wall of the pen. The experimenter kept the calves’ head up by placing his left arm around the neck of the calves and placing the left hand under the jaw of the calves. This position enabled the experimenter to support the calves to stand. If the calves were unable or not willing to stand they were put in the same position but fed in a lying position.
Calves of the bottle and placebo tubing group were fed colostrum with 2-l nipple bottles. The nipple was put into the calf's mouth. If the calf did not start suckling within 10 s, stopped suckling or swallowing for 10 s or when the calf removed the nipple from its mouth, the experimenter stopped restraining the calf and waited 2 min before re-introducing the nipple. When the first 2-l bottle was finished a second 2-l bottle filled with the remaining 1·5 l of colostrum was offered. After 2 re-introductions the meal was considered to be finished. The 4-h colostrum feeding for calves of the bottle or placebo tubing group followed the same procedure. Two persons tubed the calves of the tubing group. One investigator restrained the calves as described above while the second investigator introduced the tube and fixed it with his fingers on top of the tongue to prevent dislocation by tongue movement. The duration of the whole feeding period referred to as feeding bout duration (i.e. time in the pen), time needed to tube the colostrum (i.e. introducing until removing the tube) and drinking time (i.e. introducing until removing the nipple) were recorded, respectively.
The volume of colostrum consumed by calves of the bottle and placebo tubing group was recorded. Based on consumed quantity and the preliminary determined IgG content of the batch, the consumed amount of IgG was calculated for calves of the bottle and placebo tubing group. Calves that did not drink sufficient colostrum spontaneously to attain 180 g IgG within 4 h after birth were tube-fed to ensure adequate IgG consumption and subsequently excluded from the study. After the colostrum feeding, all calves received 4 l of pasteurised waste milk twice a day. First and second milk feedings 12 and 24 h after birth followed the feeding procedure of the bottle group. After the first 2 milk meals all calves were fed in the morning and evening (i.e. 0900 and 1600 h).
Blood samples were obtained by jugular venipuncture at 24 h postpartum using a vacuum tube system (BD Vacutainer Venous Blood Collection, BD, Franklin Lakes, NJ, US) and 0·9 × 25 mm needles (BD Vacutainer PrecisionGlide, BD, Franklin Lakes, NJ, US). Samples were allowed to clot for 45 ± 5 min at room temperature and centrifuged (10 min, 1000 × g ). Serum was separated and analysed for total protein content (TSPC) with a temperature compensated hand-held refractometer (Rhino VET360 Veterinary Clinical Refractometer, Reichert Technologies, Depew, NY, US). The remaining serum was stored at −20 °C in 2 ml cryo vials (Cryo.S 2 ml, Greiner Bio-One GmbH, Sohlingen, Germany) until analysis for IgG concentration using radial immunodiffusion determination techniques (RID).
Radial immunodiffusion determination of serum IgG was carried out according to Chelack et al. (Reference Chelack, Morley and Haines1993). In brief plates were prepared by dissolving 1% agarose in phosphate buffered saline (Dulbecco DPBS 17-512-Q) containing 0·1% sodium azide. Rabbit anti-bovine-IgG was added to the agarose solution, and 24·4 ± 0·1 ml of the final solution was added to immunodiffusion plates (Thermo Microtitre lids #5500, Thermo, Milford, MA, USA). After the agarose had solidified, 42 2-mm-diameter wells were cut in the agar. Colostrum samples were diluted 1:15 with phosphate buffered saline, and 4 µl of each sample was pipetted, in triplicate into the wells. The diameter of the zone of precipitation was recorded after 16 ± 0·5 h of incubation at 23 °C. Sample IgG concentrations were determined by comparing diameters of zones of precipitation with a standard curve generated with serial dilutions of a bovine IgG standard (i.e. 1:4; 1:8; 1:16; 1:32; Bovine IgG Standard #4005, Midland Bioproducts Corp., Boone, Iowa, USA). Colostrum powder for an internal reference was provided by the Saskatoon Colostrum Company (Saskatoon, SK, Canada), while a secondary reference bovine IgG standard (Midland Bioproducts #4010) was used for the serum analyses.
Statistical analysis
Data were entered into Excel spreadsheets (version 2010; Microsoft Corp., Redmond, WA) and statistical analyses were performed with IBM SPSS Statistics for Windows software (version 20·0; IBM Deutschland GmbH, Ehningen, Germany). Homogeneity of the proportion of the following factors: birth weight, dam parity, calving score, APGAR-score and faecal score within treatment group (i.e., bottle, placebo tubing, tubing) was evaluated with a χ2 test. Data was checked for normality with Kolmogorov-Smirnov-Test. Descriptive statistics included mean ± sd and median, where appropriate. Association between the parameters was tested with Pearson's correlation (i.e. continuous parameter) and Spearman rank correlation (i.e. ordinal parameter).
Further analyses were carried out applying a linear mixed-model ANOVA. All mixed-model ANOVA were built according to the model-building strategies described previously (Dohoo et al. Reference Dohoo, Martin and Stryhn2009). In brief, in a first step, each parameter considered for the mixed model was separately analysed in a univariate model, including the parameter as a fixed factor (i.e., ordinal parameter) or covariate (i.e., continuous parameter). Only parameters resulting in univariate models with P ≤ 0·2 were included in the final mixed model. Furthermore, all independent parameters were tested with Spearman's correlation (i.e., ordinal parameter) or Pearson's correlation (i.e., continuous parameter) for collinearity. If 2 parameters showed a high, significant correlation (r > 0·60), only the one resulting in the univariate model with the smaller P-value was used in the final mixed model. This final model was built in a manual backward stepwise manner by removing parameters resulting in P > 0·05 until all remaining parameters showed a significant effect. The covariance structure was chosen based on the model with lowest Akaike information criterion value. Post hoc comparison was carried out applying the least significant difference test. The significance level was set at P ≤ 0·05.
The effect of method of colostrum feeding on total daily lying time, daily lying bout frequency and average lying bout duration per day was evaluated in a linear mixed-model ANOVA, including day as the repeated measure. The random effect of calf within treatment group was included in this model. The scaled identity covariance structure was used. The model was rerun to assess the within days between groups effect.
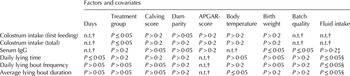
The effect of method of colostrum feeding on serum IgG content at 24 h after birth, lying time and lying bout frequency within 1·3 and 6 h after first colostrum feeding and first and total colostrum intake was evaluated in a linear mixed-model ANOVA. The random effect of calf within treatment group was included in this model. Table 1 shows the parameters for each model that were tested as factors (i.e., ordinal data) and covariates (i.e., continuous data. Data are presented as mean ± sd.
Factors and covariates for each linear mixed-model ANOVA

P > 0·2 excluded from the final model; P > 0·05 no effect; P ≤ 0·05 effect.
† not tested.
‡ colostrum total (2 + 4 h colostrum feeding).
§ daily fluid (colostrum and/or milk) intake.
A post hoc power analysis was performed using the G*Power program (version 3.1·3; University of Dusseldorf, Dusseldorf, Germany) to verify the level of the effect of treatment group on the total amount of colostrum consumed. A post hoc repeated-measures ANOVA between factor analyses model was applied to calculate the power of analysis (1-β) and the effect size (f), accepting a null hypothesis error of 0·05.
Results and discussion
This is the first controlled trial to examine the effect of the feeding method (tube vs. bottle) on lying behaviour of new born calves and on passive transfer of IgG when bottle-fed calves were only fed via nipple bottle. In previous studies bottle-fed calves that had not consumed the planned volume of colostrum received the remaining colostrum via tube feeding (Kaske et al. Reference Kaske, Werner, Schuberth, Rehage and Kehler2005; Godden et al. Reference Godden, Haines, Konkol and Peterson2009b). We hypothesised that oesophageal tubing can affect behaviour by an irritation of the oesophagus and by the administration of 3·5 l. To control for the potential irritation we integrated a group of calves which received a placebo treatment (i.e. placebo tubing). Furthermore, we hypothesised that method of colostrum administration will not affect serum IgG concentration 24 h after birth.
One calf of the bottle group did not suck and consequently refused to drink colostrum and was excluded from the study. It had to be tubed for 3 d before it started drinking on its own.
Median dam parity (bottle: 3, placebo tubing: 1, tubing: 2·5), median calving score (bottle: 1, placebo tubing: 1, tubing: 1), median faecal score (bottle: 1, placebo tubing: 1, tubing: 1), median APGAR-score 15 min and 2 h after birth (bottle: 7, placebo tubing: 7, tubing: 7) and mean body temperature (bottle: 38·9 ± 0·5, placebo tubing: 39·0 ± 0·3, tubing: 38·8 ± 0·5) did not differ among groups (P > 0·05). There were 20 events when body temperature was >39·5. Eleven of these events were directly after birth and the 9 remaining events occurred scattered and isolated from days with faecal score >2. Furthermore, none of the calves were coughing or showed signs of pneumonia.
An overall effect of time of treatment group (P = 0·009) on amount of colostrum consumed on the first day could be evaluated in the linear mixed-model ANOVA. At the 2-h feeding, placebo tubing calves consumed 0·68 ± 0·13 l and 0·82 ± 0·13 l less than bottle (P < 0·001) and tubing calves (P < 0·001). Considering both the 2- and 4-h colostrum feedings, mean voluntary colostrum intake was 3·3 ± 0·3 l (bottle: 3·44 ± 0·14 l, placebo tubing: 3·20 ± 0·38 l; P = 0·018) which is consistent with the findings of Vasseur et al. (Reference Vasseur, Rushen and de Passillé2009) but higher than the median colostrum intake of 2·2 l reported by Chigerwe et al. (Reference Chigerwe, Coons and Hagey2012). Vasseur et al. (Reference Vasseur, Rushen and de Passillé2009) and Franklin et al. (Reference Franklin, Amaral-Phillips, Jackson and Campbell2003) reported that 22% (8 of 36) and 20% (3 of 15) of calves consumed less than 2 l and 2·6 l of colostrum, respectively. In the current study, however, minimum colostrum intake was 2·32 l and only 1 calf (4%) drank less than 2·6 l. Furthermore, 87·5% (21 of 24) of our calves consumed ≥3 l of colostrum within 4 h after birth which is higher than findings of recent studies in which only 44 to 62·5% of the calves drank at least 3 l of colostrum (Urday et al. Reference Urday, Munashe and Tyler2008; Godden et al. Reference Godden, Haines, Konkol and Peterson2009b).
Mean colostrum intake between bottle and placebo tubing calves differed by 0·7 l at the 2-h colostrum feeding. Whether this difference was caused by a possible irritation of the oesophagus and pharynx or due to exhaustion caused by the placebo tubing procedure right before feeding cannot be determined from this experiment. Consequently, 3 bottle calves and 11 placebo tubing calves had to receive a second colostrum feeding (P = 0·001) because they did not drink 3·5 l voluntary on the 2 h feeding. Even after the 4-h feeding there was still a difference of 0·2 l in total colostrum intake between bottle and placebo tubing calves. Furthermore, placebo tubing calves needed more breaks at the 2-h and total colostrum feeding.
The power of analysis for the repeated measurement of total amount of colostrum among the 3 treatment groups was 0·9808, with an effect size of f = 0·762. The power of analysis was within the limits set by Cohen (Reference Cohen1988) and Prajapati et al. (Reference Prajapati, Dunne and Armstrong2010) and the effect size of this study was acceptable (Cohen, Reference Cohen1988).
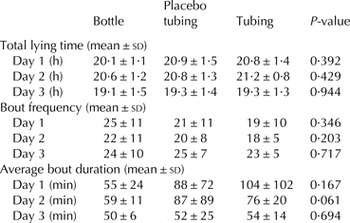
We did not find differences in total daily lying time among groups (P = 0·224), but there was large variation among individual calves. Furthermore, total daily lying time decreased over the length of the study (Table 2). Total daily lying time was 20·6 ± 1·3 h/d on day 1 and decreased from day 2 (20·9 ± 1·1 h/d) to 3 (19·3 ± 1·4 h/d; P < 0·001). These results support previous studies which concluded that total lying time changes with age (Hänninen et al. Reference Hänninen, de Passillé and Rushen2005; Borderas et al. Reference Borderas, Passillé and Rushen2009a). In our study, calves were lying 79 to 90% of the day. These values are in the upper range reported in previous studies in which calves spent 19 to 86% of the day lying (Borderas et al. Reference Borderas, de Passille and Rushen2008, Reference Borderas, Rushen, Keyserlingk and Passillé2009b; Yanar, Reference Yanar2010).
Lying behaviour 3 d after birth

Lying bout frequency did not differ among groups (P = 0·589) or days (P = 0·708, Table 1). Lying bout frequency was 18 to 25 bouts per day which is in agreement with Hänninen et al. (Reference Hänninen, Hepola, Raussi and Saloniemi2008) but slightly higher than the 9 to 19 bouts per day reported by Hänninen et al. (Reference Hänninen, de Passillé and Rushen2005) and Trénel et al. (Reference Trénel, Jensen, Decker and Skjøth2009).
Average lying bout duration, however, did not differ among groups (P = 0·477) or days (P = 0·809). Considering a possible short time effect on lying behaviour we also analysed a 1·3-h interval after treatment for calves of all groups. This interval was chosen because it was the shortest time between the investigator leaving the pen after the 2-h colostrum feeding and entering the pen for the 4-h colostrum feeding. Furthermore, we compared lying behaviour of bottle calves that did not receive a second colostrum feeding (n = 9) and tubing calves (n = 12) for 6 h following treatment. There were no differences in total lying time, lying bout frequency or average lying bout duration for these intervals. Interestingly, 61% (22 of 36) of the calves (42, 67 and 75% of the bottle, placebo tubing and tubing calves, respectively) did not stand up within 1·3 h after feeding. Even within 6 h after the 2-h colostrum feeding 24% (5 of 21) of the calves did not stand up (11 and 33% of the bottle and tubing calves, respectively). Placebo tubing calves were not included in this evaluation because the majority of these calves were motivated to get up for the 4-h colostrum feeding during the 6-h interval. The relevance of bout length, however, is unclear, but feeling comfortable or being depressed are two possible explanations for the extended lying bouts. In the present study, the average lying bout duration was 45 to 69 min which is in the reported range of 43 to 61 min for calves (Hänninen et al. Reference Hänninen, de Passillé and Rushen2005, Reference Hänninen, Hepola, Raussi and Saloniemi2008).
Moreover, Kaske et al. (Reference Kaske, Werner, Schuberth, Rehage and Kehler2005) observed in calves weighing <40 kg a moderate depression following drenching of 4 l for 24 h. In the current study, total daily lying time and average bout duration within days did not differ between groups. In our trial only 2 calves had a body weight ≤40 kg and the amount of colostrum applied by oesophageal tubing was 3·5 l.
The average birth weight of 45·7 ± 5·2 kg (bottle: 46·9 ± 5·9 kg, placebo tubing: 45·2 ± 4·6 kg, tubing: 45·1 ± 5·1 kg; P = 0·411) did not differ among groups and was similar to previous studies (Jasper & Weary; Franklin et al. Reference Franklin, Amaral-Phillips, Jackson and Campbell2003; Godden et al. Reference Godden, Haines, Konkol and Peterson2009b). In contrast to Vasseur et al. (Reference Vasseur, Rushen and de Passillé2009) who described birth weight to be an important factor affecting voluntary colostrum intake, no interaction was found in the current experiment (P = 0·554). This is probably due to the restriction of a maximum of 3·5 l of colostrum compared to ad libitum feeding. Average weight gain over the 4 experimental days was 3·9 ± 1·6 kg (bottle: 4·4 ± 1·8 kg, placebo tubing 4·2 ± 1·7 kg, tubing: 3·2 ± 1·0 kg; P = 0·443) which is slightly higher than the average daily gain of 0·8 ± 0·1 kg/d during the first week of a previous study in which calves were fed ad libitum (Jasper & Weary, Reference Jasper and Weary2002) and considerably higher than 1·3 kg in 3 d of a trial in which calves were fed 30% of their body weight (Borderas et al. Reference Borderas, de Passillé and Rushen2009c).
Several authors have suggested feeding 150 to 200 g IgG within 12 h after birth (Quigley Iii et al. Reference Quigley Iii, Kost and Wolfe2002; Chigerwe et al. Reference Chigerwe, Tyler, Middleton, Spain, Dill and Steevens2008; Godden et al. Reference Godden, Haines and Hagman2009a). In our study the calves consumed on average 255·6 ± 77·5 g of IgG (P = 0·812) with a minimum of 160·0 g and maximum of 405·3 g of IgG. Therefore, it is not surprising that 24 h after birth no calves were suffering from FPT (serum IgG concentration <10 mg/ml).
Although comparisons between studies are difficult because of different colostrum feeding strategies (e.g. time of colostrum feeding, numbers of feedings, total amount, method of feeding), different IgG concentration (g/l) and absolute content (g) and different time of blood sampling, the average serum IgG concentration of 22·8 ± 6·7 mg/ml was within the reported range of 19 to 31 mg/ml (Morin et al. Reference Morin, McCoy and Hurley1997; Godden et al. Reference Godden, Haines, Konkol and Peterson2009b; Elizondo-Salazar et al. Reference Elizondo-Salazar, Jones and Heinrichs2011). There was no difference in serum IgG concentration between groups (bottle: 23·3 ± 6·9 g/l, placebo tubing: 22·7 ± 7·2 g/l, tubing: 22·3 ± 6·7 g/l; P = 0·939) which is consistent with the results of Chigerwe et al. (Reference Chigerwe, Coons and Hagey2012) and Godden et al. (Reference Godden, Haines, Konkol and Peterson2009b) who fed large amounts of colostrum. However, when feeding only a small volumes of colostrum Godden et al. (Reference Godden, Haines, Konkol and Peterson2009b) reported higher serum IgG content in bottle compared to tube-fed calves. Furthermore, Adams found higher serum IgG levels in bottle-fed calves 24 h after birth whereas Besser et al. (Reference Besser, Gay and Pritchett1991) and Beam et al. (Reference Beam, Lombard, Kopral, Garber, Winter, Hicks and Schlater2009) found tubing to improve serum Ig supply. Serum IgG content increased with increasing batch quality (P < 0·001) and decreasing birth weight (P = 0·002).
A relationship between serum IgG concentration and TSPC 24 h after birth (r = 0·88, P < 0·001) existed as previously shown (Tyler et al. Reference Tyler, Hancock, Parish, Rea, Besser, Sanders and Wilson1996, Reference Tyler, Parish, Besser, Metre, Barrington and Middleton1999). Mean total serum protein concentration was 6·1 ± 0·6 g/dl (bottle: 6·1 ± 0·5 g/dl, placebo tubing: 6·1 ± 0·5 g/dl, tubing: 5·9 ± 0·8 g/dl; P = 0·742) which is in the reported range of 2·3 to 7·2 g/dl (Franklin et al. Reference Franklin, Amaral-Phillips, Jackson and Campbell2003; Jaster, Reference Jaster2005; Elizondo-Salazar et al. Reference Elizondo-Salazar, Jones and Heinrichs2011). In our study, the average TSPC did not correlate with the consumed amount of colostrum (r = 0·02, P = 0·920) but with the total amount of IgG consumed (r = 0·65, P < 0·001). This may be due to the range of IgG concentration (51·2 to 115·8 g/l) between the batches of colostrum. As a consequence some calves, although drinking less colostrum, consumed a higher amount of IgG than others which were drinking more colostrum.
In the present study the lying behaviour and suckling force were unaffected by feeding method. Serum IgG concentration 24 h after birth did not differ between treatment groups. This may indicate that most calves are able to drink sufficient colostrum within 4 h after birth. Routine tubing of calves might not be necessary when allocating enough time for colostrum feeding and allowing for short breaks.
We thank the staff of the University of British Columbia Dairy Education, the Research Centre and the University's Animal Welfare Programme (Vancouver, BC, Canada) and Agriculture and Agri-Food Canada. Stephanie Bonk was funded by a scholarship from Tiergyn Berlin e.V. (Berlin, Germany).