Introduction
In recent years, the demand for solar-grade silicon (SoG-Si) material as raw material for solar cells has drastically increased due to the rapid development of photovoltaic industry [Reference Braga, Moreira, Zampieri, Bacchin and Mei1, Reference Delannoy2]. Upgraded metallurgical grade silicon (UMG-Si) attracts more and more attention because it can be directly used for preparing solar-grade multicrystalline silicon, leads to significantly reduced production cost of silicon ingots for photovoltaic application [Reference Chen, Zhao, Dong, Liu, Wang and Xie3, Reference Morita and Yoshikawa4]. Directional solidification, which is one of the metallurgical routes, has become a primary method to fabricate solar-grade multicrystalline silicon because of its low cost and environment-friendly [Reference Tan, Ren, Shi, Wen, Jiang, Dong, Ji and Sun5, Reference Qiu, Ren, Huang, Tang, Fang and Luo6, Reference Ren, Li, Jiang, Tan, Li and Zhang7]. Nevertheless, the microstructures of silicon material, such as dislocations, high-energy grain boundaries, and impurities, greatly influence the electrical properties of the solar cells. How to control the microstructural characteristics of silicon ingot up to solar grade, thus, is the main problems to be solved when preparing multicrystalline silicon via the technology.
During the directional solidification process, the thermal field and distribution of impurity are affected by the liquid flow, which is primarily driven by the buoyancy force arising from horizontal thermal gradient. It is very difficult to obtain favorable liquid flow pattern only by adjusting hot zone configurations to control the buoyancy force. Nowadays, researchers try to control the liquid flow pattern by introducing an external force during the solidification process [Reference Cablea, Zaidat, Gagnoud, Nouri, Chichignoud and Delannoy8, Reference Yu, Liu, Li and Su9, Reference Buchovska, Dropka, Kayser and Kiessling10, Reference Atia, Ghernaout, Bouabdallah and Bessaïh11]. Cablea et al. [Reference Cablea, Zaidat, Gagnoud, Nouri, Chichignoud and Delannoy8] successfully altered the flow pattern by applying a travelling magnetic field in the melt. They found that the concentration of impurities at the top of silicon ingot could be reduced due to a forced convection generated by the electromagnetic stirring, which reduces the impurity concentration in the solute boundary layer, and that the solid–liquid interface shape was influenced by the magnetic field. The travelling magnetic field with varying directions and spatial distributions, however, makes the melt flow, thermal transport, and mass transport difficult to control. Thus, it is necessary to select a simple and efficient method for magnetic field regulation. The axial magnetic field, with the characteristic of simple construction and single direction, has been used to produce silicon single crystal from the melt in the Czochralski furnace [Reference Atia, Ghernaout, Bouabdallah and Bessaïh11, Reference Li, Ruan, Imaishi, Wu, Peng and Zeng12]. It was found that the axial magnetic field also changes the flow pattern, thermal field, and impurity distribution. Applying an axial magnetic field during the solidification process for preparing multicrystalline silicon will be a novel method. Thus, the changing laws of solid–liquid interface shape, defect, and impurity distribution during the directional solidification in an axial magnetic field need to be established.
Solid–liquid interface shape is very important during directional solidification since it can influence thermal stress, impurity distribution, and columnar grain growth [Reference Ren, Li, Jiang, Tan, Li and Zhang7, Reference Wei, Zhang, Zheng, Wang and Zhao13, Reference Ma, Zhong, Sun, Yu, Huang and Liu14, Reference Wen, Jiang, Shi, Tan, Li, Gu and Zhang15]. Generally, the relatively flat or slightly convex solid–liquid interface is most beneficial for the crystal growth because it is necessary to avoid the occurrence of fine grains due to the constitutional supercooling and to homogenize the horizontal distribution of impurities in the melt [Reference Ma, Zhong, Sun, Yu, Huang and Liu14]. During directional solidification process, the majority of impurities were segregated at the solid–liquid interface and concentrated in the silicon melt because of their low segregation coefficient [Reference Tan, Ren, Shi, Wen, Jiang, Dong, Ji and Sun5]. Ren et al. [Reference Ren, Li, Jiang, Tan, Li and Zhang7] have indicated that the stabilized flat solid–liquid interface could effectively exclude the impurity atoms from the solid to the silicon melt and avoided the constitutional supercooling, which induces the growth of irregular grains. Yang et al. [Reference Yang, Ma, Lv, Wei, Luo and Chen16] have revealed that the stabilized growth of the solid–liquid interface was conductive to obtaining a good microstructure of vertical, coarse columnar grains and little defects in the silicon ingot. Most of the works mentioned above have been investigated to control the interface shape during directional solidification process. However, the relationship between the combining of the axial magnetic field and silicon melt and the interface shape has not been revealed.
The electrical performance of silicon materials is related to the defects in the silicon ingot, such as grain boundary and dislocation. Twin boundaries, characteristics of specific values of misorientation, which allow atoms from neighboring lattices to notionally coincide, are referred to as special boundaries and often induce a very low dislocation density, so that highly twinned regions may be devoid of dislocations [Reference Randle17, Reference Stokkan18]. They are therefore considered as benign defects and the twinning is a favorable process. Stokkan [Reference Stokkan19] has studied the formation mechanism of twins in the multicrystalline silicon via experimental observations and proposed to facilitate the generated twins because they could reduce grain boundary energy. Lin et al. [Reference Lin, Wu, Chen and Lan20] also reported that the twin boundaries with perfect atomic arrangement could reduce the interfacial energy, where the impurities hardly deposit. The crystal defects will be significantly decreased in the phenomena. Thus, to optimize the crystal growth and reduce the defects in the silicon ingot, the mechanism of twinning in the silicon crystals needs to be elucidated.
In this paper, the solar-grade multicrystalline silicon ingots were obtained from UMG-Si by directional solidification under an axial magnetic field. The influence of preparation technology on the microstructural characteristics of silicon ingot was studied. Governing equations were used to simulate the melt flow and thermal fields during directional solidification for analyzing the influence factors of the solid–liquid interface shape. Moreover, the formation mechanism of the twin and removal mechanism of the impurities were also revealed.
Governing equations
The growth of multicrystalline silicon relies on the transport of heat, mass, and momentum. Governing equations, generally, are used to describe the conservation of those quantities in the solid and the liquid. In the present model, it is assumed that the silicon melt is an incompressible Newtonian fluid; the influences of temperature and solute on the gravity are negligible; and the fluid flow in the cylindrical crucible is regarded as axisymmetric flow. According to the above assumptions, the mathematical model is expressed by the following continuity and Navier–Stokes equations in the cylindrical coordinates system:
Continuity equation
 $${1 \over r}{{\partial \left( {ru} \right)} \over {\partial r}} + {1 \over r}{{\partial v} \over {\partial \theta }} + {{\partial w} \over {\partial z}} = 0\quad .$$
R-momentum equation
 $$\rho \left[ {{{\partial u} \over {\partial t}} + u{{\partial u} \over {\partial r}} + {v \over r}{{\partial u} \over {\partial \theta }} + w{{\partial u} \over {\partial z}} - {{{v^2}} \over r}} \right] = - {{\partial p} \over {\partial r}} + \mu \left[ {{\nabla ^2}u - {u \over {{r^2}}} - {2 \over {{r^2}}}{{\partial v} \over {\partial \theta }}} \right] + {F_{{\rm{L}}r}}\quad .$$
θ-momentum equation
 $$\rho \left[ {{{\partial v} \over {\partial t}} + u{{\partial v} \over {\partial r}} + {v \over r}{{\partial v} \over {\partial \theta }} + w{{\partial v} \over {\partial z}} + {{vu} \over r}} \right] = - {1 \over r}{{\partial p} \over {\partial \theta }} + \mu \left[ {{\nabla ^2}v - {v \over {{r^2}}} + {2 \over {{r^2}}}{{\partial u} \over {\partial \theta }}} \right] + {F_{{\rm{L}}\theta }}\quad .$$
Z-momentum equation [Reference Derby and Shuaeib21].
 $$\rho \left[ {{{\partial w} \over {\partial t}} + u{{\partial w} \over {\partial r}} + {v \over r}{{\partial w} \over {\partial \theta }} + w{{\partial w} \over {\partial z}}} \right] = - {{\partial p} \over {\partial z}} + \mu {\nabla ^2}w + g\rho + {F_{{\rm{L}}z}}\quad ,$$
where the Laplacian operator is given by:
 $${\nabla ^2} = {1 \over r}{\partial \over {\partial r}}\left( {r{{\partial u} \over {\partial r}}} \right) + {1 \over {{r^2}}}{{{\partial ^2}u} \over {\partial {\theta ^2}}} + {{{\partial ^2}u} \over {\partial {z^2}}}\quad .$$
In Eqs. (1)–(4), r, θ, and z indicate radial, azimuthal, and axial coordinates, respectively; u, v, and w are the three velocity components in the r, θ, and z directions, respectively; F Lr, F Lθ, and F Lz denote the components of the Lorentz force in the r, θ, and z directions, respectively; t, ρ, p, μ, and g are the time, fluid density, pressure, fluid dynamic viscosity, and gravitational acceleration (9.8 m/s2), respectively.
In the presence of magnetic field, a moving conductive fluid across magnetic lines of force generates a current and the charged fluids that traverse magnetic lines of force give rise to the Lorentz force, which can be described by the following equation:
 $${F_{\rm{L}}} = J \times B\quad .$$
According to Ohm’s law, the current density can be given by:
 $$J = \sigma \left( { - \nabla \Phi + V \times B} \right)\quad .$$
Substituting Eq. (6) into Eq. (5), the Lorentz force can be obtained as follows:
 $${F_{\rm{L}}} = \sigma \left( { - \nabla \Phi + V \times B} \right) \times B\quad ,$$
where B, σ, Φ, and V are magnetic field intensity, electrical conductivity of the silicon fluid, electric potential, and flow velocity vector, respectively. In previous works [Reference Jaber, Saghir and Viviani22, Reference Lan, Lee and Yen23], for the axial magnetic field and axisymmetric problems, neglecting the influence of electric potential is reasonable. Thus, the three components of the Lorentz force in the r, θ, and z directions are written as follows:
 $${F_{{\rm{L}}z}} = 0\quad ,$$
 $${F_{{\rm{L}}r}} = - \sigma uB_z^2\quad ,$$
 $${F_{{\rm{L\theta }}}} = - \sigma vB_z^2\quad ,$$
where B z is the magnetic field component in the z direction, namely, the strength of the axial magnetic field. Substituting Eqs. (8)–(10) into Eqs. (2)–(4), respectively, the governing equations of the silicon melt flow field under an axial magnetic field can be obtained. A negative sign in Eqs. (9) and (10) denotes that the Lorentz force is in direction opposite to the liquid silicon flow.
During the directional solidification of multicrystalline silicon, the heat transport between the silicon melt and the crucible is carried out mainly by heat conduction and convection. In the silicon melt, the heat and mass transports can be determined from the solution of the governing equations. Based on the energy balance equation, the governing equation of thermal field is given by:
 $$\rho {C_{\rm{p}}}\left[ {{{\partial T} \over {\partial t}} + u{{\partial T} \over {\partial r}} + {v \over r}{{\partial T} \over {\partial \theta }} + w{{\partial T} \over {\partial z}}} \right] = K\left( {{1 \over r}{\partial \over {\partial r}}\left( {r{{\partial T} \over {\partial r}}} \right) + {1 \over {{r^2}}}{{{\partial ^2}T} \over {\partial {\theta ^2}}} + {{{\partial ^2}T} \over {\partial {z^2}}}} \right) + Q\quad ,$$
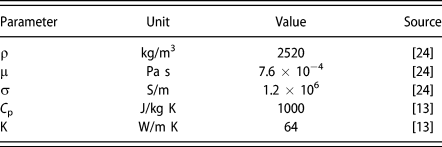
where T, C p, k, and Q are temperature, heat capacity, thermal conductivity of the silicon fluid, and heat source, respectively. The parameters used in the simulation are summarized in Table I.
Parameters used in the simulation.

According to the governing equations, the simulations for the flow and thermal fields during the directional solidification process were carried out by COMSOL Multiphysics software (Version 5.3a) from Zhongfang Computer Technology Co., Ltd. (Shanghai, China). To verify the reliability of the simulation results, careful grid and time-step independence tests should be performed. At a given time-step, independence tests with various grid numbers were carried out. It was found that they had a great influence on the simulation results. Whereas, when the number of grids exceeded 20,000, the change in simulation results was not obvious. Under 20,000 grids, the time independence was tested according to the time steps of 0.5, 0.1, and 0.01 min. The results show that when the number of grids reaches a certain level, the time step has little influence on the simulation. Thus, in this work, the 20,000 grids and the time step of 0.1 min were selected for numerical simulation.
Results and discussion
Morphology of multicrystalline silicon
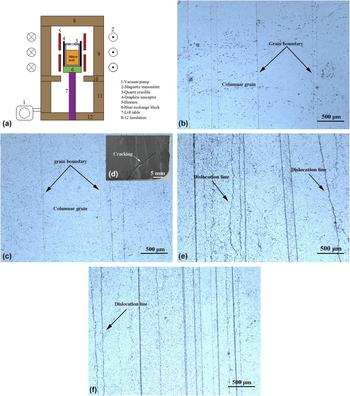
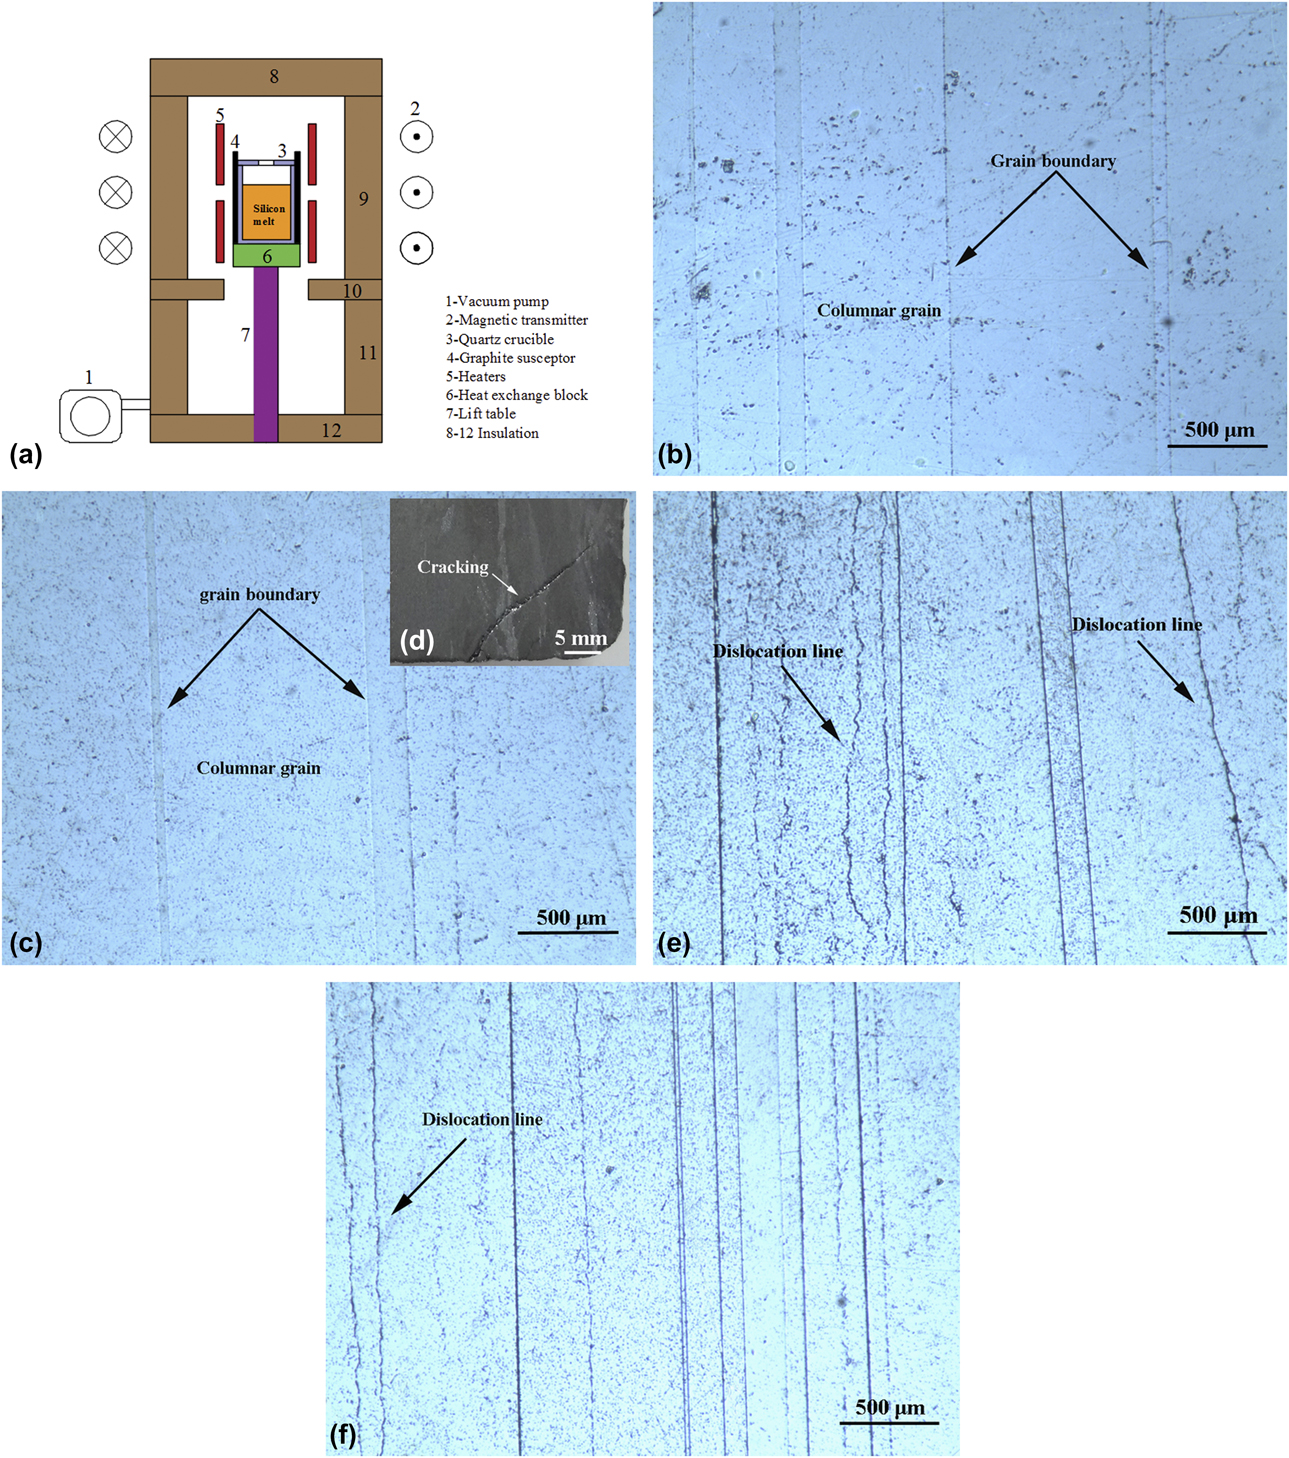
Figure 1 shows the schematic diagram of the experimental apparatus and the microstructures in the bottom of silicon ingots prepared by applying an axial magnetic field of 0.15 T at different melt temperatures and pulling-down rates. As seen in Figs. 1(b) and 1(c), with the increase in the melt temperature, the size of silicon grains obviously increased. At given pulling-down rate, the large axial temperature gradient produced because a high melt temperature can increase the driving force for crystal growth, finally generating coarse grains, whereas the excessive melt temperatures lead easily to the occurrence of cracking due to high thermal stress and to remelting of the formed grains, thereby giving rise to fine columnar grain [Fig. 1(d)]. At a certain melt temperature, many of fine columnar grains will occur with the increase in the pulling-down rate. This can be attributed to the fact that at a high pulling-down rate, the silicon melt will be speedily cooled, accordingly inducing abundant crystal nucleation. In Figs. 1(e) and 1(f), some dislocation etch pits with a linear distribution can be found in the matrix. Here, it is important to note that at the high pulling-down rate, the formed thermal stresses during directional solidification have not enough time to release, which may trigger a population of dislocations and the impurities cannot be removed effectively. Selecting the appropriate melt temperature and/or pulling-down rate, therefore, can contribute to increased grain sizes and reduced dislocations.
(a) Schematic diagram of the experimental apparatus and microstructures at the bottom of silicon ingots prepared by applying an axial magnetic field of 0.15 T at different melt temperatures and pulling-down rates: (b) 1698 K, 2 μm/s; (c) 1798 K, 2 μm/s; (d) 1848 K, 2 μm/s; (e) 1798 K, 12 μm/s; and (f) 1798 K, 17 μm/s.
Good electric performance of silicon material depends on the coarse columnar grain and stabilized interface growth. Under the magnetic field disturbance, the flow field does not make the solute in front of the solid–liquid interface distributed uniformly in the silicon melt, so that there is a solid–liquid interface boundary layer. Based on the theory of constitutional supercooling [Reference Ren, Li, Jiang, Tan, Li and Zhang7] and considering the effective segregation coefficient [Reference Tan, Ren, Shi, Wen, Jiang, Dong, Ji and Sun5], the stability criterion of solid–liquid interface can be given by:
 $${G \over V} \ge {{{m_0}{c_0}\left( {1 - {k_0}} \right)} \over {\left[ {{k_0} + \left( {1 - {k_0}} \right){\rm{exp}}\left( { - {V \over {{D_0}}}\delta } \right)} \right]{D_0}}}\quad ,$$
where G is the axial temperature gradient of the melt at the interface; V is the rate of crystal growth, namely, the pulling-down rate; δ is the solid–liquid interface boundary layer thickness; m 0 is the slope of the liquidus curve; c 0 is the initial concentration of impurity in the silicon melt; k 0 is the equilibrium segregation coefficient; D 0 is the diffusion coefficient of impurity in the melt, and m 0, c 0, k 0, and D 0 are constant for a given system. The liquidus temperature of the melts in the solid–liquid interface boundary layer is below their equilibrium freezing point due to the segregating of impurities. When the actual temperature gradient at the interface is above the liquidus temperature gradient, the solid–liquid interface will grow steadily into the melt. Hence, controlling the axial temperature gradient at the interface and the pulling-down rate, which makes the value of G/V satisfy Eq. (12), contributes to suppressing the formation of the supercooled liquid region and to avoiding formation of the fine grains, finally generating a columnar crystal structure with the stabilized solid–liquid interface.
Influence of axial magnetic field on the solid–liquid interface
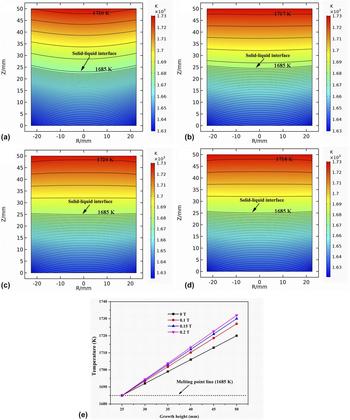
According to Eq. (11), the thermal field during the directional solidification was simulated. Figure 2 shows the thermal field with and without magnetic field at the middle solidification stage. During the growth of columnar grain, the solid–liquid interface shape can be identified by the melting point isotherm line (1685 K) because the transport of heat is the main way to affect its shape [Reference Li, Ruan, Imaishi, Wu, Peng and Zeng12, Reference Ma, Zhong, Sun, Yu, Huang and Liu14]. It can be observed in Fig. 2(a) that under no magnetic field, the solid–liquid interface shows a concave shape, which indicates that the fine grains appear in the outermost edge regions of silicon ingot, and that the impurities are easily engulfed by the interface. When an axial magnetic field was introduced into the silicon melt, the solid–liquid interface transformed from concave to relatively flat, with increased magnetic field strength, as shown in Figs. 2(b)–2(d), which has a positive effect on the inhibition of fine grain growth as well as the removal of impurities.
(a–d) Thermal field and (e) temperature distribution of the edge regions of the silicon melt along the growth height under different magnetic field strengths at the middle solidification stage: (a) 0 T, (b) 0.1 T, (c) 0.15 T, and (d) 0.2 T.

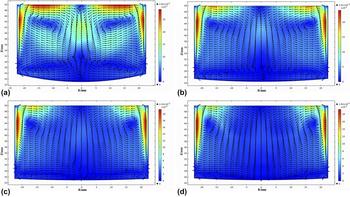
During the directional solidification, the growth rates in the r, θ, and z directions affect finally the growth tendency of silicon crystal. To obtain columnar grains with a flat solid–liquid interface, the grain growths in the r and θ directions need to be reduced or suppressed, accordingly making sure that the columnar grain grows perpendicular to the crucible bottom. According to Eqs. (2)–(4), the flow field during the directional solidification was simulated. Figure 3 shows the flow field with and without magnetic field at the middle solidification stage. In the conventional directional solidification process, a natural convection is mainly driven by the buoyancy force, as seen in Fig. 3(a). In Figs. 3(b)–3(d), it can be found that the magnetic field gradually forced the silicon melt to flow along the axial direction with the increase in magnetic field strength and that the maximum flow velocity of silicon melt was decreased by about 34% compared with that without magnetic field [Fig. 3(d)]. The results confirm that the axial magnetic field can suppress the convection driven by the buoyancy force. Moreover, it only can suppress the flow perpendicular to the direction of magnetic field, namely, the liquid flow in the r–θ plane. The transport of energy and mass is carried out by diffusion and convection in the liquid flow, and they strongly impact the crystallization driving force. Because of the suppression action of the axial magnetic field on the liquid flow, the driving forces of crystal growth in the r and θ directions are significantly reduced, which facilitates the vertical growth of columnar grains, finally leading to the formation of a flat solid–liquid interface. Figure 2(e) shows the temperature distribution of the edge regions of the silicon melt along the growth height at the middle solidification stage. As seen in Fig. 2(e), with the increase in magnetic field strength, the temperature of the silicon melt in the edge regions increases. The Lorentz forces produced by the axial magnetic field suppress the convection along the crucible wall (as seen in Fig. 3) and heat transfer rate from the crucible wall [Reference Li, Ruan, Imaishi, Wu, Peng and Zeng12] and reduce the heat transfer of the melt [Reference Atia, Ghernaout, Bouabdallah and Bessaïh11], accordingly resulting in the increased temperature of the silicon melt in the edge regions. Compared with no magnetic field, a low growth rate in the edge regions would be obtained due to their high temperature, and the solid–liquid interface would show a flat or convex shape with the crystal growth.
Flow field under different magnetic field strengths at the middle solidification stage: (a) 0 T, (b) 0.1 T, (c) 0.15 T, and (d) 0.2 T.

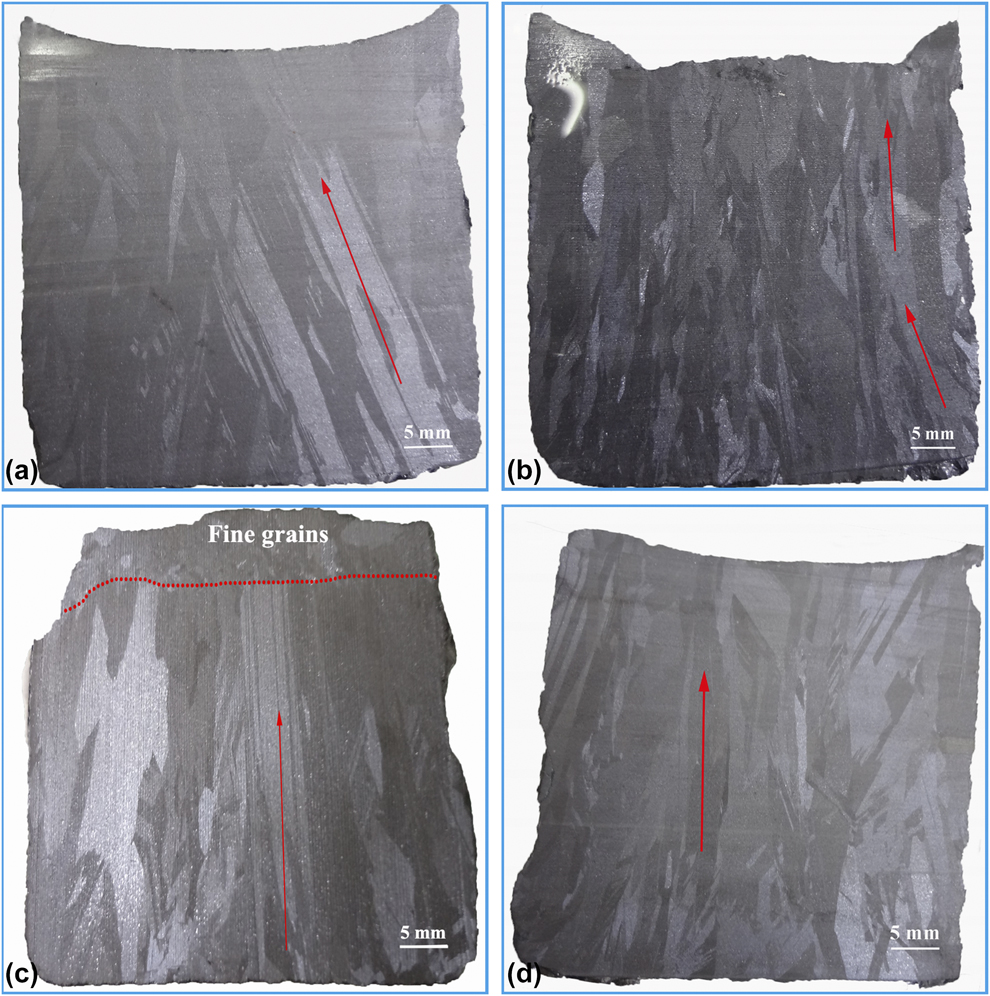
Figure 4 shows the microstructures of the silicon ingot prepared by applying different magnetic field strengths at 1748 K and a pulling-down rate of 7 μm/s. Generally, the grain grows along the direction perpendicular to the solid–liquid interface, so that the solid–liquid interface shape can be estimated by the growth tendency of grains. When the magnetic field was not present, the columnar grains grew inward from the bottom to the top [as indicated with red arrow in Fig. 4(a)], thus the interface was inferred to be concave with growth. This can be attributed to the fact that the sideways thermal dissipation of the crucible from inside to outside generated inward growing of columnar grains. However, at a low magnetic field strength [Fig. 4(b)], the growth of grains first deviated slightly from the axial direction and then was perpendicular to the bottom of the crucible, suggesting that the axial magnetic field has affected the growth of silicon crystal. Thus, the interface was first slightly concave and then flat with growth. With the increase in magnetic field strength, the columnar grains grew nearly vertically during the whole solidification process and was with a size of about 5 mm, as shown in Fig. 4(c). As a result, the microstructures with a relatively flat interface and coarse columnar grains were obtained. With a further increase in the magnetic field strength [Fig. 4(d)], the grain size was decreased and the interface shape did not change obviously. Note that the as-received microstructures under various magnetic field strengths were more consistent with the simulation results shown in Figs. 2 and 3.
Microstructures of the silicon ingots prepared by applying different magnetic field strengths at 1748 K and a pulling-down rate of 7 μm/s: (a) 0 T, (b) 0.1 T, (c) 0.15 T, and (d) 0.2 T.

Influence of axial magnetic field on dislocations
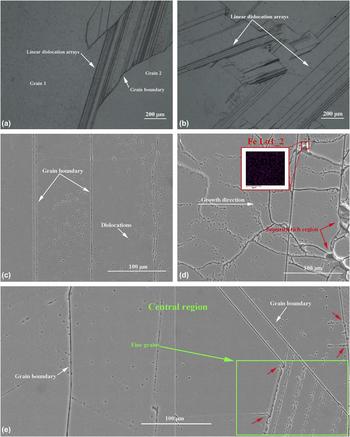
Figures 5(a) and 5(b) show the microstructures in different regions of the silicon ingot prepared without the axial magnetic field at 1748 K and a pulling-down rate of 7 μm/s. In Figs. 5(a) and 5(b), it can be found that linear dislocation arrays are present in the edge and central regions of silicon ingot. For no magnetic field, during the directional solidification process, the grain growth in the central regions would be impeded by that in the edge regions due to the grains growing inward, consequentially producing high normal and shear stresses in the grain boundaries between two adjacent grains. Once the stresses are beyond the critical stress of dislocation slip, the movement of dislocations can be activated, finally generating dislocation arrays [Fig. 5(a)]. On the other hand, the impurities were easily engulfed by the concave solid–liquid interface and then distributed within the grains. Impurity concentration or deposit in the grains induced lattice distortion, leading to the multiplication of dislocation [Fig. 5(b)]. Under the competitive growth of grains and/or the thermal stress, these dislocations moved in the slip plane, forming an array of dislocation.
Microstructures in the (a) edge and (b) central regions of the silicon ingot without the axial magnetic field. (c–e) SEM micrographs of the silicon ingot in different regions with a magnetic field of 0.15 T: (c) bottom, (d) top, and (e) center. Distribution of Fe element at a grain boundary [see EDS trace in inset in (d)], among which these silicon ingots were prepared at 1748 K and a pulling-down rate of 7 μm/s.

Figures 5(c)–5(e) show scanning electron microscopy–energy dispersive X-ray spectroscopy (SEM-EDS) micrographs in different regions of the silicon ingot prepared by applying a magnetic field of 0.15 T at 1748 K and a pulling-down rate of 7 μm/s. At the initial stage of directional solidification process, fine columnar grains perpendicular to the bottom of the crucible can be found in Fig. 5(c). During the directional solidification process, the bottom part of the crucible was first moved away from the hot zone, and many of fine columnar grains were produced via the chilling effect of the crucible. It can also be found that there are some distributed dislocations [as seen with black points in Fig. 5(c)] and no linear dislocation arrays in this region. This may be because the thermal stresses are released by lots of grain boundaries due to fine columnar grains and the residual stresses are not enough to drive the dislocations to slip. In Fig. 5(e), the dislocations in the central region of silicon ingot are obviously reduced compared with those in the bottom, which suggests that the axial magnetic field has caused the low thermal stress and the effective removal of impurities. Since most metal impurities are with low segregation coefficient [Reference Ren, Li, Jiang, Tan, Li and Zhang7], they are gradually pushed toward final solidification regions by the flat solid–liquid interface and then concentrate to the silicon melt, leading to the formation of dendritic structure at the top of the silicon ingot, namely, fine grains [Figs. 4(c)–5(d)]. Simultaneously, the impurities may act as sites for the nucleation of silicon crystal, giving rise to lattice distortion, finally generating a lot of dislocations and even dislocation clusters, as shown in Fig. 5(d).
Note, however, that fine grains of about 150 μm are observed in the central region as shown in Fig. 5(e), in which linear dislocation arrays are present. Due to the suppression action of the axial magnetic field on the liquid flow, especially that in the central region (Fig. 3), the solid–liquid interface boundary layer thickness would increase, likely resulting in the formation of fine grains due to the constitutional supercooling. With the increase in the magnetic field strength, more fine grains may be present. Besides, it is shown in Fig. 5(e) that some dislocations originated from the grain boundary and would propagate into the grains [as indicated with the red arrow in Fig. 5(e)], which indicates that the impurities segregated around the fine grains produce the serious lattice mismatch at the grain boundary, finally inducing dislocations. Thus, currently, there is a need for further research on how to avoid the occurrence of fine grains.
Twinning and crystal orientation
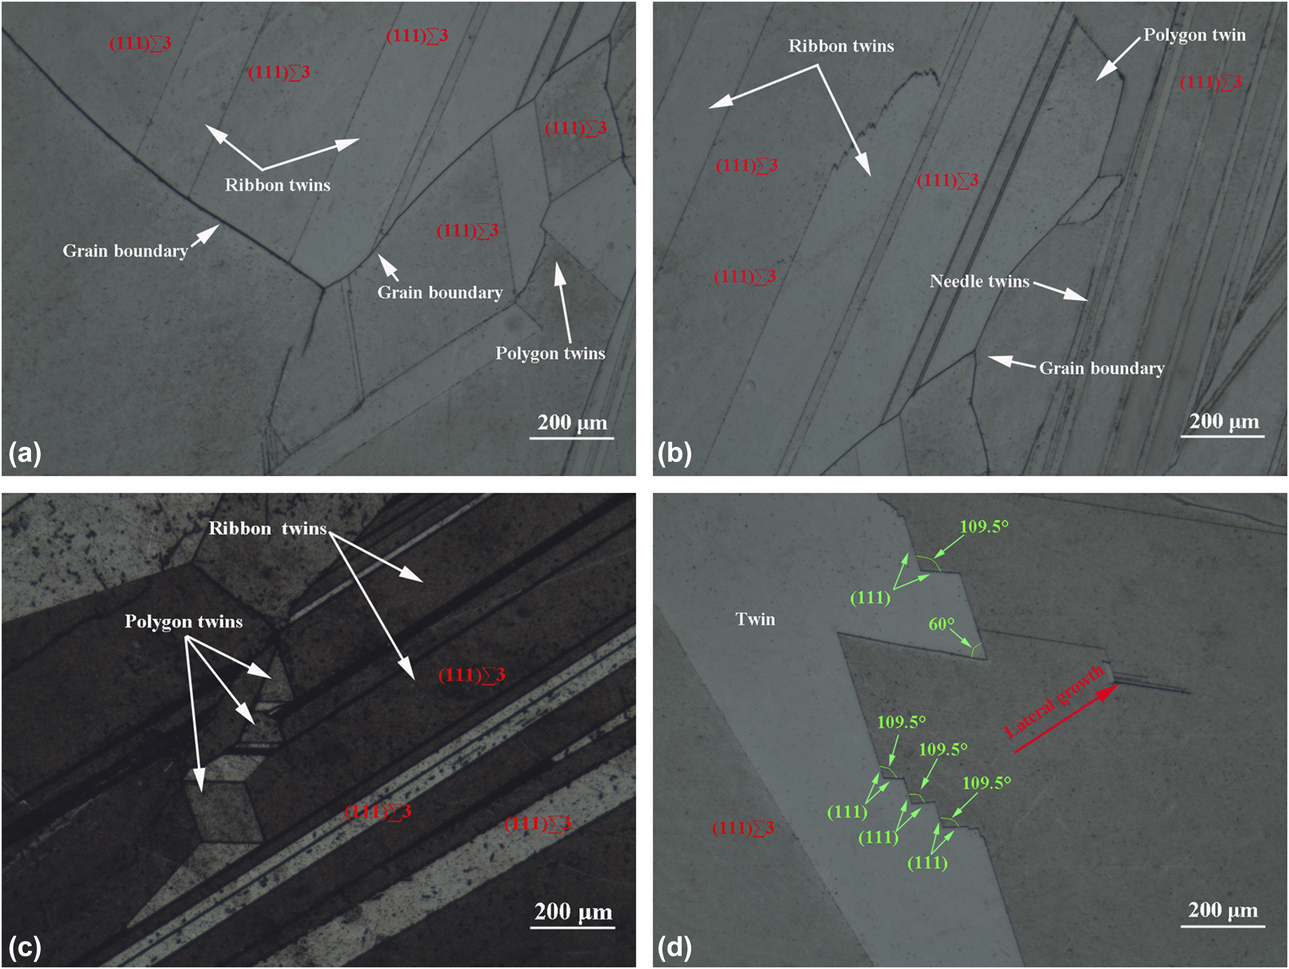
Figure 6 shows twin microstructures in different regions of the silicon ingot prepared by applying a magnetic field of 0.15 T at 1748 K and a pulling-down rate of 7 μm/s. In Fig. 6, it is found that lots of twins, which fall broadly into three forms, namely, ribbon twins, polygon twins, and needle twins, are distributed in the longitudinal plane of the silicon ingot. As noted, major twins originate from the grain boundaries and there are twin boundaries with straight and curve segments, in which many of the parallel segments are low-energy (111)∑3 twin boundaries; the short straight segments are high-energy ∑3 twin boundaries; the curve segments are ∑9 or ∑27 twin boundaries [Reference Stokkan19]. Formation of the twins is closely linked to the emergence of (111) facet on the solid–liquid interface. According to the twinning model reported by Fujiwara et al. [Reference Fujiwara, Maeda, Usami, Sazaki, Nose and Nakajima25], when a groove of 141° appears on the growth interface of crystal, the crystal rapidly grows until a corner angle of 60° forms, as shown in Fig. 6(d). In addition, before the groove of 141° fades away, twin nucleus on it can produce a new groove of 109.5°, finally resulting in the continuously growing crystal in lateral direction [as indicated with red arrow in Fig. 6(d)]. By repeating the above processes, twinning can be successfully carried out, causing the appearance of the twins with various shapes, such as triangle, rhomboid, and polygon, as shown in Figs. 6(a)–6(c). On the other hand, whether the formation of the twins also depends on the growth orientation of crystal needs to be established.
Twin microstructures in different regions of the silicon ingots prepared by applying a magnetic field of 0.15 T at 1748 K and a pulling-down rate of 7 μm/s: (a) bottom, (b) center, (c) top, and (d) twinning analysis.

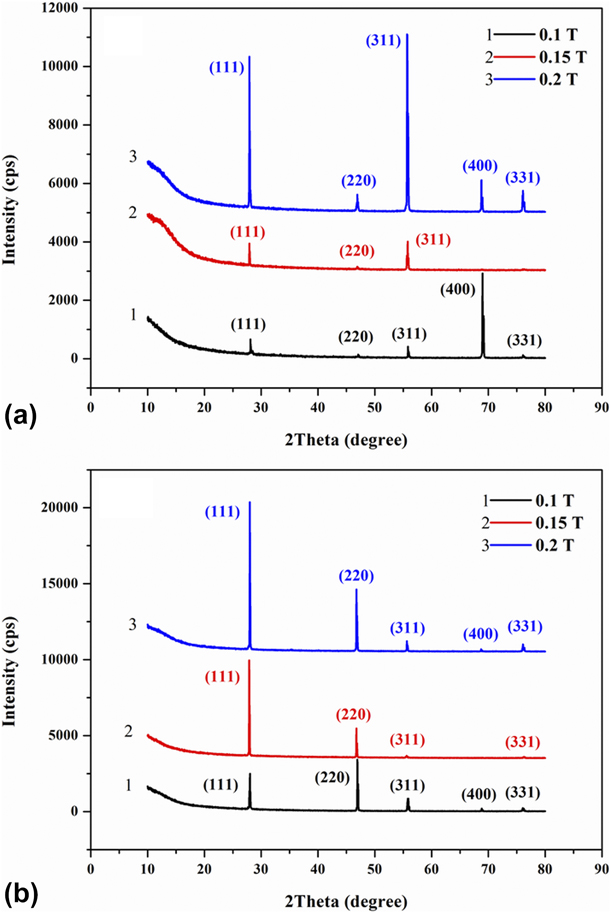
To investigate the crystal orientation under different magnetic field strengths, six silicon wafers with a thickness of 2 mm were chosen at 1/6 and 5/6 of the height along the growth direction of three silicon ingots for X-ray diffraction analysis (XRD) analysis. The microstructure of the central regions, generally, is with good quality compared with that of other regions, so that analyzing the crystal orientation in the bottom and top regions better reveals the influence of magnetic field on the crystal growth. The XRD patterns are shown in Fig. 7, among which Fig. 7(a) shows the diffraction peaks of the bottom of the silicon ingots, reflecting the crystal growth at the initial solidification stage. When applying a magnetic field of 0.1 T, the crystal growth was dominated by (400) orientation accompanied by a few (111) and (311) orientations. When applying a magnetic field of 0.15 T, (111) and (311) grains dominated as the (400) grains died out. When applying a magnetic field of 0.2 T, the growth rates of (111) and (311) grains increased rapidly, thus the (111) and (311) grains, accompanied by (220), (400), and (331) grains, finally prevailed in the bottom part of the silicon ingot. The results indicate that the (111) grains do not become dominant at the initial solidification stage under different magnetic field strengths.
XRD spectrum in different regions of the silicon ingots prepared at 1748 K and a pulling-down rate of 7 μm/s with different magnetic field strengths: (a) 1/6 and (b) 5/6 of the height from bottom.
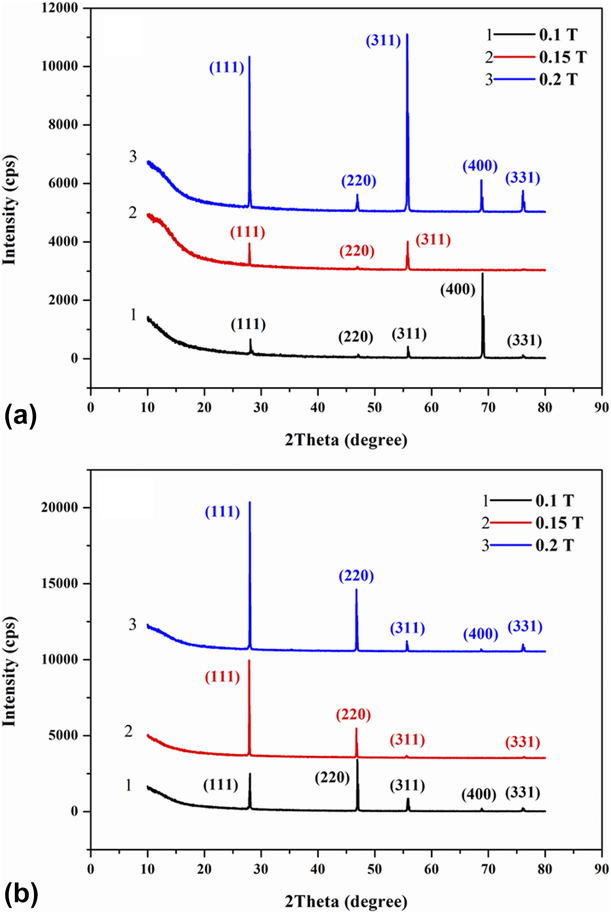
Figure 7(b) shows the diffraction peaks at the top of the silicon ingots grown at the late solidification stage. In Fig. 7(b), it can be obviously seen that the microstructures in the top regions are better than those in the bottom regions. When applying a magnetic field of 0.1 T, the upper part of the silicon ingots was dominated by the grains with (111) and (220) orientations and there were a few (311), (400), and (331) grains. When applying a magnetic field of 0.15 T, as the magnetic field strength increased, the growth rate of (111) was greatly faster than that of the (220) plane, while the growth of the (311), (400), and (331) grains died out gradually, which means that the (111) grains are favored. When applying a magnetic field of 0.2 T, the growth rates of the (111) and (220) grains increased simultaneously, and the (111) and (220) grains dominated, but some (311), (400), and (331) grains newly emerged. Based on the above XRD analysis results, we can find that the growth of the silicon ingots is in more homogeneous orientation when applying the magnetic field of 0.15 T compared with other conditions. Some research [Reference Wu, Yang and Lan26] reported that under great solidification rate, the (110)∑3 twin boundaries could be obtained. Due to (110)//(220), the short straight twin boundaries in the silicon ingots are likely related to the grains with (220) orientation. Thus, the presence of many ∑3 twin boundaries also depends on the crystal orientations of (111) and (220).
Removal mechanism of impurities
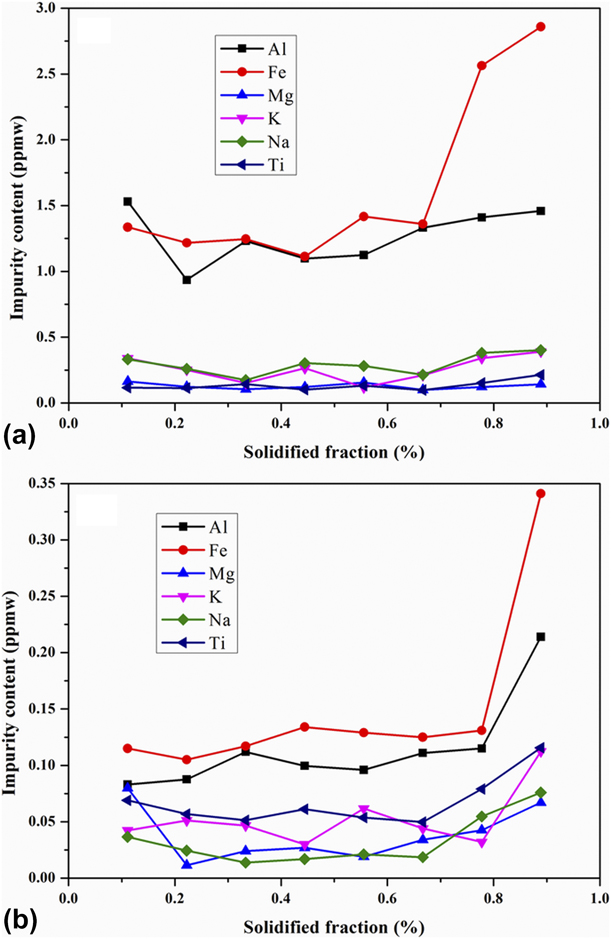
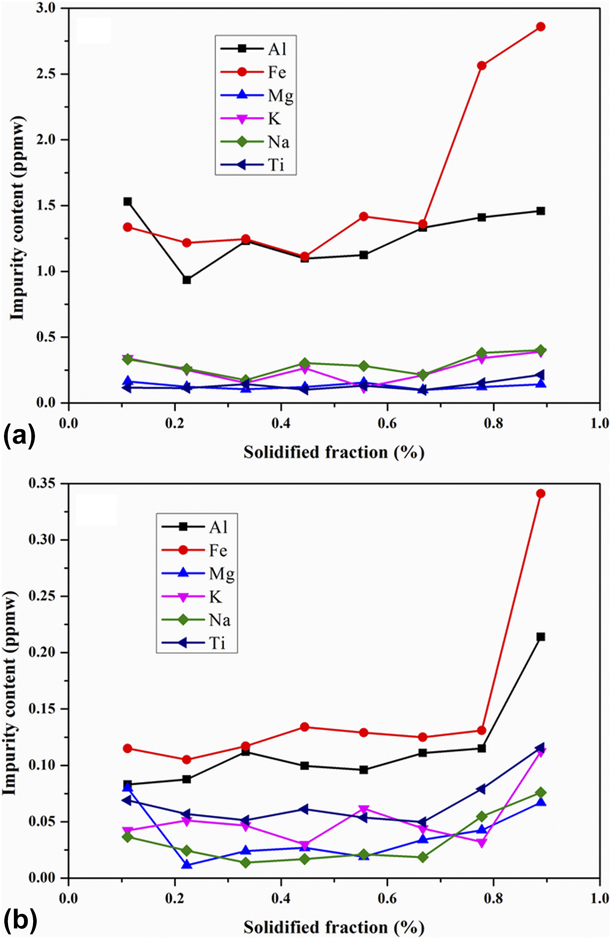
Figure 8 shows the distribution of metal impurities from 1/9 to 8/9 of height along the growth direction of the silicon ingots prepared at 1748 K and a pulling-down rate of 7 μm/s without and with the magnetic field.It can be seen from Fig. 8(b) that the total concentration of major metal impurities obviously decreased and was with a mean of 0.459 ppmw. The residual gases in the furnace cannot be ignored except the metal impurities in the raw materials. When the multicrystalline silicon was melting, the interaction between the liquid Si and the crucible wall and/or the dissolution of the quartz would generate the vapor phase SiO. Subsequently, the SiO was carried away by the argon flow and reacted with the graphite fixtures to form CO and SiC, and then the received CO and SiC were transported back to the silicon melt in the form of C and O atoms, and SiC particles via convection and diffusion [Reference Li, Liu, Ma and Kakimoto27, Reference Camel, Drevet, Brizé, Disdier, Cierniak and Eustathopoulos28]. Figure 9 shows SEM-EDS images of the silicon ingots without and with the magnetic field, among which Figs. 9(a) and 9(b) show SEM image and energy spectrum scan analysis near the center of the silicon ingots without the magnetic field. The measuring line is perpendicular to the growth direction of grains. It can be seen from Fig. 9(b) that there are high concentrations of impurities in the ingot, such as C, O, and Fe elements. Other impurities were not found due to the limitation in the accuracy for the measuring equipment. This means that the impurities are not effectively removed via the conventional directional solidification process, which is linked to the concave solid–liquid interface. Figs. 9(c)–9(e) show SEM-EDS images of the upper part of the silicon ingots with a magnetic field of 0.15 T. In Fig. 9(c), large amounts of dislocation etch pits with an inverted tetrahedron shape are found, which indicates that there are many (111) grains in the ingots, corresponding to the occurrence of low-energy (111)∑3 twin boundaries. It is also found that solid precipitation particles with the size of 7.85–0.56 μm are located at the top of the silicon ingots. The EDS results in Figs. 9(d) and 9(e) reveal that the precipitation particles distributed in the upper part mainly consist of SiC particles (at point 1: Si 65 wt%, C 32.25 wt%, O 2.75 wt%) and aggregations of SiC and TiSi2 particles (at point 2: Si 33.29 wt%, C 42.42 wt%, O 19.08 wt%, Ti 5.21 wt%), to which carbon and oxygen elements adhere. Significantly, Fe elements were not found in the detected precipitate particles by EDS analysis. The silicon melt containing Fe-rich elements, which has a low melting point [Reference Barin29], solidified slowly in the final solidification regions, leading to the deposition of FeSi2 or Fe at the grain boundaries, as shown in Fig. 5(d).
Concentrations of metal impurities from 1/9 to 8/9 of height along the growth direction of the silicon ingots prepared at 1748 K and a pulling-down rate of 7 μm/s with the magnetic fields of (a) 0 T and (b) 0.15 T.
(a) SEM image and (b) energy spectrum scan analysis near the center of the silicon ingot without the magnetic field. SEM-EDS images of the silicon ingot with a magnetic field of 0.15 T: (c) SEM image in the upper part and (d–e) EDS result of point 1 to 2, respectively, among which these silicon ingots were prepared at 1748 K and a pulling-down rate of 7 μm/s.

To understand the impurity migration, it is necessary to analyze the removal mechanism of the impurities. The distributions of C, Ti, and Fe impurities depend on their solubility in the solid. Due to low segregation coefficient ( $k_0^{{\rm{Fe}}} = 8 \times {10^{ - 6}}$,
 $k_0^{\rm{C}} = 0.07$,
 $k_0^{{\rm{Ti}}} = 2 \times {10^{ - 6}}$ [Reference Han, Zhu and Liu30]) and according to the Scheil equation [Reference Tan, Ren, Shi, Wen, Jiang, Dong, Ji and Sun5, Reference Ren, Li, Jiang, Tan, Li and Zhang7], these impurities segregated at the solid–liquid interface induce the formation of some precipitate phases such as SiC and TiSi2. The particles, on which the repulsive and drag forces act, are either engulfed by the solidification front, and thus distributed within the grain, or pushed by the solid–liquid interface toward the remainder liquid. Our previous work [Reference Chen and Yan31] reported that when the solidification rate was below the critical interface velocity for particle pushing that is related to the particle size, the particles would be pushed ahead of the solidification front. During the directional solidification process, the precipitate particle size increased gradually due to the impurity segregation. Thus, the presence of these precipitate particles at the top of the silicon ingots is attributed to the pulling-down rate below the critical interface velocity and the flat solid–liquid interface produced by the axial magnetic field. The distributions of Al, K, Na, and Mg impurities, however, are affected by vacuum conditions. The precipitate particles distributed in the silicon melt can act as substrates to adsorb the impurity atoms [Reference Qiu, Ren, Huang, Tang, Fang and Luo6], so the volatile metallic atoms can aggregate on their surface and then suspend in the silicon melt. Due to the sharp decrease in the mass transfer coefficients of volatile impurities at the beginning of solidification process [Reference Qiu, Ren, Huang, Tang, Fang and Luo6, Reference Ren, Li, Jiang, Shi, Li, Wen and Tan32], plenty of volatile impurity atoms under low vacuum condition rapidly escaped from the surface of the particles and evaporated from the silicon melt to the gas phase, then were extracted by the vacuum system. Beyond that, the suppression action of the axial magnetic field on the silicon melt flow could hinder the solid–liquid interface from again capturing the impurities due to liquid backflow (Fig. 3), and the decrease in liquid perturbation contributed to the adsorbing of the impurity atoms on the surface of the precipitate particles, finally depositing in the final solidification regions or then evaporating from the silicon melt.
Conclusions
(1) Under an axial magnetic field, appropriately increasing melt temperature and/or decreasing pulling-down rate during directional solidification can be conductive to the growth of coarse columnar grains with a flat interface, which is related to the suppression of the constitutional supercooling and the silicon melt flow in both radial and azimuthal directions.
(2) When applying an axial magnetic field, the formation of many ∑3 twin boundaries in the crystal was promoted, which contributes to the reduction of impurity and dislocation in the silicon ingots. This is mainly because of the emergence of twin groove with (111) facet and the crystal orientations of (111) and (220).
(3) In the silicon ingots prepared at 1748 K and a pulling-down rate of 7 μm/s with an axial magnetic field of 0.15 T, the total mean concentration of major metal impurities was 0.459 ppmw and the dislocations were decreased obviously. The impurity atoms, adsorbed on the surface of the precipitate particles, were pushed by the flat interface, finally depositing in the final solidification regions or then evaporating from the silicon melt.
Experimental methods
Preparation of solar-grade multicrystalline silicon
The experimental equipment (Chenhua Technology, China) consists of excitation system, insulation system, heat system, heat exchange system, pulling system, and vacuum system. The insulation system is used to prevent the heat flowing along the horizontal direction of crucible. During the directional solidification process, the quartz crucible moves downward with the lift table while the insulation and heat systems remain stationary. Then, the heat of silicon melt flows only along the axial direction and is taken away by the heat exchange block, so that the crystal grows from the bottom to the top.
UMG-Si was used as the raw material in this experiment. The concentration of impurities in the raw material is about 100 ppmw (LDK, China). Before conducting the directional solidification process, to remove possible SiO2 oxidation film from the surface of UMG-Si ingots, 180 g UMG-Si was etched with 5 vol% hydrofluoric acid (HF) water and then washed sufficiently with distilled water, followed by a drying at 573 K for 1 h in argon gas atmosphere. Subsequently, the preprocessed UMG-Si was placed in an α-Si3N4-coated quartz crucible of solar grade with an inner dimensions of Φ45 × 80 mm (Jiabo quartz, China), and the furnace chamber was evacuated to 0.1 Pa. A flowing argon gas (99.999% pure) was introduced into the furnace when heater temperature was increased up to 1558 K, and this temperature was held for 100 min. Meanwhile, the furnace pressure rapidly increased to 1 × 10³ Pa. Then, heater temperature was gradually increased to 1873 K, and the temperature was maintained until the silicon ingot was completely melted. After that, the heater temperature was decreased to different temperatures (1698, 1748, 1798, and 1848 K). Immediately, the crucible was pulled downward out of the heating zone at the speeds of 2, 7, 12, and 17 μm/s. At that moment, an axial magnetic field with different strengths (0, 0.1, 0.15, and 0.2 T) was introduced into the silicon melt. After the silicon melt was solidified completely, the heater temperature was lowered to 1573 K, and the excitation and heat systems were shut off. The multicrystalline silicon ingots were obtained.
Microstructures
The as-received silicon ingots were cut axially along the center line by a mechanical saw for observing the central regions of the ingots. Microstructural examinations were performed by optical microscopy (OM; Nikon eclipse, MA-200) and SEM (FEI, Nova NanoSEM 450) equipped with X-ray mapping system. The morphological characteristics of grains were examined using the metallographic microscope. For further identification, the field emission scanning electron microscope was used to investigate the interfaces, the morphology and distribution of dislocations, and the distribution of impurities. For microstructural observation, the samples were ground, mechanically polished for 10 min, and then etched by the Dash reagent (volume ratio: HF:HNO3:CHCOOH = 1:3:7). To discuss the effect of magnetic field strength on the crystal growth orientation, samples were subjected to XRD (PHILIPS, PW-1800). For the silicon ingot obtained under a preparation condition, eight samples were chosen in the central region from the bottom to the top to determine impurity distributions along the growth direction via inductively couple plasma mass spectrometry (DRC II; PerkinElmer).
Acknowledgments
Authors express their gratitude to the National Natural Science Foundation of China (51664047), Natural Science Foundation of Jiangxi Province (20192BAB206030), and Science and Technology Program of Education Office of Jiangxi Province (GJJ171065) for financial support.