I. INTRODUCTION
Thermoelectric (TE) devices have important applications in solid-state energy conversion for both cooling and power generation,Reference Rowe1 as well as optical detection systems.Reference Huber, Scott, Johnson, Brower, Belk and Hunt2 This technology is limited by the low energy conversion efficiencies of existing TE materials, typically characterized by the TE figure of merit, zT = (α2σ/κ)T, where α is the thermopower (Seebeck coefficient), σ is the electrical conductivity, and κ is the thermal conductivity. One approach to improving zT is to take advantage of nanoscale effects to improve the electronic and thermal transport properties. For instance, theory predicts large enhancements to TE performance for materials in nanowire geometries.Reference Hicks and Dresselhaus3 Nevertheless, the best-reported zT's for TE nanowires achieve only a fraction of the values for conventional bulk materials, which is far from the predicted improvements. This is most likely due to inadequate control of composition, compositional uniformity, and crystalline microstructure. These problems are challenging due to the complex chemistries and crystallography typical of TE compounds.
There have been many reports on the growth of Bi2Te3-based nanowires using nanopore templates.Reference Sapp, Lakshmi and Martin4–Reference Picht, Muller, Alber, Rauber, Lensch-Falk, Medlin, Neumann and Toimil-Molares17 Only a few of these determined zT for individual nanowires, and the values are always below those for bulk material. Promising results include those for ∼200 nm diameter Bi2Te3 nanowires grown by electrochemically decorating step edges on highly oriented pyrolytic graphite surfaces, with zT values ranging from 0 to 0.82 at room temperature.Reference Menke, Brown, Li, Hemminger and Penner10 While the higher value zT measurements were seen in only 5% of the nanowires tested, it is intriguing that they are essentially equivalent to that of bulk Bi2Te3 materials; this is expected given the large nanowire diameters.Reference Rowe1 A more recent result for an array of 120 nm diameter Bi2Te3 nanowires calculated zT = 0.45 and 0.9 at 300 and 350 K, respectively; however, it should be noted that electrical conductivity, Seebeck coefficient, and thermal conductivity were each measured from different samples, partly from individual nanowires and partly from an entire array.Reference Chen, Chen, Lin, Ho, Lee, Chen and Harutyunyan15
The question that must be answered is what is different about Bi2Te3-based nanowire materials compared to their bulk counterparts. Perhaps the single biggest difference lies in their microstructure. In contrast to bulk Bi2Te3-based materials, which are typically processed at elevated temperatures ranging from 350 to 500 °C,Reference Cao, Zhu, Zhao, Zhang and Tu18,Reference Xie, Tang, Yan, Zhang and Tritt19 there have been few attempts to heat-treat Bi2Te3 nanowires. There are two primary reasons for the limited exploration of this approach. First, there is potential loss of Te due to its relatively high vapor pressure at temperatures >250 °C, an effect that is made worse by the high surface-to-volume ratio of a nanowire geometry. Second, since Bi2Te3-based nanowires are commonly grown in nanopore templates, microcracks within the nanowires easily occur upon heating due to differences in the thermal expansion coefficients of the nanowire and template materials. For instance, although previous annealing studies of nanowires still encased in their nanopore templates did exhibit improved crystallinity, microcrack formation greatly reduced the electrical conductivity of the nanowires along their lengths, a deleterious development for zT.Reference Chen, Chen, Lin, Ho, Lee, Chen and Harutyunyan15,Reference Lee, Berger, Cagnon, Gosele, Nielsch and Lee16
In this paper, we investigate the effects of thermal annealing on Bi2Te3-based nanowires to better understand the evolution of composition, grain structure, and secondary phases. We perform these anneals with the nanowire array templates removed to avoid the deleterious effects of microcracking due to thermal expansion coefficient differences. Furthermore, we focus specifically on nanowires with an initial ternary Bi2(Te0.97Se0.03)3 composition since this falls in the typical range of n-type formulation. This analysis provides insight concerning the processes governing the microstructural evolution in the class of nanowire materials and suggests some ranges and limits for optimal annealing conditions.
II. EXPERIMENT
We use electrochemical deposition (ECD) to grow nanowire arrays with nominal composition Bi2(Te.97Se.03)3 into anodized aluminum oxide (AAO) templates with ∼75-nm diameter pores on Si(100) substrates as described elsewhere.Reference Limmer, Yelton, Siegal, Lensch-Falk, Pillars and Medlin20 Briefly, the AAO is formed using a slightly modified version of the method reported by Oh and Thompson.Reference Oh and Thompson21 First, we radio frequency (RF) sputter deposit 20 nm Ti onto HF-dip cleaned Si(100) wafers to enhance adhesion of the following layer depositions. Then, we RF sputter deposit a 100-nm thick W film, followed by 2–5 µm thick 3 wt% Nd-doped Al. It is imperative that appropriate sputter conditions be determined that minimize the residual stress that results from all film deposition methods. This can be accomplished by controlling both the RF sputter power and the background Ar gas pressure for a given distance between a sputter target and the substrate.Reference Siegal, Overmyer and Kaatz22 Using Nd-doped Al prevents the usual oxidation that often forms rough surfaces upon exposure to air, instead resulting in very smooth and shiny films eliminating the need to electropolish the Al or use a two-stage anodization.Reference Jeong and Lee23 Finally, a 0.5-µm thick Ti electrical contact strip is added to an edge of the sample to assist with the anodization and EC depositions.
The Nd-doped Al film is anodized in an oxalic acid solution to create AAO with ∼45-nm diameter pores, as described previously.Reference Limmer, Yelton, Siegal, Lensch-Falk, Pillars and Medlin20 Anodization is halted when the anodization current dips by 10–50% from its steady-state value, indicating that the process has reached the W underlayer to form a thin WO3 film on the W surface. This WO3 layer is chemically removed using a 0.2 M pH 7 phosphate buffer solution, leaving an electrically conductive W layer at the pore bottoms. Finally, the pores are widened to ∼75 nm by etching in phosphoric acid.
Nanowires with nominal composition Bi2(Te0.97Se0.03)3 are grown into the nanopores using galvanostatic-pulsed ECD in a nonaqueous bath, described in detail in Ref. Reference Limmer, Yelton, Siegal, Lensch-Falk, Pillars and Medlin20. The AAO templates are then removed by etching in phosphoric acid resulting in an array of 75-nm wires attached directly to a W/Ti/Si(100) substrate. The resulting as-deposited nanowires have very uniform composition over their entire lengths, are polycrystalline, and consist of 5–10 nm grains.Reference Limmer, Yelton, Siegal, Lensch-Falk, Pillars and Medlin20
To study the evolution of crystallinity and material phase(s) of the nanowires, the nanowire arrays were annealed for 30 min at temperatures ranging from 200 to 500 °C in a 3% H2/Ar forming gas environment. Note that all annealing studies and subsequent structural characterizations were performed following removal of the AAO templates. Scanning electron microscopy (SEM) was used to demonstrate that the nanowire geometries were essentially unchanged before and after annealing. X-ray diffraction (XRD) θ–2θ scans with 0.04° steps and 5 s dwell times were used to identify the material phases and orientations that developed as a function of annealing.
Nanowires were prepared for study by transmission electron microscopy (TEM) by sonicating the nanowire arrays in isopropanol, then drop casting the solution onto ultrathin lacy carbon TEM grids (Ted Pella, Redding, CA). TEM was performed using a 200 kV JEOL 2010F (Peabody, MA) equipped with an Oxford energy dispersive spectroscopy (EDS) detector to study the evolution of grain sizes, orientations, and interfaces within individual nanowires. Scanning TEM (STEM) with a nominal 1.6 nm diameter probe was used to acquire energy dispersive spectroscopy (EDS) from multiple points along individual nanowires to determine their compositions along their lengths as well as their average compositions from nanowire to nanowire. The spectra were analyzed using the quantitative package within the INCA Microanalysis Suite (v. 4.15). Compositional accuracy from this package has been confirmed by measuring Bi–Te binary references of known compositions on the same instrument.
III. RESULTS
A. Nanowire array formation
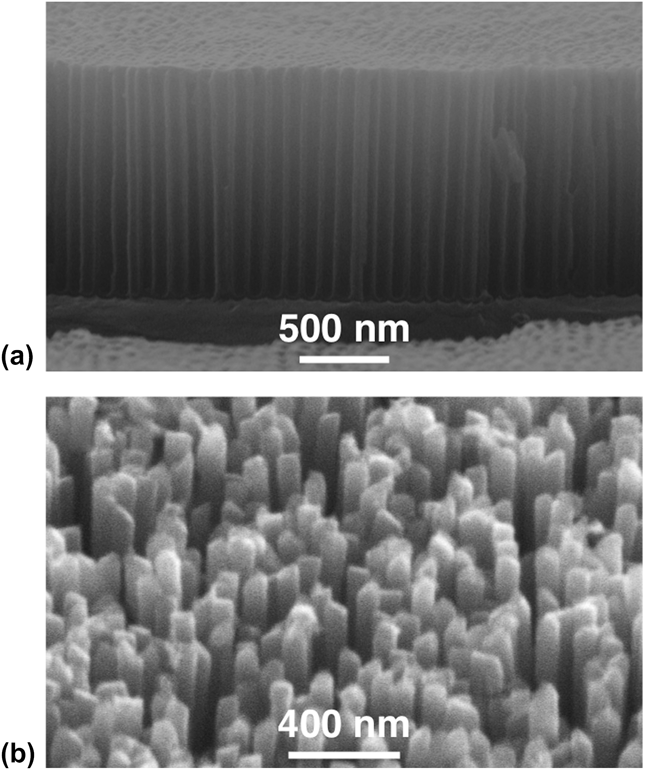
Figure 1(a) shows a SEM image of an AAO nanopore template grown directly on Si(100) substrates. Following the pore widening process, the templates have uniform ∼75 ± 5 nm diameter pores in a quasi-hexagonal close-packed arrangement. The overall porosity of the template is ∼50%. Beneath the template is the thin W layer that remained following WO3 removal and the ∼20-nm-thick Ti layer in direct contact with the Si(100) substrate. The existence of this metallization at the template/substrate interface provides a necessary backside electrical contact for ECD growth of the nanowires and enables both the eventual property measurements of the entire array and any useful TE device configuration. Figure 1(b) shows a typical as-deposited nanowire array on metalized Si(100) following AAO removal.
(a) SEM image of an AAO nanopore template grown directly on W-coated Si(100) and (b) as-deposited nanowire array on Si(100) following AAO template removal.

B. Changes in composition with thermal annealing
The as-grown ECD Bi2(Te1−xSex)3 nanowires have uniform compositions within the measurement errors along their lengths and from nanowire to nanowire.Reference Limmer, Yelton, Siegal, Lensch-Falk, Pillars and Medlin20Figure 2 shows the average nanowire compositions as a function of annealing temperature up to 500 °C measured using STEM EDS for multiple points along the lengths of several nanowires. While the nanowire compositions change as a function of thermal annealing due to the loss of Se and Te, they continue to demonstrate compositional uniformity from nanowire to nanowire and along the lengths of given nanowires, with variations all within the error bars. Note that the Te concentration decreases with increasing annealing temperature, consistent with its relatively high vapor pressure compared to Bi. The Se concentration appears to hold steady at 2% atomic composition (∼3.3% substitution for Te) up to 400 °C. This result might be surprising since the vapor pressure of elemental Se is very high compared to both Te and Bi. However, it turns out that Bi2Se3 has a lower vapor pressure than Bi2Te3, so Te loss actually should occur at a higher rate than Se.Reference Cafaro, Bardi and Piacente24,Reference Bardi, Cafaro, Gianfreda and Piacente25 This suggests that the Se doping level can be controlled via the initial electrodeposition of Bi, Te, and Se, especially if optimal TE properties can be attained for materials annealed at temperatures ≤400 °C.
Average nanowire composition from EDS measurements as a function of annealing temperature. Se error bars are smaller than data points.
C. Evolution of microstructure via thermal annealing
The nominal Bi2(Te0.97Se0.03)3 nanowire arrays do not change their geometry, determined by SEM, as a function of annealing over the entire temperature range used in this study. However, changes in crystalline quality and phase evolution are shown using XRD as a function of annealing temperature in Fig. 3. The substitution of a small amount of Se for Te into Bi2Te3 does not appreciably change the crystal structure.Reference Wiese and Muldawer26 Note that the XRD patterns are plotted using a logarithmic scale to more readily observe small structural changes. Since these scans were performed using a powder diffractometer, the samples could not be precisely aligned; therefore, the very narrow Si substrate peak at 2θ ∼ 33° is not always observed. In addition, the Ti and W metals underneath the nanowire arrays are observed as very broad weak peaks centering near 35 and 40°, respectively. Any variations to these peaks identified as Si, Ti, and W in the patterns presented in Fig. 3 are not relevant to the evolving Bi2(Te1−xSex)3 rhombohedral microstructure within the nanowires grown on top of the W/Ti/Si(100) substrates.
XRD patterns plotted on a logarithmic scale of the nanowire arrays from as-deposited at ∼25 °C (bottom) to annealed at 500 °C (top). Positions for the Si substrate, Ti and W film peaks are labeled near bottom. Miller indices for Bi2Te3 are shown for the above pattern for which they first appear. All indices for both Bi2Te3 and Bi4Te3 are shown for the 500 °C annealed sample for clarity. The desired (110) diffraction peaks are dominant.
The as-deposited nanowires at 25 °C in Fig. 3 have the weakest and broadest XRD peaks, each representative of Bi2Te3, including the (101), (015), (110), and (205) reflections. Miller indices are shown immediately above the XRD pattern in which they first appear. Following anneals at 200, 300, and 400 °C, the number of observable Bi2Te3 XRD peaks increases and these peaks also show a steady increase in both magnitude and sharpness, implying increases in grain size and/or crystalline quality. Note that a very small unidentified peak at 46.7 °C first appears at 300 °C. The amplitude of this peak increases with annealing at 400 °C and is joined by another unidentified XRD peak at 38.4°.
The dominance of the Bi2Te3 phase is lost for nanowire arrays annealed at 500 °C. XRD finds the strong presence of both Bi2Te3 and Bi4Te3, a Bi-rich phase. Since Bi2Te3 and Bi4Te3 share some XRD peaks, all of the peaks are labeled on this pattern to prevent confusion. The unidentified XRD peaks from the samples annealed at 300 and 400 °C are not observed here. The EDX results in Fig. 2 showed that for nanowires annealed at 500 °C, the Te loss is significant and Se is no longer observable. Not surprisingly, with the Bi/Te atomic ratio ∼1, XRD identifies the presence of a Bi-rich phase to balance compositionally with Bi2Te3. A similar result for nanowires annealed at only 400 °C but for 4 h has also been reported.Reference Lee, Berger, Cagnon, Gosele, Nielsch and Lee16
D. Grain growth with thermal annealing
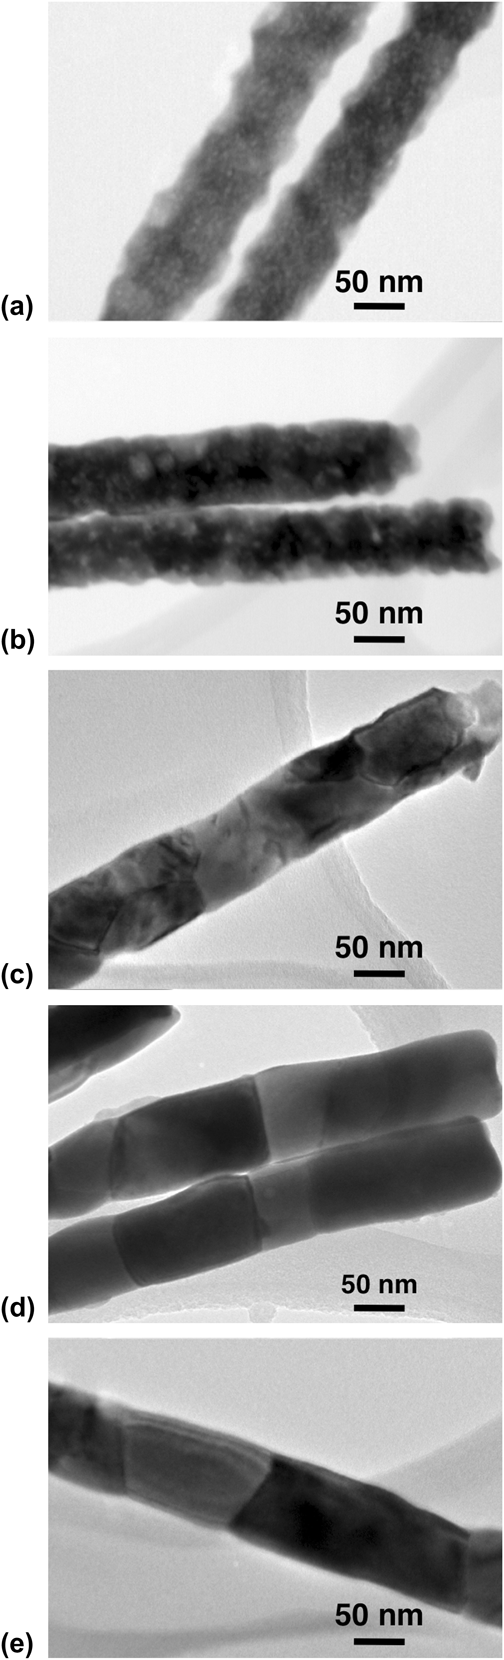
Representative TEM images for the nanowire samples are shown in Fig. 4. Figure 4(a) shows that the as-grown nanowires consist of 5–10 nm polycrystalline grains. Figures 4(b)–4(e) show nanowires following anneals at 200, 300, 400, and 500 °C. The development of the grain structure is consistent with the evolving Bi2Te3-based microstructure observed by XRD in Fig. 3. Figure 4(b) shows that the individual grains become more distinct and now range from 20 to 40 nm in size with 200 °C annealing. By 300 °C, Fig. 4(c), every grain appears to be as wide as the entire nanowire, with lengths ranging from 55 to 100 nm. Figure 4(d) shows continued grain growth following annealing at 400 °C. These grains are still the full width of the nanowire but are now 74–320 nm in length. It is worth noting that this temperature (400 °C) also corresponds to relatively high crystalline quality and is the highest annealing temperature we investigated that does not show significant XRD evidence of Bi-rich secondary phases. Finally, Fig. 4(e) shows a nanowire annealed at 500 °C, with the individual grains reaching 350 nm lengths. However, this annealing condition produces a mixed phase nanowire containing both Bi2Te3 and Bi4Te3.
TEM images for representative nanowires (a) as-grown at 25 °C, and annealed for 30 min at (b) 200 °C, (c) 300 °C, (d) 400 °C, and (e) 500 °C.
IV. DISCUSSION
The evolution of improved Bi2Te3 crystalline quality and increasing grain sizes as a function of annealing temperature is critically important for the optimization of TE properties, especially the power factor α2σ, the product of thermopower and electrical conductivity. Conversely, while improved structural properties normally enhance thermal conductivity, in reality, the long mean free path of phonons, compared to electrons, should allow the small size of the nanowire diameter to be sufficient to minimize κ. Therefore, material processes that optimize the structural quality of nanowires with small diameters, while maintaining control of doping levels, should result in the best TE performance for nanowire arrays.
Note that the precise methodology used for the ECD of Bi2Te3 nanowires into AAO pores can greatly affect the resulting as-deposited nanostructures. Such nanowires are commonly grown via ECD in an aqueous solvent at very low pH, such as 1 M HNO3.Reference Martin-Gonzalez, Snyder, Prieto, Gronsky, Sands and Stacy27,Reference Sander, Gronsky, Sands and Stacy28 These solutions can yield as-deposited nanowires with strongly preferential (110) texture, especially when the ECD is performed at reduced temperatures between 1 and 4 °C, which suggests that decreasing the deposition rate leads to higher structural-quality nanowires.Reference Trahey, Becker and Stacy11 However, TEM analysis of individual nanowires found evidence of local strain fields that will likely be detrimental to electronic transport. Note that ECD of Bi2Te3 and (Bi,Sb)2Te3 films performed in a nonaqueous bath, similar to our nanowire growth, yields a very different crystalline structure.Reference Li29,Reference Li and Wang30 Rather than the sharp XRD peaks with preferential (110) texture, these films tend to have broad XRD peaks, indicative of small grain sizes, and a preferential (101) or (015) texturing. While the relatively XRD broad peaks are similar to those of our as-deposited nanowires, the texture preference is quite different, which may be a result of growing confined in a nanopore versus an open substrate surface.
The rate of crystalline grain growth in the nanowires as a function of thermal annealing can be extracted from the TEM data. Figure 5 plots the smallest and largest observed grain sizes from multiple images similar to those shown in Fig. 4. Grain sizes increase exponentially with annealing temperature up to 300 °C, the lowest temperature for which grains are observed to be as wide as the entire nanowire diameter. This exponential growth is typical of temperature mediated 3-dimensional grain growth. For temperatures above 300 °C, grain sizes increase linearly with annealing temperature. A slower increase in grain growth rate is expected here despite the use of higher temperatures due to the spatial confinement of the nanowire walls, i.e., grains can now only grow in the axial nanowire directions. Further grain growth across the nanowire diameter is not possible. Finally, while Fig. 2 finds that Te is also lost as a function of annealing temperature, the relatively small changes in composition are unlikely to have a significant affect on grain growth.
Average volume of smallest and largest grains for each of the TEM images in Fig. 4. Data from 25 to 300 °C are fit to an exponential function. Data from 300 to 500 °C are fit to a linear function.
TE transport in Bi2Te3 and its alloys with Bi2Se3 is highly anisotropic, with transport parallel to the basal planes of the rhombohedral crystal structure being optimal for zT.Reference Fleurial, Gailliard and Triboulet31,Reference Medlin and Snyder32 Hence, an examination of the XRD data for the development of preferential crystallographic alignments with annealing is warranted. Figure 6 expands the XRD patterns for the 200–500 °C annealed samples, focusing only on the (110) XRD peak, now presented on a linear axis. Both the intensity and sharpness of this peak increase with annealing up to 400 °C, along with a subtle shift in peak position. This is important since a preferential (110) texture aligns the basal planes parallel to the wire axis. This shift in peak position represents a small decrease in lattice spacing from 2.187 to 2.181 Å for anneals from 200 to 400 °C, respectively, toward the ideal known value of 2.175 Å for Bi2Te3 at 2θ = 41.48°, consistent with the improving crystallinity of the nanowires. Annealing at 500 °C causes a significant change in the (110) peak position. However, this is not caused by a change in crystallinity, but rather by the developing coexistence of the Bi-rich phase Bi4Te3 along with Bi2Te3. The (110) peak of Bi4Te3 is at 2θ = 40.49°, corresponding to a lattice spacing of 2.226 Å. The measured 2θ = 40.9° is nearly midpoint between that for the (110) XRD peaks from both material phases. A similar shifting of 2θ is observed for all of the XRD peaks these two phases share in common, as labeled in Fig. 3(e). This may be the result of these two phases being intricately mixed within individual grains as stacking fault-like defects, as previously observed for other Bi–Te mixed phase compounds.Reference Medlin and Snyder32,Reference Sharma, Lima Sharma, Medlin, Morales, Yang, Barney, He, Drymiotis, Turner and Tritt33
Expanded view of the (110) orientation from XRD patterns shown in Fig. 3 for the annealed samples plotted on a linear scale.
The improvement in Bi2Te3 crystalline quality can be further quantified by measuring the sharpness of the XRD peaks. This analysis is shown in Fig. 7. The full width half maximum (FWHM) of an XRD peak decreases with both improving crystalline quality and increasing grain size. The left axis provides a scale for the FWHM of the (110) XRD peak as a function of annealing temperature. TEM of as-deposited nanowire samples found very small grain sizes; hence, it is not surprising that the (110) XRD peak is very broad with FWHM > 1°. In fact, observation of the actual XRD pattern from Fig. 3(a) shows that the crystalline quality of the as-deposited samples is likely even worse than this simplistic assessment, given that the breadth of the peak is >10°. The FWHM of the (110) XRD peak decreases monotonically over the entire annealing temperature range studied, consistent with observed grain growth from TEM. However, taken together with the subtle shift in 2θ toward the ideal lattice spacing, the reduction in FWHM is likely also due to the overall improving crystalline quality of the nanowires resulting from thermal annealing.
Analyses of the XRD patterns as a function of annealing temperature. The solid line represents the FWHM of the (110) diffraction peak (left axis). The dashed line is the LF for the (110) orientation (right axis). LF at 500 °C is labeled with a ‘?’ due to its complex nature as a mixture of Bi2Te3 and Bi4Te3 phases.
A Lotgering analysis of the XRD data provides insight into the degree of (110)-oriented texture enhancement with thermal annealing.Reference Lotgering34,Reference Furushima, Tanaka, Kato and Uematsu35 Such an analysis has been used previously to determine the texture of Bi–Sb–Te composites that were sintered and pressed from nanopowders.Reference Ceresara, Fanciulli, Passaretti and Vasilevskiy36 A Lotgering factor (LF) = 1 indicates complete texturing with no other discernable orientations. Conversely, if the intensities from a given orientation compared to the total intensities of the other peaks are the same as a random powder sample, then LF = 0. The evolution of LF as a function of annealing temperature is a bit more complex but with some explanation provides meaningful interpretation. The right axis of Fig. 7 provides a scale for LF. While the as-deposited nanowires have a relatively high LF = 0.78, representing a high degree of (110) orientation, recall that these materials consist of very small 5–10 nm grains with poor crystalline quality. Annealing the nanowire arrays to 200 °C results in a significant drop in LF to 0.47, implying that other grain orientations have grown into the nanowires; however, as noted from the FWHM analysis, all of these grains have higher crystalline quality than those in as-deposited samples. The preferred (110) orientation increases with annealing temperature to 400 °C, with LF maximizing at 0.83. Further annealing to 500 °C shows a drop off in LF; however, interpretation is more complex due to the significant mixing of the Bi2Te3 and Bi4Te3 phases that share many of the same peaks. As such, this data point is circled and labeled with a question mark in Fig. 7.
Although it is possible to calculate the LF for XRD patterns reported in the literature, it is difficult to make direct comparisons to our results due to significant differences in the actual materials. For instance, Sander et al.Reference Sander, Gronsky, Sands and Stacy28 show the diffraction patterns for 75-nm-diameter Bi2Te3 arrays, similar to our diameters, both as-grown by ECD in an aqueous bath (LF ∼ 0.69) and following a 3 h 400 °C anneal (LF ∼ 0.58). However, these arrays were not doped with Se, and annealing was performed with the nanowires still embedded in the AAO matrix. This confinement during the annealing process likely leads to stress-induced damage that is reflected from the reduced LF. In another study from Trahey et al.,Reference Trahey, Becker and Stacy11 35-nm-diameter arrays of Bi2Te3 nanowires grown by ECD have excellent LFs of 0.93 and 0.77 at deposition temperatures ∼2 and 22 °C, respectively. However, it must be noted that these reported nanowires were significantly Te-rich with a composition of Bi2Te3.7; hence it is unclear how this affects the resulting crystalline structure of the material. Furthermore, such a Te-rich material is unlikely to provide high-performance TE properties. We are currently performing transport property measurements on 75-nm-diameter Bi2Te3 nanowire arrays prepared at temperatures ranging from 200 to 400 °C, so that correlations can be made between compositional, structural, and TE properties.
V. SUMMARY
This paper presents detailed structural and compositional analyses of Bi2(Te1−xSex)3 free-standing nanowire arrays on Si substrates that were electrochemically deposited near room temperature into AAO nanopore templates formed on Si(100) substrates, followed by thermal annealing from 200 to 500 °C. While demonstrating a preferred (110) orientation, the room-temperature as-deposited nanowires consisted of small grains with poor overall crystalline quality. Grain sizes, crystalline quality, and (110) texturing all improved monotonically with increasing annealing temperatures up to 400 °C. However, Te loss also increased, along with the presence of second phase materials. Interestingly, the Se composition held relatively steady with annealing up to 400 °C, suggesting that Se doping can be controlled during nanowire deposition, rather than via a more complex postcrystallization doping process. Further annealing to 500 °C removed all the Se, depleted Te by 20% from the room temperature deposition composition, and yielded nanowires consisting of Bi2Te3 mixed with significant amounts of the Bi-rich Bi4Te3 phase. These studies suggest that Bi2(Te1−xSex)3 nanowire arrays annealed at temperatures between 200 and 400 °C should have greatly improved electrical transport properties compared to the as-deposited materials at room temperature, resulting in higher TE zT.
ACKNOWLEDGMENTS
We thank Don Overmyer for assisting with the thermal annealing and x-ray diffraction experiments. Supported by the Laboratory Directed Research and Development program at Sandia National Laboratories. Sandia National Laboratories is a multiprogram laboratory managed and operated by Sandia Corporation, a wholly owned subsidiary of Lockheed Martin Company, for the U.S. Department of Energy's National Nuclear Security Administration under Contract DE-AC04-94AL85000.