Implications
The present study of reporting data about the colour of different fat tissues of North African meat breeds under stall- and pasture-feeding systems aims to apply methods developed in European temperate areas to authenticate lamb meat from grassland-based systems under North African conditions. This work has confirmed the importance of perirenal fat colour in feeding systems discrimination, spotted the caudal fat as a better classification tool and propose further researches to bear out this finding on a larger number of fat-tailed lambs. These initial results may increase the meat market value by knowing its feeding origin.
Introduction
Since the Bovine Spongiform Encephalopathy crisis, research interest in the reconstruction of animal diet from the meat has increased. Several factors have contributed to this interest: (i) the consumer demand for guarantee about the animal diet and (ii) the convection that the animal diet strongly influences the meat quality (Rousset-Akrim et al., Reference Rousset-Akrim, Young and Berdague1997; Hajji et al., Reference Hajji, Joy, Ripoll, Smeti, Mekki, MoliniGahete, Mahouachi and Atti2016). Several studies have reported differences between lambs raised indoor with concentrates and those raised on pastures. The main differences are carcass fatness (Atti and Abdouli, Reference Atti and Abdouli2001), meat flavour (Rousset-Akrim et al., Reference Rousset-Akrim, Young and Berdague1997), meat lipid content and fatty acid composition (Majdoub-Mathlouthi et al., Reference Majdoub-Mathlouthi, Said and Kraiem2015; Hajji et al., Reference Hajji, Joy, Ripoll, Smeti, Mekki, MoliniGahete, Mahouachi and Atti2016) and meat and fat colour (Priolo et al., Reference Priolo, Prache, Micol and Agabriel2002b; Hamdi et al., Reference Hamdi, Majdoub-Mathlouthi, Picard, Listrat, Durand, Znaidi and Kraiem2016). Based on these differences, several methods of discrimination were developed. These methods are based on (i) quantifying molecular or atomic tracers such as carotenoids, polyphenols, fatty acids, volatile compounds and isotopes, whose presence or proportions in meat are characteristic of the diet (Prache et al., Reference Prache, Priolo, Tournadre, Jailler, Dubroeucq, Micol and Martin2002), or (ii) data integration such as spectral methods and recently functional genomics. Spectral methods are based on visible spectrum analysis. Indeed, the differences in the composition of meat related to differences in the animal diet cause changes in its optical properties that can be used in return to authenticate the ingested diet. Grazing has often been associated with a decreased lightness of the meat (Priolo et al., Reference Priolo, Micol, Agabriel, Prache and Dransfield2002a) because of a higher myoglobin content (Renerre, Reference Renerre1981) resulting in darker meat, and beyond this direct effect of the diet, because of indirect effects linked to the animal’s age, meat ultimate pH (Renerre, Reference Renerre1986), intramuscular fat content and physical activity (Majdoub-Mathlouthi et al., Reference Majdoub-Mathlouthi, Said and Kraiem2015). Meat from grazing animals has also been associated with an increased yellowness of the fat (Priolo et al., Reference Priolo, Prache, Micol and Agabriel2002b; Ripoll et al., Reference Ripoll, Joy, Muñoz and Albertí2008) because of an increased carotenoid intake level (Prache and Thériez, Reference Prache and Thériez1999; Prache et al., Reference Prache, Priolo and Grolier2003a; Dian et al., Reference Dian, Andueza, Barbosa, Amoureux, Jestin, Carvalho, Prado and Prache2007a).
Carotenoid pigments amount has been proposed as potential tracers of the feed type, and Prache and Thériez (Reference Prache and Thériez1999) successfully pioneered the use of the visible light reflectance spectrum of fat carotenoid pigments to distinguish between pasture-fed (P) and stall-fed (S) lambs. Their method was widely diffused because it is rapid, non-invasive and can be easily implemented in the abattoir with a portable spectrocolorimeter, and their results were later confirmed by several studies (Prache et al., Reference Prache, Priolo, Tournadre, Jailler, Dubroeucq, Micol and Martin2002 and Reference Prache, Priolo and Grolier2003a and Reference Prache, Priolo and Grolier2003b; Dian et al., Reference Dian, Chauveau-Duriot, Prado and Prache2007b; Prache et al., Reference Prache, Larue, Ballet, Jailler, Coustet, Teuma, Pourrat and Andueza2010). However, these studies were made with European bovine breeds and they compared lambs ingesting diets with contrasted carotenoid contents: concentrate feed for (S) lambs and good quality pastures maintained at a vegetative phase for (P) lambs. Knowing that the carotenoid content in the plant decrease with water shortage and woody stage of the plant (Mark and Dean, Reference Mark and Dean2005), there is therefore a need to study fat colour and test the reliability of this method using other breeds reared in less abundant pasture, growing in lands dryer than European areas. Moreover, the cited studies used essentially perirenal fat and in some of them the subcutaneous fat. Testing the reliability of discrimination using other fat depots may give new information. In fact, different adipose tissues have different allometry and different metabolic activity (Atti and Bocquier, Reference Atti and Bocquier1999; Huang et al., Reference Huang, Andueza, Oliveira, Zawadzki and Prache2015). These divergences induce differences in the size of adipose cells (Hood and Allen, Reference Hood and Allen1997), which may have an effect on the reflectance spectrum.
The aims of this study were to (i) determine the effects of the regimen and the breed on the colour of perirenal, subcutaneous and caudal fat and (ii) test the reliability of using the visible spectroscopy applied on perirenal, subcutaneous and caudal fats, to discriminate between P and S lambs when applied on north African lamb breeds and in less favorable pasture conditions than European ones.
Materials and methods
The experiment started in April and was carried out on the experimental farm Lafereg of the Crop Center of Beja in the subhumid region of Tunisia; the annual rainfall was 650 mm. All procedures employed in this study meet ethical guidelines ensuring animal welfare and adhere to Tunisian legal requirements (the Livestock Law No. 2005-95 of 18 October 2005, Chapter II; Section 1 and Section 2 relative to the slaughter of animals).
Animals, diets and slaughter procedures
A total of 36 weaned male lambs from 3 breeds were used: 12 from the fat-tailed Barbarine (BB) breed, 12 from the thin-tailed Queue Fine de l’Ouest (QFO) and 12 from the thin-tailed Noire de Thibar (NT) (Rekik et al., Reference Rekik, Aloulou, Ben Hamouda and Iňigeuz2006). Lambs were 4 months old and weighed 20.3 ± 1.9 kg at the beginning of the experiment. Before weaning, all lambs were reared under similar nutritional management. Ewes were reared on a natural pasture during 6 h daily and received indoor 500 g/day per ewe a commercial concentrate (80% barley, 17% soya bean meal and 3% of mineral vitamin supplement (MVS)) until drying.
At weaning, lambs from each breed were randomly allocated on the basis of BW to one of two groups, P v.S. The three S groups were raised in individual boxes and fed increasing amounts of farmer concentrate (72% barley, 25% faba bean and 3% MVS) and oat hay. In fact, the trial started with a diet composed of 300 g/day per lamb of concentrate and 300 g/day per lamb of oat hay, and then feed amounts were increased depending on the requirement increase to reach 600 g/head per day of concentrate and 500 g/day per lamb of oat hay. In Pasture, lamb groups were reared together on natural pasture and grazed for 6 h daily (from 10 h to 16 h) a plot of 2500 m2. The grazed flora was composed of 45% grass, 14% legumes and 41% other species (mainly 30% thistle). They received indoor, oat hay in similar quantity as the S lambs. Chemical composition of diet ingredients is reported in Table 1. After a rearing period of 60 days, all lambs were transferred to the slaughterhouse. They were subjected to a fasting period of 16 h. Just before slaughter, lambs were weighed and slaughter body weights (SBWs) were recorded; they were then slaughtered according to Halal procedure. The carcasses were placed in a chiller in the dark at 4°C for 24 hours.
Chemical composition of concentrate, oat hay and natural pasture used in the experimental diets (% DM) fed to lambs

Feed intake and diet chemical composition
For the S group, feed intake was recorded daily by weighing offered and refused quantities of oat hay and concentrate. For the P group, oat hay intake was determined by weighing offered and refused quantities daily. In Pasture, the biomass availability was estimated according to the dry-weight-rank method (Tothill et al., Reference Tothill, Hargreaves, Jones and Mcdonald1992) at the beginning and the end of the trial and the biomass intake was estimated based on the palatability of the dominant species. Samples of hay, concentrate and grazed flora were dried (50 °C), ground (1-mm mesh screen) and analysed for DM (105 °C until constant weight), N and ash according to AOAC (1990). Crude fibre were analysed according to the methods of Goering and Van Soest (Reference Goering and Van Soest1970), using an ANKOM220 fibre analyser (ANKOM Technology Corp., Macedon, NY, USA).
Sample’s collection
Cold carcass was weighed 24 h post-mortem. Testes, kidneys and perirenal fat were taken off and weighed. Carcasses were cut according to Colomer-Rocher et al., (Reference Colomer-Rocher, Dumont and Murillo1972). Left legs were dissected into subcutaneous, intermuscular, pelvic fats, muscle, bone and waste. Similarly, the tails of BB carcasses were dissected into tail (bone + muscle) and tow lobes of caudal fat. The tissues composing both cuts (leg and tail) were weighed, then 20 g of subcutaneous and caudal fats were taken for colour measurement. The subcutaneous fat was taken from the upper part of the leg in continuity with the saddle fat. Caudal fat samples were taken from the left lobe. Perirenal fat was also weighed and stored for colour measurement. Samples of different tissues were packed in aluminium foil to keep them out of the light and then under vacuum in plastic bags and stored in a conventional freezer at −20°C until analysis, performed within 5 months after slaughter.
Visible reflectance spectrum of fat tissues and of semi-tendinous muscle
Colour parameters of perirenal, subcutaneous and caudal fats and their reflectance spectrums were measured at wavelengths between 400 and 700 nm, using a portable MINOLTA CM-600d spectrocolorimeter (illuminant D65, observer angle 10°, Minolta France S.A., Carrieres sur Seine, France). The spectrocolorimeter measures the proportion of light reflected at 10 nm intervals, records the corresponding reflectance spectrum and gives the colour parameters lightness (L), redness (a*) and yellowness (b*). The spectrocolorimeter was equipped with a protective glass visor that was cleaned after each measurement. The measured area diameter was 8 mm. Before the measurements, the spectrocolorimeter was calibrated using the white ceramic plate and samples were thawed at room temperature (20°C to 22°C) for approximately 2 h.
During the fat colour measurements, in order to minimise the error related to operating conditions between adipose tissue, perirenal and caudal fats were cut into pieces of 1 cm deep, since the thickness of the subcutaneous fat samples did not exceed 1 cm. The knife was used to have a plane surface to ensure perfect adherence of fat to the eye of the apparatus. Measurements were taken in a way to avoid connective tissue and visible blood vessels. Five replicates of the measurement were made for all samples.
Methods used to distinguish pasture-fed from stall-fed lambs
In order to classify the fat samples according to FS (18 P v. 18 S lambs) via analysis of reflectance spectrum, two methods were used: Method 1 (M1) W450–510 takes in consideration the reflectance spectrum of the adipose tissues in the zone of light absorption by carotenoids (450 to 510 nm). In this method, W450–510 (M1), an index quantifying light absorption by carotenoid pigments (I450–510), was calculated as proposed by Prache and Thériez (Reference Prache and Thériez1999) using to the following formula:
 $$ \eqalign{{{\rm{I}}_{450 - 510}} = {\rm{ }}\big[ \big( {{\rm{T}}{{\rm{R}}_{450}}/2} \big) + {\rm{T}}{{\rm{R}}_{460}} + {\rm{T}}{{\rm{R}}_{470}} + {\rm{T}}{{\rm{R}}_{480}} + {\rm{T}}{{\rm{R}}_{490}} \cr \,\,\,\,\,\,\, + {\rm{T}}{{\rm{R}}_{500}} + \big( {{\rm{T}}{{\rm{R}}_{510}}/2} \big) \big]{\rm{ \times}}10}$$
I450–510 was averaged over the five replicates and the absolute value of the mean integral (AVMI450–510) was used in statistical analysis.
In Method 2 (M2) W400 to 700, the reflectance spectrum was further explored, using the full reflectance data set at wavelengths between 400 and 700 nm. The reflectance values (R), calculated as the area integral between 400 and 700 nm, were averaged over the five replicates and converted into log (1/R).
Statistical analysis
Colour coordinates of subcutaneous, perirenal and caudal fats and AVMI450–510 of subcutaneous fat underwent analysis of variance using the GLM procedure of the Statistical Analysis Systems (1999) software package to compare fending systems, breeds and the interaction between both factors. The pairwise comparison test was used to compare the breeds two by two. Data related to caudal fat were subjected to one factor (feeding systems) analysis of variance using the GLM procedure. Variances of AVMI450–510 of perirenal fat and both redness (a*) and AVMI450–510 of caudal fat were stabilised using the natural logarithmic transformation, or otherwise the data was analysed using non-parametric statistics (Kruskall and Wallis test and Mann-Whitney U test). The relationship between redness and weight of different fats were studied using correlation procedure of the Statistical Analysis Systems (1999) software package.
In (M1), AVMI450-510 underwent a linear discriminant analysis carried out using the Minitab software v.13 (Minitab Inc., Paris), as applied by Dian et al. (Reference Dian, Chauveau-Duriot, Prado and Prache2007b). The discriminant analysis was followed by a cross-validation procedure. The results of this procedure were expressed as correct classification rates.
In M2, log (1/R) underwent a multivariate discriminative analysis using a partial least squares discriminative analysis (PLS-DA) approach to classify the fat samples according to FS, performed by Win ISI II v 1.6 software (Infrasoft International, Port Matilda, PA, USA). PLS-DA consists in a PLS regression where the dependent variable is a set of categorical variables describing the different classes of observations. PLS-DA was used as a classification method in which each sample was assigned a dummy dependent variable-Y according to FS (1 for S lambs, 2 for P lambs), using a cut-off value of 1.5 to classify samples according to the feeding treatment. Sample assignment to a feeding system was made on the basis of the predicted Y-value; samples with value inferior to 1.5 are attributed to S group and samples with Y-value superior to 1.5 are attributed to P group. A principal component analysis (PCA) performed beforehand was used to rank the reflectance spectra from each FS, according to the Mahalanobis distance (H) to the average reflectance spectrum in order to detect outlier samples (H > 3). No outliers were found. Applying this procedure to samples from both FS (P, S) produced a model. The model was tested using a cross-validation procedure in which 8 randomly chosen samples were temporarily removed from the initial data set to be used for validation (i.e. about a quarter of all 36 samples). The PLS-DA model was based on the other samples (calibration samples) and used to classify the validation samples. This procedure was repeated four times, that is, until all data set samples had been used through the procedure validation. The model was not deposited in an official repository. The results of the PLS-DA analysis were expressed as correct classification rates. The proportion of correctly classified carcasses was analysed using the CATMOD procedure of the SAS (1999) software using a three-factor model (feeding systems, spectral method and fat tissue), with repeated measures on the last factor (Prache et al, Reference Prache, Huang and Andueza2018). In all statistical analyses, the individual animal was taken as the statistical unit.
Results
Feed intake, growth performance and adipose tissues weights
Indoor, lambs consumed the same amounts of concentrate (P > 0.05) with an average of 570 g; however, the oat hay intake was higher (P < 0.01) for NT breed (448 g) than for BB and QFO breeds (437 g). For pasture groups, the stocking rate was 72 lambs/ha, allowing an average intake of grass of about 560 g DM as estimated by Bouazizi and Majdoub (Reference Bouazizi and Majdoub1999) (22g DM/kg BW), in similar conditions. This average intake was covered by the forage biomass effectively available in DM per day per lamb, which was estimated to be 1.2 and 2 kg at the beginning and the end of the experiment, respectively, and this without including one-third of the available biomass that was composed of thistles not consumed by lambs. Besides, the oat hay average intake of the P groups was 440 g of DM.
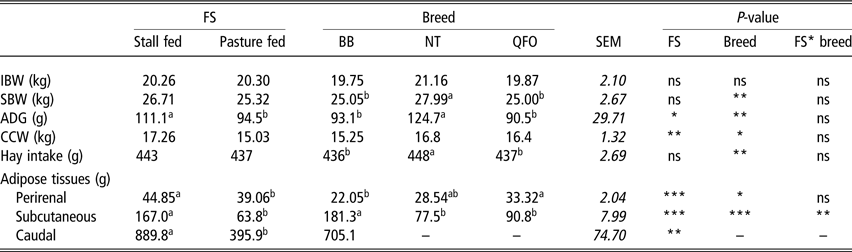
Lambs reared on pasture and hay had lower average daily gain (ADG) (P < 0.05) than those reared with concentrate (111 v. 94 g, Table 2). The NT breed had higher SBW (P < 0.01) and ADG (27.99 kg; 125 g, Table 2) than both other breeds. Besides, both FS and breed affected fats weight. In fact, perirenal, subcutaneous and caudal fats were heavier for S than for P lambs (P < 0.001; P < 0.001 and P < 0.01, Table 2). Regarding breed effect, the BB breed had more subcutaneous fat than both thin-tailed breeds (P < 0.05, Table 2), with a significant interaction between breed and FS, according to the following order: BB-S > QFO-S > NT-S > QFO-P > BB-P > NT-P. However, thin-tailed breeds deposited more perirenal fat than the fat-tailed BB breed (P < 0.001).
Effect of feeding system (FS) and breed on growth performance of lambs and adipose tissues weight

BB = Barbarine; QFO = Queue Fine de l’Ouest; NT = Noire de Thibar; SEM = standard error mean; IBW = initial body weight; SBW = slaughter body weight; ADG = average daily gain; CCW = cold carcass weight.
a,bValues within a row with different superscripts differ significantly at P < 0.05; ns: P > 0.05; *P < 0.05; **P < 0.01; ***P < 0.001.
Colour of fat tissues
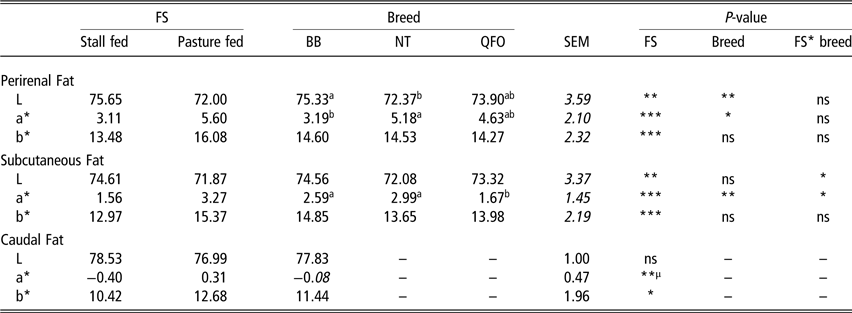
Data concerning colour of fat tissues are reported in Table 3. For all fat tissues, yellowness was higher for P than for S lambs (P < 0.001, P < 0.001 and P < 0.05 for perirenal and subcutaneous and caudal fat, respectively). The lightness of perirenal and subcutaneous fats was higher for S than for P lambs, while caudal fat had similar lightness for both feeding systems (P < 0.001). For all fat tissues, redness was higher for P than for S lambs (P < 0.01, P < 0.01 and P < 0.01 for perirenal and subcutaneous and caudal fat, respectively).
Effect of feeding system (FS) and lamb’s breed on fat colour

BB = Barbarine; QFO = Queue Fine de l’Ouest; NT = Noire de Thibar; SEM = standard error mean; L = lightness; a* = redness; b* = yellowness.
μP-value was determined after natural logarithmic transformation; a,b Values within a row with different superscripts differ significantly at P < 0.05; ns: P > 0.05; *P < 0.05; **P < 0.01; ***P < 0.001.
There were no between breed difference in yellowness of perirenal and subcutaneous fat (P > 0.05). There were no between breed difference in lightness of subcutaneous fat; however, the perirenal fat had higher lightness for BB than other breeds (P < 0.001, Table 3). The redness of perirenal fat was higher (P < 0.01) for NT than for BB lambs (5.18 and 3.19, respectively), with intermediate value for QFO lambs (4.63). The redness of subcutaneous fat was similar (P < 0.01) between NT and BB lambs (2.89) and higher than QFO ones (1.67).
There were no interactions between breed and FS for colour coordinates of perirenal fat. The interaction between both experimental factors was significant (P ≤ 0.05) for lightness and redness of subcutaneous fat. The gradients of redness and lightness of different groups were in the following order: NT-P > BB-P > QFO > NT-S > QFO-S > BB-S and BB-S > NT-S > QFO-P > QFO-S > BB-P > NT-P, respectively. Redness indexes (a*) of different fats were negatively correlated to their weights. These correlations were significant for subcutaneous (r = −0.84; P = 0.002) and caudal fat (r = −0.79; P = 0.004) of BB breed and for perirenal (r = −0.73; P = 0.006) and subcutaneous (r = −0.81; P = 0.002) fat of NT breeds, but only for perirenal fat of QFO breed (r = −0.73; P = 0.001).
Reflectance spectrum of the fat
Reflectance spectrum of the fat at wavelengths between 450 and 510 nm
The effect of the FS on AVMI450–510 of perirenal, subcutaneous and caudal fat as well as their mean values and the ranges of their variation are reported in Table 4. Although FS had no effect on the AVMI450–510 of perirenal, subcutaneous and caudal fat, the AVMI450–510 of perirenal fat tend to be higher for P than for S lambs (P = 0.08). Using M1 on perirenal, subcutaneous and caudal fats allowed for the correct classification of 52.9%, 56.3% and 60.0% of P lambs and 70.6%, 56.3% and 83.3% of S lambs, respectively. The effect of the breed on AVMI450–510 of perirenal and subcutaneous fat as well as their mean values and the ranges of their variation are reported in Supplementary Table S1. Statistical analyses using ANOVA procedure revealed that breed had no effect on the AVMI450–510 of perirenal and subcutaneous fat and there was no interaction between breed and FS for AVMI450–510 of both fat tissues.
Effect of feeding system on the mean values of AVMI450–510 of the three fats from the three lambs breed (perirenal, subcutaneous and caudal) and the ranges of their variation

AVMI450–510: The absolute value of the mean integral between 450 and 510 nm.
μ P-value was determined after natural logarithmic transformation; μ μ P-value was determined using non-parametric test; ns: P > 0.05.
Reflectance spectrum of the fat at wavelengths between 400 and 700 nm. The M2 used the whole reflectance spectrum data at wavelengths between 400 and 700 nm. For perirenal fat, the first two factors of the PLS-DA model explained 57.0% and 33.5% of variability, respectively. The highest loading was situated around 545 to 585 nm and around 400 to 430 nm for PC1; for PC2, the highest loading was situated around 415 to 435 nm and around 450 to 510 nm (Figure 1). For subcutaneous fat, the first two factors of the PLS-DA model explained 88.5% and 8.1% of variability. The highest loading was situated around 400 to 430 nm for both PC1 and PC2 (Figure 2).
Loadings for the first (PC1) and the second (PC2) principal component axes for perirenal fat of lambs.

Loadings for the first (PC1) and the second (PC2) principal component axes for subcutaneous fat of lambs.

For caudal fat, the first two factors of the PLS-DA model explained 51.9% and 34.5% of variability. The highest loading was situated around 400 to 410 nm and around 540 to 580 nm for PC1 and around 410 to 420 nm and around 460 to 490 nm for PC2 (Figure 3). The PLS-DA analysis of perirenal, subcutaneous and caudal fat data correctly classified 76.4%, 75.0% and 80.0% of P lambs and 82.0%, 76.5% and 100% of S lambs, respectively (Figure 4).
Loadings for the first (PC1) and the second (PC2) principal component axes for caudal fat of lambs.

Proportion of correctly classified lambs in each feeding regimen (pasture-feeding (P) black symbols ▪ and stall-feeding (S) white symbols □. using Method 1 (M1: Integral value I450–510) and Method 2 (M2: Full reflectance spectral data set at wavelengths between 400 and 700 nm) applied on subcutaneous, perirenal and caudal adipose tissues.

Comparison between both reflectance methods applied on fat. Using all the reflectance spectrum data at wavelengths between 400 and 700 nm (M2) resulted in a higher performance for discriminating between P and S lambs (P < 0.001) than using only the reflectance spectrum data at wavelengths ranging from 450 to 510 nm (M1). Taking both sites (perirenal and subcutaneous fat) and both FSs (pasture-feeding and stall-feeding) together, the overall proportion of correctly classified lambs was actually 52.2% and 72.9% for M1 and M2, respectively. The proportion of correctly classified lambs also differed between FSs (60.4% and 67.7% for P and S lambs, respectively, P < 0.005) and measurement sites (71.8% and 57.8% for perirenal and subcutaneous fat, respectively, P < 0.001). There were no significant interactions between these experimental factors.
Discussion
Feed intake and growth performance
The higher ADG of S lambs could be explained by higher energy and nitrogen intake (Majdoub-Mathlouthi et al., Reference Majdoub-Mathlouthi, Said and Kraiem2015; Hamdi et al., Reference Hamdi, Majdoub-Mathlouthi, Picard, Listrat, Durand, Znaidi and Kraiem2016). In fact, although lambs form both, FS ingested the same amount of feeds (1 kg DM), but the concentrate portion provides more energy and protein than the ingested grass (16.7% v. 14.4%). Higher energetic balance of S lambs resulted in heavier fat depots in comparison to P lambs. These results are in accordance with the findings of Hamdi et al. (Reference Hamdi, Majdoub-Mathlouthi, Picard, Listrat, Durand, Znaidi and Kraiem2016) when comparing carcass fatness of BB lambs reared indoor or in pasture. Moreover, physical activity during grazing needs higher energy expenditure, which could explain the lower ADG and carcass fatness of P lambs (Priolo et al., Reference Priolo, Micol, Agabriel, Prache and Dransfield2002a; Majdoub-Mathlouthi et al., Reference Majdoub-Mathlouthi, Said and Kraiem2015). According to breed difference, the superiority of NT breed in growth rate is related to the breed vocation; in fact, NT breed is a meat breed having a higher feed conversion rate and consequently higher growth rate than both rustic breeds (Atti and khaldi, Reference Atti and Khaldi1989; Rekik et al., Reference Rekik, Aloulou, Ben Hamouda and Iňigeuz2006). Furthermore, relevant differences in fats’ weight between thin- and fat-tailed breeds is in agreement with the findings of Hajji (Reference Hajji2010) working on the same breeds and Kashan et al. (Reference Kashan, Manafi Azar, Afzalzadeh and Salehi2005) on Asiatic thin- and fat-tailed breeds.
Perirenal, subcutaneous and caudal fat colour
Higher fat yellowness for P than for S lambs for all fat depots is due to the carotenoids pigments deposited in adipose cells as a consequence of pasture intake, whereas concentrate is a poor source of carotenoids (Prache et al., Reference Prache, Priolo and Grolier2003a). This is in line with previous studies performed in European countries and comparing diets, including fresh forage to diets based on concentrate (Priolo et al., Reference Priolo, Prache, Micol and Agabriel2002b; Ripoll et al., Reference Ripoll, Joy, Muñoz and Albertí2008). Comparing, BB lambs (6 months) reared indoor or on natural rangeland improved by Medicago arborea in a semi-arid region, Hamdi et al. (Reference Hamdi, Majdoub-Mathlouthi, Picard, Listrat, Durand, Znaidi and Kraiem2016) found that, in contradiction to our results, FS had no effect on the yellowness of subcutaneous fat. This discrepancy of results could be explained by the dryer climatic conditions and the woody composition of shrubs in comparison to the vegetative grass in subhumid regions. Besides, the older age of lambs used by Hamdi et al. (Reference Hamdi, Majdoub-Mathlouthi, Picard, Listrat, Durand, Znaidi and Kraiem2016) increased the effect of the before weaning pasture on carotenoids stored in fat.
However, Ripoll et al. (Reference Ripoll, Albertí and Joy2012) found that lightness of perirenal and subcutaneous fat was higher for pasture than S lambs, whereas Priolo et al. (Reference Priolo, Prache, Micol and Agabriel2002b) and Dian et al. (Reference Dian, Andueza, Barbosa, Amoureux, Jestin, Carvalho, Prado and Prache2007a) had not found differences in perirenal fat lightness between P and S lambs. Besides, Carrasco et al. (Reference Carrasco, Panea, Ripoll, Sanz and Joy2009) and Hamdi et al. (Reference Hamdi, Majdoub-Mathlouthi, Picard, Listrat, Durand, Znaidi and Kraiem2016) found that subcutaneous fat lightness was similar between FSs. So, the influence of diet on fat lightness remains unclear.
Regarding perirenal and subcutaneous fat redness, higher values recorded for lambs reared outdoor could be linked to higher respiratory and kidney activity (Majdoub-Mathlouthi et al., Reference Majdoub-Mathlouthi, Said and Kraiem2015), which reduced perirenal fat weight and increased its vascularisation. However, Ripoll et al. (Reference Ripoll, Albertí and Joy2012) found that grazing leads to lower redness of subcutaneous fat than concentrate feeding. Grazing fresh alfalfa instead of natural pasture or dehydrated alfalfa is the main reason for fat redness decrease. Priolo et al. (Reference Priolo, Prache, Micol and Agabriel2002b), Dian et al. (Reference Dian, Andueza, Barbosa, Amoureux, Jestin, Carvalho, Prado and Prache2007a), Carrasco et al. (Reference Carrasco, Panea, Ripoll, Sanz and Joy2009) and Hamdi et al. (Reference Hamdi, Majdoub-Mathlouthi, Picard, Listrat, Durand, Znaidi and Kraiem2016) did not find differences in redness of both subcutaneous and perirenal fat between lambs grazing natural pasture and concentrate-fed lambs. In the studies cited earlier, the growth rate of lambs and the pasture composition were variable, which made it difficult to conclude about factors influencing perirenal and subcutaneous fat redness.
The between breeds differences in redness of perirenal and subcutaneous fats may be due to the differences in fat tissues’ weight (Table 2; Atti et Khaldi, Reference Atti and Khaldi1989; Hajji, Reference Hajji2010), leading to different levels of vascularisation. In fact, the brownish intensity of fat depends on the proportion of mitochondrial iron, the presence of small blood vessels and the size of lipid droplets (Gesta et al., Reference Gesta, Tseng and Ronald Kahn2007). The fat becomes whiter during aging, fattening and adaptation to low energy metabolism. However, it is browner with high energy mobilisation and during early fat anabolism (Gesta et al., Reference Gesta, Tseng and Ronald Kahn2007). The difference in perirenal fat redness between thin- (QFO and NT) and fat-tailed (BB) breeds was in accordance with the between-breed differences in this fat weight (Atti and Khaldi, Reference Atti and Khaldi1989; Kashan et al., Reference Kashan, Manafi Azar, Afzalzadeh and Salehi2005). These assumptions were confirmed and strengthened through the negative correlations between redness of different fats and their weights. Besides, lightness values of subcutaneous fat of different groups goes in pair with their weights (BB-S>QFO-S>NT-S>QFO-P >BB-P>NT-P) and were inversely ordered in comparison to redness values. Higher redness of subcutaneous fat of P lambs from NT and BB breeds is related to the fat weight and consequently its vascularisation (Gesta et al., Reference Gesta, Tseng and Ronald Kahn2007). In fact, for the NT as a thin-tailed breed regardless the FS, its subcutaneous fat has no major growth rate (Atti and khaldi Reference Atti and Khaldi1989; Hajji, Reference Hajji2010). Besides, for fat-tailed BB breed, even though the subcutaneous fat is the heaviest fat depot, the limited energy supply in pasture limits the growth of all adipose tissues (Hamdi et al., Reference Hamdi, Majdoub-Mathlouthi, Picard, Listrat, Durand, Znaidi and Kraiem2016) and specially the subcutaneous fat which has a tardy development (Atti et khaldi, Reference Atti and Khaldi1989; Atti et Bouquier, Reference Atti and Bocquier1999; Huang et al., Reference Huang, Andueza, Oliveira, Zawadzki and Prache2015), probably corresponding to the meadows impoverishment.
Reflectance spectrum
Reflectance spectrum at wavelengths between 450 and 510 nm
The modest number of lambs involved in this work prevented the detection of difference in AVMI450–510 of perirenal between lambs from both FS. Increasing significantly, the lambs’ number would reveal a net difference in AVMI450–510 of perirenal fat between S and P lambs (Devincenzi et al., Reference Devincenzi, Prunier, Meteau and Prache2019). Previous studies observed significant differences in AVMI450–510 of perirenal fat between P and S lambs, but generally using a higher number of lambs (Prache and Theriez, Reference Prache and Thériez1999; Dian et al., Reference Dian, Andueza, Barbosa, Amoureux, Jestin, Carvalho, Prado and Prache2007a; Prache et al., Reference Prache, Huang and Andueza2018). The higher discrimination of P lambs from S lambs based on the quantification of light absorption by carotenoid pigments at wavelengths ranging from 450 to 510 nm of the reflectance spectrum on perirenal rather than on subcutaneous fat, is in accordance with the results of previous studies (Priolo etal., Reference Priolo, Prache, Micol and Agabriel2002b; Dian et al., Reference Dian, Andueza, Barbosa, Amoureux, Jestin, Carvalho, Prado and Prache2007a). This better discrimination is likely to be due to a higher carotenoid concentration consequence of early development of perirenal fat in comparison with subcutaneous fat (Priolo et al., Reference Priolo, Prache, Micol and Agabriel2002b; Dian et al., Reference Dian, Andueza, Barbosa, Amoureux, Jestin, Carvalho, Prado and Prache2007a and Reference Dian, Andueza, Barbosa, Amoureux, Jestin, Carvalho, Prado and Prache2007b; Huang et al., Reference Huang, Andueza, Oliveira, Zawadzki and Prache2015). However, the reliability of the discrimination for P and S lambs based on perirenal fat was much lower than that obtained in previous studies (Priolo et al., Reference Priolo, Prache, Micol and Agabriel2002b; Dian et al., Reference Dian, Andueza, Barbosa, Amoureux, Jestin, Carvalho, Prado and Prache2007a and Reference Dian, Chauveau-Duriot, Prado and Prache2007b; Devincenzi et al., Reference Devincenzi, Prunier, Meteau and Prache2019). In fact, no cut-off value of AVMI450–510 of perirenal fat was registered to discriminate between lambs from both FS, and the distribution of AVMI450–510 values for P lambs overlapped that of S lambs making it impossible to discriminate between P and S lambs (Dian et al., Reference Dian, Andueza, Barbosa, Amoureux, Jestin, Carvalho, Prado and Prache2007a; Devincenzi et al., Reference Devincenzi, Prunier, Meteau and Prache2019). This difference may be partly explained by the genetic component, as recent studies (Macari et al., Reference Macari, Graulet, Andueza and Prache2017; Prache et al., Reference Prache, Huang and Andueza2018) confirmed the finding of Prache et al., (Reference Prache, Larue, Ballet, Jailler, Coustet, Teuma, Pourrat and Andueza2010) and demonstrated a between-breed variability in the digestive and metabolic fate of carotenoid pigments. Second, it is most likely that the carotenoid content in the herbage differ between European temperate and North African grasslands, being lower with higher air temperature and lower water availability (Mark and Dean, Reference Mark and Dean2005). Moreover, during the suckling period (4 months), S lambs ingested and stored carotenoid pigments that subsisted in fat. In this context, de Oliveira et al. (Reference de Oliveira, Carvalho and Prache2012) observed no significant change in AVMI450–510 of perirenal fat from 45 days on a high dietary carotenoid level onwards, whereas the present trial lasted only 60 days. These hypotheses need further investigation to quantify carotenoid pigments in feed and fat tissues and compare the capacity of the North African breeds to stock these second metabolites as proposed (Dian et al., Reference Dian, Andueza, Barbosa, Amoureux, Jestin, Carvalho, Prado and Prache2007a and Reference Dian, Chauveau-Duriot, Prado and Prache2007b; Prache et al., Reference Prache, Larue, Ballet, Jailler, Coustet, Teuma, Pourrat and Andueza2010) and confirmed (Macari et al., Reference Macari, Graulet, Andueza and Prache2017; Prache et al., Reference Prache, Huang and Andueza2018) for European breeds.
The caudal fat may be a potential tissue to better discriminate FSs, since the reliability of discrimination was higher than percentages achieved with prirenal and subcutaneous fats when applying M1. However, this suggestion must be used with caution because of the small number of animals.
Reflectance spectrum at wavelengths between 400 and 700 nm
The improvement in reliability of the discrimination when taking into account all the reflectance spectral data within the wavelengths range 400 to 700 nm (W400–700) for caudal, perirenal and subcutaneous fats is in accordance with previous studies comparing these two methods (Dian et al., Reference Dian, Chauveau-Duriot, Prado and Prache2007b, Huang et al., Reference Huang, Andueza, Oliveira, Zawadzki and Prache2015). The similarity in loading values for the first two principal axes for the perirenal and caudal fat suggests histological (Hood and Allen, Reference Hood and Allen1997) and metabolic resemblance between both tissues, which requires more investigation and clearly underline the importance of carotenoid pigments in discriminating between P and S lambs, as already observed in previous studies (Dian et al., Reference Dian, Andueza, Barbosa, Amoureux, Jestin, Carvalho, Prado and Prache2007a; Huang et al., Reference Huang, Andueza, Oliveira, Zawadzki and Prache2015; Devincenzi et al., Reference Devincenzi, Prunier, Meteau and Prache2019). The loading shape was different for subcutaneous fat, which may explain the lower discrimination ability performed when using this fat tissue.
The PC1 and PC2 axes loading values at wavelengths around 400 to 430 nm and 500 to 585 nm indicate that haem pigments, probably in residual Hemoglobin in tiny blood vessels, could be involved in the discrimination between P and S lambs, as already observed by Swatland (Reference Swatland1989), Dian et al. (Reference Dian, Andueza, Barbosa, Amoureux, Jestin, Carvalho, Prado and Prache2007a) and Prache et al. (Reference Prache, Huang and Andueza2018), who declared that the absorption bands of the respiratory pigments in the fat reflectance spectrum can be situated at wavelengths 415 to 435 nm in the blue wavelength region called Soret band and at wavelengths 540 to 580 nm for absorption bands in green wavelength region. The reliability of the discrimination was lower in this study than in studies conducted in European conditions (Dian et al., Reference Dian, Chauveau-Duriot, Prado and Prache2007b; Huang et al., Reference Huang, Andueza, Oliveira, Zawadzki and Prache2015). Considering the likely implication of carotenoid pigments in the discrimination between P and S lambs, the low reliability of the discrimination recorded in this study may be partly due to (i) breed effect, (ii) the level of carotenoid intake and (iii) the lambs’ previous nutritional history, as suggested earlier.
Conclusion
This is the first study reporting data about the colour of different fat tissues of Tunisian meat breeds under stall- and pasture-feeding systems and the first at applying spectral methods developed in European temperate areas to authenticate lamb according to feeding systems in North African conditions. The main result was that despite the lower reliability in comparison to European researches, this study confirmed the efficiency of visible reflectance spectroscopy technique applied on perirenal fat in feeding systems authentication under North African conditions and spotted the caudal fat as a new support for better classification of fat-tailed breeds. Besides, results on fat colour and traceability revealed that we are only beginning to understand fat and that further researches are needed on a larger number of animals to validate these preliminary results without forgetting to take into account several parameters such as pre-trial diet, trial duration, interbreed variability in carotenoid intake, digestion and metabolic fate.
Acknowledgements
This work was financially supported by the Tunisian Ministry of Agriculture through contract ‘Carcass and meat quality of sheep and goat’ and the Tunisian Ministry of High and Scientific Research through ‘Animal and Forage Production Laboratory’. The authors gratefully acknowledge the technical assistance of general Lafareg farm staff in the conduct of this study. They are indebted the UMRH unit staff from INRA Theix for technical help during this work.
Declaration of interest
None.
Ethics statement
All procedures employed in this study (transport and slaughtering) meet ethical guidelines and adhere to Tunisian legal requirements (the Livestock Law No. 2005-95 of 18 October 2005, Chapter II; Section 1 and Section 2 relative to the slaughter of animals).
Software and data repository resources
None.
Supplementary material
To view supplementary material for this article, please visit https://doi.org/10.1017/S1751731119000909.