1. Introduction
One of the most remarkable abilities that characterises bilingual speakers is that they can switch between their two languages without apparent effort. However, experimental studies have shown that switching between languages can incur a cost in terms of speed and accuracy. The cost has been observed in both speech comprehension (e.g., Thomas & Allport, Reference Thomas and Allport2000) and in speech production (e.g., Costa & Santebastan, Reference Costa and Santesteban2004; Finkbeiner, Almeida, Janssen & Caramazza, Reference Finkbeiner, Almeida, Janssen and Caramazza2006; Meuter & Allport, Reference Meuter and Allport1999). This has generated a debate over whether there are input and output “switches” in the bilingual language system, as well as more detailed discussion on the nature of the control processes in operation. Due to their differing demands, the control processes may be different for comprehension and production.
With respect to comprehension, a number of researchers have argued that access is non-selective and lexical alternatives in both languages are activated in parallel even when words are presented in only one language (e.g., Kroll, Bobb & Wodniecka, Reference Kroll, Bobb and Wodniecka2006, but see Costa, Reference Costa2005, for an alternative view). An empirical demonstration of this phenomenon was provided using a visual lexical decision paradigm in which participants are asked to decide whether a letter string appearing on a computer screen is a real word or not. The adaptation of this paradigm to bilingual research has exploited cross-language similarity between words (see Dijkstra, Reference Dijkstra2005, for review). For example, words from different languages may have the same orthography and same meaning; others may have the same orthography but a different meaning. The former are called interlingual cognates and the latter interlingual homographs. An example of a cognate is the word idea, which has the same spelling and meaning in both Italian and English, but different phonology. An example of homograph is the word cane, which in Italian means “dog”. Researchers using this paradigm have compared the reaction times and accuracy for these ambiguous words with those that are not ambiguous, that is, words that are unique in each language, which we will refer to as singles (e.g., Thomas & Allport, Reference Thomas and Allport2000). In a typical lexical decision setting, real words (cognates, homographs and singles) are mixed with plausible non-words, that is, strings respecting the spelling rules of the language, and participants are asked to respond whether the presented stimuli are real words in a given language or not. When bilingual participants perform the lexical decision task in a monolingual setting, the principal question is whether their performance is affected by the status of the letter strings in the other language. A number of studies have shown that bilinguals performing the task in their native language are faster to respond when the real word is a cognate (e.g., Van Hell & Dijkstra, Reference Van Hell and Dijkstra2002), and slower to respond when it is a homograph (e.g., Von Studnitz & Green, Reference Von Studnitz and Green2002). This suggests parallel activation of both languages.
Speech production has a greater requirement for a control mechanism, since only one language can be output at once. In the case of unbalanced bilinguals, control mechanisms must enable a less practised L2 phonological form to be output in the face of competition from a more practised L1 form that shares the same semantic representation. Control processes must, therefore, be able to inhibit L1 forms while outputting L2 forms. One of the most influential cognitive models that characterises this process is the Inhibitory Control Model (ICM – Green, Reference Green1986, Reference Green1998). The model was designed to explain issues such as how a bilingual translating a word from L2 to L1 avoids naming the word in L2 and vice versa. The model proposes that during the phase of message planning, a general mechanism is in charge of controlling the speaker's communicative intentions. This mechanism is inspired by Norman and Shallice's (Reference Norman, Shallice, Davidson, Schwartz and Shapiro1986) model of action selection. According to the ICM, language can be viewed as a form of communicative action. In order to carry out the action, voluntary control is required. Green explained this concept borrowing the term schema, a mental device that individuals construct or adapt on the occasion in order to achieve a specific goal or task. In the ICM, the task schemas (e.g., producing speech or translating from L1 to L2) in turn work together with the lexico-semantic system to determine the output. It is the task schema that modulates the amount of activation of the different lexical entries and controls the language output by inhibiting or activating different representations. Thus, the ICM predicts the existence of an inhibitory system that suppresses the activation of the language that is not currently in use. Inhibition can occur either at the schema level or at a lexical level, where specific language tags may be suppressed. The model proposes that language activation is non-selective, that is, the conceptual/semantic components activate lexical entries in both languages. Once activation in the target language is in place, the non-target language is inhibited. Finally, the model stipulates that inhibition is reactive, that is, the amount of time needed to switch increases if the level of inhibition increases. Thus, the more activation there is of words in both languages, the greater the inhibition will be for the non-target language. Individual levels of proficiency modulate switch costs: competition is expected to be greater for highly proficient bilinguals, who will in turn show more inhibition than less proficient bilinguals (Green, Reference Green1998). However, less proficient bilinguals will experience longer latencies when switching back into their dominant language (L1) as it is predicted that L1 requires more inhibition than L2 (Green, Reference Green1998).
Evidence in support of the ICM was obtained with various paradigms involving speech production (e.g., Lee & Williams, Reference Lee and Williams2001; Levy, McVeigh, Marful & Anderson, Reference Levy, McVeigh, Marful and Anderson2007). However, Meuter and Allport (Reference Meuter and Allport1999) provided perhaps the first empirical evidence in favour of inhibitory processes in bilingual speech production. They used a digit-naming switching paradigm to measure the latencies for trials preceded by a same-language response (non-switch) or by a different language response (switch). Bilingual participants speaking a variety of European languages at different degrees of proficiency were asked to name digits appearing singly on a computer screen. The numbers, from 1 to 9, were enclosed in a coloured rectangle functioning as a language cue. For example, if the colour was blue the number was to be named in English; if red, in French. The languages were alternated in such a way that participants could not fully predict when a switch could occur (an unpredictable switching paradigm). Meuter and Allport (Reference Meuter and Allport1999) compared the latency to name the numerals on non-switch versus switch trials to determine the size of the switching cost. They found that the switching cost was higher when participants switched from the less dominant (L2) to the more dominant (L1) language than vice versa. This result was interpreted in support of the ICM: the non-target language is suppressed when speaking in the target language. However, the observed asymmetry in switching cost also supports the notion that reactive inhibition is proportional to the level of activation of the non-target language. In this case, a dominant L1 may require a stronger inhibition, which in turn may result in a higher cognitive effort for its reactivation. Conversely, when switching from L1 to L2, the switching cost is reduced because when speaking in the more dominant language there is no need to inhibit an already weak L2. Meuter and Allport (Reference Meuter and Allport1999) measured the participants’ relative language proficiency in terms of speed at naming numerals in L1 versus L2. On the basis of the results obtained, they arbitrarily split the participants in two groups: (i) Group A were participants with a larger mean difference between L1 and L2 (90 ms); and (ii) Group B were those who had a smaller difference (15 ms). Results showed that Group A, that is, those with a larger difference in language proficiency (less proficient in L2), exhibited a greater switch cost asymmetry than those who showed a smaller difference in relative proficiency (highly proficient bilinguals). These findings are in line with the ICM account, which predicts that when the difference between L1 and L2 proficiency is small, then a similar degree of inhibition should be applied to both languages. Thus, the magnitude of switching cost should be similar in both directions.
Costa and Santebastan (Reference Costa and Santesteban2004) further contrasted the performance of high and low proficiency bilinguals in a picture-naming switching task. In their first two experiments involving L2 learners and native bilingual speakers of Spanish and Catalan, they replicated Meuter and Allport's (Reference Meuter and Allport1999) findings, that is, the magnitude of switching cost was larger for low than highly proficient bilinguals. However, in subsequent experiments they showed that highly proficient bilinguals who were acquiring a third language (L3), did not show a switching cost asymmetry when performing the task in their stronger L1 and weaker L3. The authors concluded that these findings questioned the prediction of the ICM: if switching cost asymmetry is the difference in the amount of inhibition applied to L1 and L2, this asymmetry should also be observed when highly proficient bilinguals switch into a third weaker language. The switch cost asymmetry, and the origin of switch cost effects, remain controversial.
One challenge lies in the fact that current proposals are formulated as verbal theories. The adequacy of verbal theories to account for specific patterns of empirical data can be undermined by lack of detail and unarticulated assumptions. For example, as we have seen, the ICM explains the switch cost asymmetry in terms of the greater cognitive effort required to reactivate the inhibited L1 during an L1 switch. This assumes that the performance cost arises from the reactivation of L1. However, why shouldn't the initial inhibition of L1 require a similar cognitive effort, during a switch into L2? If it did, the requirement to differentially inhibit L1 would contribute equally to performance decrements on switches into L1 and switches L2, thereby rendering the account unable to explain the switch cost asymmetry. It is evident, here, that the devil is in the detail: of how inhibition and reactivation of languages take place, of how these processes affect naming performance, and how they differ in the control processes acting over language systems with different degrees of proficiency. One response to this challenge is to complement empirical work with computational modelling (Li, Reference Li2013). The requisite detail is added to theoretical proposals by implementation, and the adequacy of the proposal to produce particular patterns of empirical data can be directly evaluated via simulation. Models also have the virtue that different sets of assumptions can be compared, and novel predictions generated.
In the first half of the paper, we present an empirical study that extends the language-switching production paradigm to the naming of visually presented words. In addition, this study introduces the use of word class (i.e., cognates, homographs and singles) to investigate whether lexical-level variables interact with control processes during production. In the second half of the paper, we present a computational modelling study. Two neural network models were applied to simulate the results of our empirical study and investigate which implemented control processes would be sufficient to explain the switch costs and word class effects revealed in our data.
1.1 The computational modelling of bilingualism, task switching and word reading
As discussed in Thomas and Van Heuven (Reference Thomas and Van Heuven2005), a general aim for computational models of bilingualism is to identify circumstances in which there is interference between languages and the way that such interference affects linguistic performance. These models can be divided in two categories, which differ with respect to two criteria: the way in which competition between words belonging to different languages is resolved, and whether the model includes a learning process (Thomas & Van Heuven, Reference Thomas and Van Heuven2005). The majority of implemented models have employed connectionist methods. Models within the so-called “localist” approach (the Bilingual Interactive Activation (BIA): Dijkstra & Van Heuven, Reference Dijkstra, Heuven, Grainger and Jacobs1998; Van Heuven, Dijkstra & Grainger, Reference Van Heuven, Dijkstra and Grainger1998; the Bilingual Model of Lexical Access (BIMOLA): Grosjean, Reference Grosjean and Grosjean2008; and the Semantic, Ortographic, and Phonological Interaractive Activation (SOPHIA): Van Heuven & Dijkstra, Reference Van Heuven and Dijkstra2001) employ architectures in which individual representational units encode linguistic items such as words, letters or phonemes. No learning occurs, and connectivity is set by hand. Such models resolve competition between words from different languages at a lemma level and focus on adult language processing. On the other hand, the so-called “distributed” models (the Bilingual Single Network (BSN): Thomas, Reference Thomas1997a, Reference Thomas, Bullinaria, Glasspool and Houghtonb; the Bilingual Simple Recurrent Network (BSRN): French, Reference French, Gernsbacher and Derry1998; the Self-Organising Model of Bilingual Processing (SOMBIP): Li & Farkas, Reference Li, Farkas, Heredia and Altarriba2002; a self-organising connectionist model of early word production (DevLex–II): Zhao & Li, Reference Zhao and Li2010, Reference Zhao and Li2013; and the reading model: Yang, Shu, McCandliss & Zevin, Reference Yang, Shu, McCandliss and Zevin2013) are based on trainable architectures including internal layers which develop their own representations or self-organising feature maps. These architectures, which can potentially address developmental phenomena, account for intra-language competition at the level of distributed activation patterns, developed in the network through experience-dependent weight changes.
Although prior computational models of bilingualism have made great advances in addressing phenomena in bilingual language processing, they were not particularly useful in our current computational investigation. These models have mostly focused on language comprehension, in particular, visual word recognition and speech perception. Those that have addressed production (e.g., Li & Farkas, Reference Li, Farkas, Heredia and Altarriba2002; Zhao & Li, Reference Zhao and Li2010, Reference Zhao and Li2013) have not yet considered the phenomenon of language switching and context-driven control dynamics, which would have allowed us to simulate switch and non-switch trials in production.
In our computational investigation, we developed two computational models that combined elements of two classes of existing computational models. The first class was models of word naming. The most representative neural network model within this class is the Seidenberg and McClelland (Reference Seidenberg and McClelland1989) “triangle” architecture, including learning of mappings between orthography, semantics, and phonology. The second class were models of controlled processes and task switching, in particular the models of Cohen, Dunbar and McClelland (Reference Cohen, Dunbar and McClelland1990), and Gilbert and Shallice (Reference Gilbert and Shallice2002). Ideally, a computational model of language switching should establish control processes over representations developed by an experience-dependent process. The Cohen et al. (Reference Cohen, Dunbar and McClelland1990) model of the Stroop task was our starting point for how this might be achieved: by implementing attentional control over separate and competing processing channels with different strengths, where strength is determined by experience-dependent learning. However, this model was limited, since its control processes operated over highly simplified outputs, rather than generating phonological forms, while it did not account for task switching (Gilbert & Shallice, Reference Gilbert and Shallice2002; Kanne, Balota, Spieler, & Faust, Reference Kanne, Balota, Spieler and Faust1998). The Gilbert and Shallice (Reference Gilbert and Shallice2002) model addressed some of these limitations and simulated switch costs based on the task carryover account (Allport, Styles & Hsieh, Reference Allport, Styles, Hsieh, Umilta and Moscovitch1994; Allport & Wylie, Reference Allport, Wylie, Monsell and Driver2000), which posits that costs in switching depend heavily on the nature of the previous task. However, the Gilbert and Shallice (Reference Gilbert and Shallice2002) model was not developmental, and once more relied on a highly simplified task environment related to Stroop tasks.
Our aim in the modelling section was to extend these models into a developmental model of bilingual naming with implemented control processes. Within this framework, we evaluated the conditions under which switch cost asymmetries and word class effects might emerge.
2. Empirical methods
2.1 Overview
Adult Italian–English bilinguals named visually presented words appearing on either a blue or red background. Participants were instructed to name words on a blue background in Italian and those on a red background in English. Language switched probabilistically, with same language sequences of between two and five trials. Accuracy and naming time were recorded for switch and non-switch trials.
2.2 Participants
Twenty healthy late Italian–English bilingual adults (9 females, mean age 34.0, SD = 6.6, range 21.2–46.2) took part in this study. They were all residents in the UK at the time of testing and recruited from different professional environments. Their native language (L1) was Italian; their second language, English (L2), was acquired on average after the age of 10.0 (SD = 4.6). All participants signed an informed consent and did not report any visual, speech or neurological impairment.
2.3 Materials and procedure
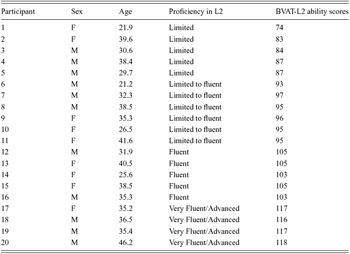
All participants were tested by the same experimenter and on the same equipment, a MacBook computer, in a soundproof booth at the Centre for Brain and Cognitive Development, Birkbeck College, London. Participants completed the Language History Questionnaire adapted from Li, Sepanski and Zhao (Reference Li, Sepanski and Zhao2006) and were also administered the Bilingual Verbal Ability Tests (BVAT; Muñoz-Sandoval, Cummins, Alvarado & Ruef, Reference Muñoz-Sandoval, Cummins, Alvarado and Ruef1998) to assess their language proficiency in English (Filippi, Leech, Thomas, Green & Dick, Reference Filippi, Leech, Thomas, Green and Dick2012; Filippi, Richardson, Dick, Leech, Green, Thomas & Price, Reference Filippi, Richardson, Dick, Leech, Green, Thomas and Price2011). Biographical and L2 proficiency information is reported in Table 1.
Participants’ biographical data (sex: female, male; age-in-years, and level of proficiency in English). Proficiency was either assessed categorically, according to the categories included in the BVAT (Muñoz-Sandoval et al., Reference Muñoz-Sandoval, Cummins, Alvarado and Ruef1998), or using a continuous score of L2 ability provided by the test, where higher numbers represent greater proficiency.

Switching in production task
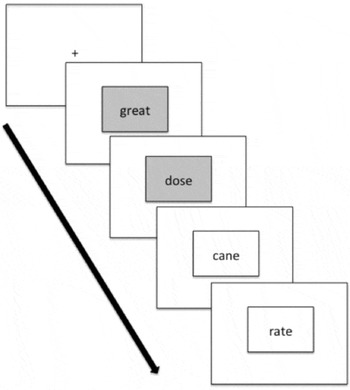
Bilingual participants were presented a total of 360 words on a computer screen, 180 in English and 180 in Italian. Words appeared one by one in sequence at the centre of the screen, with a 1.5-second interval between each other. A schematic illustration of the task is provided in Figure 1.
Example of an experimental run. Each run consisted of 12 words divided in 4 same-language sequences of different length (2, 3 or 4 words), alternating between languages.

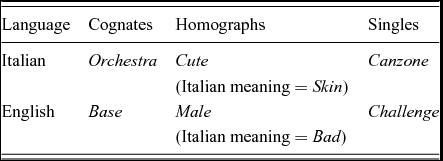
Stimuli comprised three classes: target words with same spelling and same meaning in both languages (cognates, n = 30), target words with same spelling but different meaning (homographs, n = 30), and unique words in both languages (singles, n = 30). Examples of experimental words are shown in Table 2. Within each class, words were split into two matched groups, half of which were presented on switch trials, half of which were presented on non-switch trials, with the groups counterbalanced across participants. This was implemented by arranging the target words pseudo-randomly in two presentation orders, and alternately assigning participants to one of the two orders. Target words of the three classes were matched within language by their length, frequency and concreteness (see Appendix I, available as supplementary materials online, accompanying the electronic version of the present paper at http://journals.cambridge.org/BIL; this appendix also includes the split between matched groups). For English words, values were taken from the MRC Psycholinguistic Database (Coltheart, Reference Coltheart1981) using the indices of word frequency (Kucera & Francis, Reference Kucera and Francis1967) and concreteness (Coltheart, Reference Coltheart1981). For Italian words, values were taken from the Corpus e Lessico di Frequenza dell'Italiano Scritto – CoLFIS (Laudanna, Thornton, Brown, Burani & Marconi, Reference Laudanna, Thornton, Brown, Burani, Marconi, Bolasco, Lebart and Salem1995). Italian words had a median frequency of 74 occurrences per million words for homographs, 34 occurrences for cognates and 31 occurrences for singles. English words had a median frequency of 44 occurrences per million words for homographs, 25 occurrences for cognates and 66 occurrences for singles. In proportion, Italian singles were less frequent than English singles and Italian homographs were more frequent than English homographs. Interlingual cognates were approximately equally frequent in both languages. Ninety English and 90 Italian filler words were also included. All fillers were unique words of each language
An example of interlingual cognates, homographs and singles used in this study. Singles were orthographically legal in both English and Italian.

Words were presented in runs of 12 words. Each run started with a filler word and contained three switch trials for target words (cognates, homographs and singles). Words were presented individually with a 1.5-second interval. Participants were required to name each word aloud as fast and as accurately as possible. Words surrounded by a blue rectangle had to be read in Italian and words surrounded by a red rectangle in English. We did not counterbalance colour of rectangle used to cue each language across participants but did not expect any particular language-specific influence of colour cue given the work of Meuter and Allport (Reference Meuter and Allport1999). Both rectangles were sized 5.6 cm × 2.8 cm. Stimuli were written in white Helvetica 24, uppercase. Trial runs were either of two, three or four words within each language, and were fully counterbalanced for unpredictable presentation in two randomly allotted orders. If x was the first trial following a switch of language, there was a 64% chance that trial x + 1 would be a switch back into the other language. If not, x + 2 had a chance of 91%, and x + 3 = 100%. There were 30 runs of 12 words. At each run completion, a fixation-cross appeared on the screen and the task was paused to allow the participants to have a short break before continuing to the next run at their own pace by pressing the space-bar on the computer keyboard. A glass of water was also provided.
Participants’ responses were recorded into .wav files through the Macbook built-in microphone. Reaction times were analysed using Praat phonetic software (Boersma & Weenink, Reference Boersma and Weenink2010). An internally developed script automatically calculated the time latency between stimulus presentation and the participant's utterance onset (Figure 2). This operated by detecting a change in intensity of the auditory signal greater than 25 dB that lasted for more than 0.1 second. All trials were subsequently checked manually and speech errors were flagged and labelled for separate analysis.
An example of response time analysis. The solid vertical lines indicate the time of stimulus onset and the dashed vertical lines the time when the participant started to utter the words. A software script automatically calculated the latencies.

At task completion, all participants were given the list of target words (cognates, homographs and singles) on paper and asked to indicate the ones for which they did not know the meaning, the correct pronunciation, or both. These words were subsequently excluded from the analysis.
2.4 Results and discussion
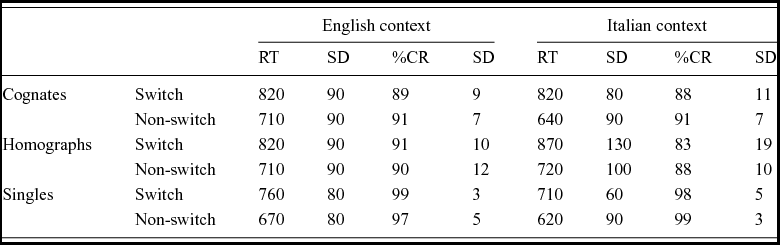
Start trials and filler trials were discarded from the analysis. Median reaction times for each stimulus class for valid switch and non-switch trials were computed for each participant to reduce the influence of outliers. The switch cost for the three word classes (cognates, homographs and singles) was computed by subtracting the switch from the non-switch individual mean score. The means of the median response times, error rates and switch costs by word class and type of trial are displayed in Table 3.
Mean reaction times (RTs, milliseconds), correct responses (%CRs) and standard deviations (SDs) for switch and non-switch trials by word class and language context. Costs are shown positively for an increase in reaction time and a decrease in accuracy. SwCost = Switch cost.

First, we report the analyses of response times. As expected, Italian–English bilinguals were 19 ms faster in naming words in their native language (Italian) than in their second language (English) but this difference was not reliable, F(1,19) = 2.421, p = .136. However, this comparison combines switch trials and homograph stimuli, both of which may reduce the difference between the languages. An analysis of responses to singles on non-switch trials revealed reliably slower naming in L2 than L1, in line with the overall language dominance of the group, with a mean difference of 50 ms, F(1,19) = 10.054, p = .005, η2 = .346. Turning to word class, and grouping switch and non-switch trials together, cognates and homographs were named on average 73 ms more slowly than singles, F(2,38) = 65.307, p < .001, η2 = .775.
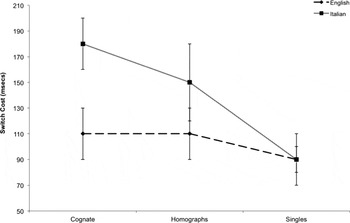
Switch costs were computed for each participant, for each language and word class. The results are illustrated in Figure 3. A 3 × 2 repeated-measure ANOVA for word class (cognates, homographs and singles) and switch cost (Italian, English) revealed a highly significant switch cost asymmetry, F(1,19) = 8.514, p = .009, η2 = .31, whereby Italian–English bilinguals were faster to switch into their less dominant L2 (English) than their more dominant L1 (Italian). In addition, the switch cost was modulated by word class: regardless of the language in which they were naming words, Italian–English bilinguals incurred a larger switch cost when naming cognates and homographs than singles, F(2,38) = 5.760, p = .007, η2 = .23. Analysis of variance failed to detect the interaction between the switch cost asymmetry and word class, F(2,38) = 1.458, p = .245, η2 = .07. As shown in Figure 3, this was due to greater variability in the switching cost for homographs. A further investigation including only cognates and singles revealed a significant interaction, F(1,19) = 6.794, p = .017, η2 = .26, such that cognate status exaggerated the switch cost asymmetry (t(19), 2.952, p = .008). No asymmetry was observed for singles alone.
Switch cost asymmetry between English and Italian for cognates, homographs and singles. Switch cost is defined as the difference between switch and non-switch trials, here expressed in milliseconds.

Correlation between measures of language competence and switching cost
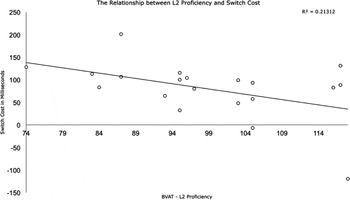
The switching cost asymmetry was calculated by subtracting the mean switch cost for L2 from that for L1, such that positive values would represent a larger asymmetry. These values were correlated with the individual ability scores of L2 language competence derived from the standardised tests (BVAT – Muñoz-Sandoval et al., Reference Muñoz-Sandoval, Cummins, Alvarado and Ruef1998). As shown in Figure 4, levels of L2 proficiency were negatively associated to the cost asymmetry. Regression analysis, including a check for outliers (Cook & Dennis, Reference Cook1977), showed that the correlation was significant, R2 = .235, F(1,18) = 4.875, p = .040. Less L2-proficient bilinguals exhibited a more asymmetric pattern of switching costs than more L2-proficient bilinguals.
Relation of each participant's L2 proficiency with his or her switch cost asymmetry. The x-axis presents L2 proficiency according to the BVAT (higher scores = more proficient), while the y-axis presents the switch cost asymmetry (L1–L2) in milliseconds.

Errors
The same quantitative analyses were performed for error rates. Overall, bilingual participants made fewer errors in naming English words (7%) than Italian words (9%). However, this difference was not reliable, F(1,19) = 1.299, p = .270, η2 = .064. Turning to switch costs, numerical differences in accuracy rates were in the expected direction, with Italian words showing larger accuracy costs than English words, and Italian cognates and homographs the highest accuracy costs of switching language. However, unlike the response time data, these differences were not reliable (interaction of switch cost and language: F(1,19) = 2.451, p = .134, η2 = .114; interaction between word class and language switch: F < 1). For comparison, in their bilingual numeral-naming study, Meuter and Allport (Reference Meuter and Allport1999) did not carry out analyses of error data because accuracy levels were close to ceiling, but remarked that twice as many errors occurred in switches into L1 than switches into L2.
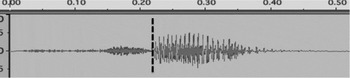
Interestingly, amongst the errors, Meuter and Allport (Reference Meuter and Allport1999) reported the presence of phonological blends between the two languages. We carried out a qualitative analysis on our word-naming data to investigate where in the speech production system control processes appeared to be operating. Overall, participants made only 4% errors. The majority of these errors, 74%, were approximately equally distributed between two main categories: (i) lexical, in which participants named the word using the non-target language; and (ii) sublexical, in which participants started to articulate the word using the non-target language and switched to the target language before completing the word. This occurred in two ways: (i) starting with the wrong phonology, then pausing when mistake was detected, and finally producing the word in the target language starting from scratch; and (ii) starting with the wrong phonology, then correcting to the right articulation without interruption (an example of this type of error is displayed in Figure 5). The remaining errors were those in which participants either mispronounced the word, particularly when it was an English word, or failed to name the word at all.
An example of a Sublexical mixed-language error. Here the participant was required to name the cognate word “Scene” in English [sēn]. However the participant started with the articulation in Italian [ʃʃɛne] and continued after the dashed line with the correct articulation in English. The word produced is a mix of Italian ʃʃ and English ēn, which formed a “novel” word [ʃʃ ēn].

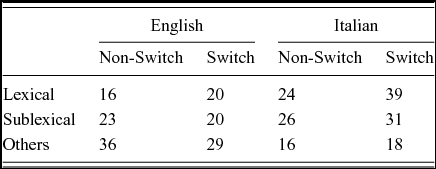
Errors were divided into those occurring on switch versus non-switch trials, either in English or Italian (Table 4). The errors were overwhelmingly driven by the existence of a word form in both languages: 50% were made with interlingual homographs, 42% with cognates and only 8% with singles, χ2(1) = 70.56, p < .001. With both languages combined, lexical errors occurred more frequently on switch (59/99) than non-switch (40/99) trials. Pearson's chi-square indicated that this trend was approaching significance, χ2(1) = 3.65, p = .056. However, sub-lexical errors occurred equally often on switch (51/90) and non-switch (49/90) trials. When this analysis was split by language, for English, both lexical and sublexical errors occurred with comparable frequency on switch and non-switch trials. For Italian, the same was true of sublexical errors, but with lexical errors, there was a trend of greater frequency on switch (39/63) than non-switch trials (24/63), χ2(1) = 3.57, p = .058. The control processes that led to a greater switch cost for Italian cognate responses also seemed to lead to more lexical errors.
Type of errors by language and trial type.

We summarise the principal empirical results below, as we consider a computational investigation of language switching in bilingual naming.
3. Computational methods
3.1 Overview
We investigated the control processes that underlie switching in bilingual naming using two computational models. We began by extending Cohen et al.'s (Reference Cohen, Dunbar and McClelland1990) model of the Stroop task (henceforth CDM). This model has task control structures to mediate the competition between two experience-dependent processing pathways. We took the view that our initial assumptions about processes of control should be constrained by a model targeted to that phenomenon. We extended the model by increasing the representational capacity of the processing pathways so that they might acquire the mapping between orthographic, lexical-semantics, and phonological representations of words, thereby combining the CDM dual-pathway architecture with elements of Seidenberg and McClelland's (Reference Seidenberg and McClelland1989) developmental model of word naming. One disadvantage of our first model was that allegiance to the assumptions of the CDM yielded an architecture with independent processing structures and representational resources for each of the bilingual's languages. The issue of the relationship between the representations of the bilingual's two languages has long been a point of debate, and the effects of employing shared resources have been the focus of computational work (e.g., Thomas, Reference Thomas, Bullinaria, Glasspool and Houghton1997b; Zhao & Li, Reference Zhao and Li2010).
In the event, our first model proved unable to capture the target empirical phenomena. In our second model, we combined a language-switching mechanism similar to that of Gilbert and Shallice's (Reference Gilbert and Shallice2002) model of task switching with a multiple-cues architecture for word naming (Karaminis & Thomas, Reference Karaminis, Thomas, Ohlsson and Catrambone2010; Thomas & Karmiloff-Smith, Reference Thomas and Karmiloff-Smith2003). Consistent with a view of bilingual word naming as a multiple constraint satisfaction process (Seidenberg & MacDonald, Reference Seidenberg and MacDonald1999), the multiple-cues architecture supported the flexible integration of multiple types of information that were relevant to the task. This model also allowed us to utilise a shared representational resource for the two languages, which in other work has been shown to provide grounds to explain cross-language interference effects (Thomas, Reference Thomas, Bullinaria, Glasspool and Houghton1997b; Zhao & Li, Reference Zhao and Li2010, Reference Zhao and Li2013).
Our models were evaluated against their ability to simulate six phenomena observed in our empirical study, summarised below. These focused on response time data. Importantly, we required that the relevant behaviours appear as emergent effects, rather than directly as a result of model assumptions. For example, it is relatively straightforward and uninteresting to recover an asymmetry in switch costs if this is built in the assumptions of the model (see Appendix II, in supplementary materials online). The only model assumption that we allowed with respect to L1 and L2 was that the model could receive different amounts of experience in acquiring its two languages.
3.2 Target data, modelling assumptions, and relation to previous modelling work
Target empirical phenomena
The computational investigation of language switching aimed to simulate six key phenomena from the preceding empirical task:
-
• Target empirical phenomenon 1: Response times were faster for L1 than for L2.
-
• Target empirical phenomenon 2: Response times were faster for non-switch than for switch trials, i.e., switch costs were observed.
-
• Target empirical phenomenon 3: Switch costs were larger for L1 than for L2.
-
• Target empirical phenomenon 4: The differences in response times and switch costs for L1 and L2 were more pronounced when the imbalance between the two languages was greater.
-
• Target empirical phenomenon 5: There was an effect of word class on switch costs. Switch costs were greater for cognates and homographs than for singles.
-
• Target empirical phenomenon 6: There was an effect of word class on the asymmetry of switch costs for the two languages. Asymmetric switch costs (greater for L1 than L2) were observed for cognates, but not for singles, however.
Main assumptions and simplifications of modelling approach
Our modelling approach assumed that to account for the target empirical phenomena a system should exhibit four key properties:
-
1. It should learn mappings between orthography, meaning and phonology from two languages.
-
2. It should employ control structures that determine the output language.
-
3. It should learn the mappings from the two languages to different strengths based on different levels of experience with each language, in order to capture different degrees of bilingualism.
-
4. It should be able to simulate both accuracy and response times.
Of course, this view of bilingual speech production simplifies the bilingual acquisition and speech production processes in a number of ways. First, it is neutral on whether the acquisition of L1 and L2 is sequential or simultaneous. This means the model is not required to address possible issues of catastrophic interference should a common representational resource be used to process both languages (Thomas & Plunkett, Reference Thomas, Plunkett, Moore and Lehman1995). Further, our approach does not consider a rich scheme of semantics, but instead simplifies semantics to the lemma level (lexical-semantics). This is because in the target data, the key distinction for the word class manipulation is only whether the input forms have the same or different meanings in the two languages. However, this reduces one major source of possible naming errors, competition within the semantic space, and therefore potentially rendered the model more accurate than human speech production. The output of the system is an articulatory feature-based phonological code, rather than motor commands. Finally, we do not include interactivity (e.g., from phonology back to the lemma level) though this is a topic of much debate in the monolingual naming literature.
Relation to prior models
The first of our two models was based on Cohen et al.'s (Reference Cohen, Dunbar and McClelland1990) model of the Stroop task. These authors implemented a feed-forward architecture with two processing pathways, one dedicated to the processing of colour and one to the processing of words. An analogue of response time was implemented through a cascading mechanism that allowed activation to build up gradually in the network. In the CDM model, control processes were implemented as follows. Processing pathways had a default status of being inhibited (implemented by a negative bias of –4 applied to the units of the hidden layer of each pathway), rendering the channel relatively unresponsive. A positive input of +4 from the so-called task demand units was used to select one of the two pathways, setting their input to the most responsive state. The network was trained more extensively on the word naming than colour naming, implementing an assumed dominance of one task over the other. The result was stronger weights in the word-naming pathway, an ultimately greater interference of word naming on colour naming than vice versa. This model incorporated the required properties of experience-dependent learning, simulation of response time and accuracy, differential task dominance, and dynamics control structures. The principal aim of our first model was to evaluate whether the switch cost asymmetry could emerge from a model using the simplest implementation of control processes in an experience-based learning system.
Our second model was based on that of Gilbert and Shallice (Reference Gilbert and Shallice2002). This was itself an extension of CDM designed to address task switching. A key modification was the implementation of an analogue of the task carryover account for task switching (Allport et al., Reference Allport, Styles, Hsieh, Umilta and Moscovitch1994; Allport & Wylie, Reference Allport, Wylie, Monsell and Driver2000), according to which control states persist in successive trials. In particular, at the beginning of a given trial the initial values of the task demand units were squashed copies of their values in the previous trial. The Gilbert and Shallice model offered a method to simulate switch cost asymmetries. Our goal was to extend it to the language production domain, since the original model did not incorporate any experience-dependent processes. The principal aim of our second model was to evaluate what additional assumptions about the task switch itself needed to be added to model dynamics in order to capture the switch cost asymmetry.
3.3 A developmental model of bilingual naming based on the Cohen, Dunbar and McClelland Stroop model
Training set and architecture
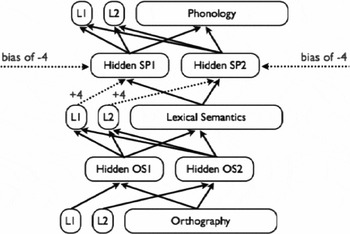
The architecture of the first model is shown in Figure 6. Similar to the original Stroop model, it employs two pathways and a control structure for their selective operation. In the current model, each pathway was dedicated to word production in a given language. For this purpose, the model was configured to map from orthography to lexical-semantics (lemma) and then to phonology, with the control structure operating primarily at the output stage, reflecting the view that comprehension is less selective than production. The architecture was trained as a regular feed-forward network, but tested using the cascade rule, enabling it to simulate response times. The details of the testing procedure are discussed in further detail later in this section.
The architecture of the model 1. Dotted lines indicate constant weights implementing the control structure at the output stage. L1 = dominant language cue, L2 = non-dominant language cue, OS = orthography to semantics, SP = semantics to phonology.

In the original Stroop model, the control structure was implemented by giving the hidden units in each route a resting activation state (sometimes called threshold, or bias) of –4. Task units were able to selectively activate these units, using fixed connection weights of +4, which cancelled out the normal inhibition acting on a non-selected processing route. Automaticity emerged in a route when training produced increases in the weights from input to hidden units strong enough to overcome the resting state inhibition. The current model employed the same control structure as the original Stroop model, using the same values of –4 and +4. However, two key changes were applied. First, the hidden layer was increased in size, to give it the power to acquire the mappings between lemmas and phonological forms. Second, hidden units were given a separate, trainable resting activation state (threshold, bias), because trainable thresholds are required to learn complex mappings.
The control structure was configured to operate primarily in the output stage, in the sense that a constant bias of –4 applied only at the output stage. The input stage had no default inhibitory input to processing channels. Lexical-semantics codes of the two languages were, however, fed into different pathways. We did explore conditions in which a constant bias of –4 applied also to the input stage, but it did not produce markedly different results in the behaviour of the model.
Training set and representations
A training set was constructed using 120 Italian and 120 English words, split between cognates (30 English, 30 Italian), interlingual homographs (30 English, 30 Italian), and singles (60 English, 60 Italian). We were also interested in the role of orthographic cues, and therefore split the singles into two groups: non-specific singles (forms existing in only one language, and with orthographic cues which would be legal in both English and Italian), and specific singles (forms existing in only one language and with orthographic cues which are legal only in that language). This additional dimension allowed the model to produce novel testable predictions about whether orthographic cues should affect switching costs in naming. The words are shown in Appendix III, in supplementary materials online.
Orthographic representations
The orthographic form of words varied from four to six letters. Orthography was encoded in a slot-based scheme with left alignment. Twenty-six localist units were used in each letter position, each representing a letter of the alphabet. There were thus 6 × 26 = 156 orthographic input units.
Phonological representations
The phonological form of words varied from three to seven phonemes and was encoded in a slot-based scheme with left alignment. Each phoneme was encoded on the basis of a distributed code of 28 articulatory features. There were thus 7 × 28 = 196 phonological output units.
The 28-bit distributed phonological code extended the 19-bit articulatory code for English phonemes of Thomas & Karmiloff-Smith (Reference Thomas and Karmiloff-Smith2003) to accommodate Italian phonology (as described in Rogers & D'Arcangeli, Reference Rogers and d'Arcangeli2004). The phonological features are shown in Appendix IV, in supplementary materials online.
The bilingual phonological code distinguished 49 phonemes, 19 vowels and 30 consonants. Of the 49 phonemes, one vowel and six consonants applied only to Italian, 12 vowels and seven consonants applied only to English, while the remaining six vowels and 17 consonants were shared between the two languages. Of course, the distributed scheme meant that vowels and consonants unique to each language shared articulatory similarities to vowels and consonants in the other language. The language-specificity of phonology was therefore a matter of degree.
Lexical-semantics representations
The empirical data did not manipulate degrees of semantic similarity or the effect of semantic similarity on switch cost. The only semantic dimension manipulated was whether a word had the same or different meaning in each language. We therefore simplified the semantic level of the model to a lemma representation, using a single unit to represent the existence of a word meaning in the language. Cognates in the two languages shared the same unit, but interlingual homographs and singles employed different units. There were thus 210 lemma units, corresponding to the 210 word meanings in the training set.
Targeted-language representations
The task paradigm provided language information to the participant as a (colour) cue along with the orthographic form. This cue was represented by two further input units, one signifying each language. The desired language of output involved two further units, one for each language (analogous to the task units in the CDM model). These were connected to separate processing channels.
Training and testing procedures
Training regime
The training time was divided into epochs, and each epoch was dedicated either to the training of the input stage (orthography to lexical-semantics) or the output stage (lexical-semantics to phonology) of the network. The two types of training were selected equiprobably. During each epoch, the network was presented with 240 mappings, selected probabilistically with replacement from the training corpus.
Language imbalance
We wished to simulate different degrees of bilingual imbalance. This was implemented by altering the degree to which the network was exposed to mappings from L1 and L2. Three levels of balance of the two languages were considered: 1:1, 2:1 and 4:1. For the reported simulation results, as with the empirical data, Italian was L1 and English was L2. We also considered simulations in which English was L1 and Italian was L2, to verify that this gave the same pattern of results with respect to switch costs, which it did.
Token frequency
An additional dimension of word frequency was included, with half the words having high frequency and half low frequency within each language and word class. High-frequency words appeared twice as frequently as low-frequency words during training. Frequency effects were not our central concern in this work, and we used them simply to verify expected patterns of accuracy and response speed, i.e., that high-frequency words should be named more accurately and quickly than low-frequency words within each language.
Parameter settings
Models were trained for 1000 epochs using a learning rate of 0.01, a momentum value of 0.0, and a random presentation order with replacement for the mappings. There were 100 hidden units (50 for the Italian and 50 for the English channel) in the input stage (i.e., orthography to lexical-semantics) and 200 hidden units (100 for the Italian and 100 for the English channel) in the output stage (i.e., lexical-semantics to phonology). These parameter settings were determined on the basis of pilot simulations, as they allowed the network to achieve ceiling levels of accuracy in the mappings of the training set within a reasonable number of presentations. Variations of the parameter settings beyond these levels did not have marked effects on the results.
Replications
There were 10 replications with different random seeds. The figures displaying model results incorporate mean and standard error over these replications in order to demonstrate the robustness of the model's behaviour to starting conditions. While variability is reported in the results, we do not report the statistical significance of differences. This is because any sized difference, however small, can be rendered significant by increasing the number of replications. We only discuss differences that were robust to starting conditions.
Cascaded testing
While training was carried out in a single feed-forward pass, testing was carried out in a temporally extended manner using the cascading rule. Activation was allowed to build up gradually and in successive time-steps through the network (see the equation in (2) below, Cohen et al., Reference Cohen, Dunbar and McClelland1990, p. 337; Thomas, Reference Thomas1997a, p. 76). The rate at which activation built up through the network was one of the free parameters of the model (tau), which varied between 0 and 1. The cascade rule allows activation to build up in a feedforward network so that it asymptotes at the value it would have reached in a single pass of calculations using the standard network processing algorithm. For a small value of tau the rate of build-up is slow, while for a large value it is fast. If tau is set to 1, the formula becomes equivalent to calculating hidden and output unit activations in a single processing step. Activation built up in all levels of the network until the activation of the output layer converged to a set level. At a given time-step, the output activation of the network was considered to converge if the Euclidean distance between the output activation in the current and the previous time-step was less than 0.0001% of the size of the current output activation treated as a vector. When the output layer converged, the response was recorded (whether correct or incorrect), as well as the number of time-steps to reach the convergence criterion. For both human and simulation data, reaction times are only reported for correct responses.
Switch trials
Language switching was not included in the training phase, as during training, mappings from L1 or L2 were presented without providing information on the previous status of the language (in the same way that the Stroop model was trained on colour naming or word naming). Switch trials were included in testing and were simulated in the following way. Taking the example of a switch into L1, at the beginning of the trial, the L2 task unit was activated (with value 1) and the L1 task unit was inactive (value 0). Thus, at the beginning of a switch trial, activation began to build up through the network from the orthographic input with the targeted-language units set to indicate L2, instead, of L1 as the target language.
As the trial proceeded, however, the activation pattern of the targeted-language units was altered gradually to indicate L1 as the target language. In particular, the activation on the L2 task unit declined and that on the L1 unit increased according to the following exponential equations (correspondingly):
-
(1) y(x) = 1 − 1/(1 + e − 0.5x )
-
(2) y(x) = 1/(1 + e − 0.5x )
We viewed an exponential change, symmetrical for activation and deactivation, as the simplest function consistent with neural dynamics (McClelland, Reference McClelland1979), but there is no specific empirical data constraining this choice. The decline of the L2 task unit to zero was performed over Ndecline time-steps by sampling Ndecline values from the equation in (1) above. In a similar manner, the increase of the L1 task unit to one was performed over Nincrease time-steps. Ndecline and Nincrease were free parameters in the model. Figure 7 displays the activation of L1 and L2 task units on an L1 switch, for different values of Ndecline and Nincrease.
The values of the targeted-language units during switch trials for different combinations of the Ndecline and the Nincrease parameters.

Because the input was processed for a number of time slices with the inappropriate task output unit compared to non-switch trials, on switch trials we expected there to be a cost in response time and potentially accuracy (depending on details of the response criterion). The number of time-steps depended on the relative speed of build-up of activation from the input compared to the speed at which the activation on the targeted-language units changed, both of which were necessarily free parameters of the model.
Output evaluation
The output of the network consisted of the activation pattern corresponding to the targeted-language information and the activation pattern corresponding to the output phonological form. The former pattern was taken to be correct when the activation of the L1 unit was above (below) 0.5 and the activation of the L2 unit was below (above) 0.5 in L1 (L2) mappings trials. The phonological pattern was compared to the target after the activation in each slot was converted to a phoneme rounding all activation values less than or equal to 0.2 to 0, and all activation values greater than or equal to 0.8 to 1. If a given output pattern included activation values between 0.2 and 0.8 (not sufficiently close to the target phoneme representation), the response was taken to be incorrect.
Results
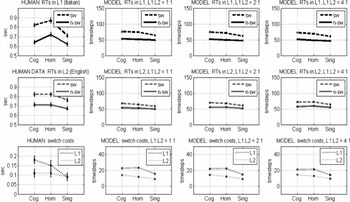
The model learned the training set. In all three conditions for the imbalance between L1 and L2 (1:1, 2:1 and 4:1), the network achieved ceiling levels of accuracy in the mappings of the two languages at the end of training. Figure 8 shows averaged naming times across different word classes for L1 and L2 in switch and non-switch trials. These come from a simulation where the activation build-up parameter tau was 0.25 and the Ndecline and Nincrease parameters were both 50. This condition yielded notable similarities with the empirical switch cost data, though as we shall see, there were also notable differences.
Comparison of empirical data and simulation data from model 1. First column: Response times (RTs) in the experimental task on switch and non-switch trials, for L1 (Italian), L2 (English) and switch costs. Second column: Simulation data for condition with balanced languages. Third column: simulation data for condition with imbalanced languages (L1:L2 = 2:1). Fourth column: simulation data for condition with imbalanced languages (L1:L2 = 4:1). Plots include error bars showing standard error over 10 replications with different random seeds. However, variability was small and thus error bars are not always visible.

In the remainder of this section we examine the output of this simulation together with the target empirical phenomena and discuss possible reasons for which the network succeeded or failed to capture aspects of human behaviour. The comparison focuses on naming times as, unlike the empirical data, accuracy rates were at ceiling for all mappings. Accuracy differences (e.g., between mappings of L1 and L2, different word classes, switch and non-switch trials) could be obtained if the response from the output layer was recorded before activation had reached an asymptote or if the performance of the network was measured at earlier epochs of training.
Imbalance between languages
When the ratio L1:L2 was 1:1, no difference was observed in the response times for naming L1 and L2 words. However, the network simulated faster naming for L1 than for L2 mappings when the imbalance between the two languages was 2:1 and 4:1, and the difference increased with the degree of the imbalance between the two languages.
The model therefore simulated target empirical phenomena 1 and 4. The differences in response times for L1 and L2 mappings stemmed from the differential degree of exposure of the network to these mappings. The weights of the network in the pathway supporting the production of L1 mappings were stronger than the weights of the L2 pathway. As a result, output activation for L1 mappings built up and reached asymptote earlier for L1 than for L2. Indeed, the network achieved ceiling accuracy rates for L1 mappings earlier in training time than for L2 mappings. Within each language, naming was faster and more accurate for high-frequency words than low-frequency words, confirming the role of experience-dependent changes in modulating the behaviour of the model.
Language switching
Switch costs were determined by presenting the full training set first on a non-switch trial and then on a switch trial. Switch and non-switch trials were distinguished by the dynamics of the task units, i.e., according to Figure 7. As shown in Figure 8 (model output plots of the first and second row), response times were higher for switch trials (dashed lines) than non-switch trials (continuous lines). In common with the empirical data (target phenomenon 2) the model reproduced a switch cost in response times. This result demonstrates the viability of the proposal that switch costs in naming result from target-language units being set to inappropriate values at the beginning of switch trials.
Switch cost asymmetry (L1 > L2)
The bottom row of Figure 8 presents switch costs for L1 naming (blue) and L2 naming (red) for the empirical data and the model. As shown in these plots, the model exhibited a difference in switch costs between L1 and L2 that increased in line with the degree of imbalance between L1 and L2, and was absent when the ratio L1:L2 was 1:1. However, the direction of this difference (L2 > L1) was opposite to the empirical data (L1 > L2), signifying the inability of the network to capture asymmetric switch costs as reported in target empirical phenomenon 3 (and therefore necessarily phenomenon 4, variations in the imbalance due to differential relative L1:L2 proficiency). L2 switch costs were higher in the model because during L2 switch trials, there was greater interference on the common phonological output layer from the still-active (but becoming less active) L1 pathway. On L1 switches, the deactivating L2 pathway caused less interference.
Effect of word class on naming times and switch costs
Effects of word class on naming times were also observed. As shown in Figure 8, times were generally lower for singles than cognates and homographs. This pattern was consistent with the empirical data and reflected whether orthographical and lexical-semantics representations were “meaningful” in both pathways of the network, thereby allowing interference between the two languages and increased naming times; or whether they were learnt in a single pathway of the network, thereby resulting in shorter naming times. The effects of word class on responses were more pronounced in switch trials than non-switch trials, as the dynamics of the task demand units served to exaggerate the interference between the two pathways.
More specifically, with respect to the switch trials, the performance costs were greater for cognates and homographs than for singles (similar to the empirical data), while the difference between switch costs in L1 and L2 was more pronounced for singles than for cognates and homographs (unlike the empirical data; note also the opposite direction of the effect, discussed above in the Switch cost asymmetry subsection). These effects were again related to the extent to which orthographic and lexical-semantics representations were meaningful in one or both processing pathways in the model. Singles employed representations which were not shared. Switch trials involving this word type yielded less interference between language and therefore reduced switch costs. Language had a pronounced effect on switch costs within this class because as a single belonged to either L1 or L2, language membership and language imbalance determined the frequency under which the network was exposed to the corresponding orthographic and lexical-semantics representations.
Summary
Based on comparisons between the model and empirical response time data, the results in Figure 8 represent a decent match to the empirical data: the model was successful in simulating the effect of language imbalance in response times, as a result of the asymmetric exposure of the network to L1 and L2 mappings, and switch costs, as a result of the setting of the targeted-language units to inappropriate values. Crucially, however, the model was unsuccessful in simulating larger switch costs into L1 than into L2, and therefore the influence of word class on this pattern. The former limitation was due to the increased interference from L1 in L2 switch trials. The latter limitation was due to the interaction between the presence of two distinct pathways for the processing of L1 and L2 mappings and the overlap of representations across word classes.
Were there any settings of the model's free parameters that would permit simulation of the switch cost asymmetry and its modulation by word class? The main free parameters were the rate of build-up of activation (tau) and the rate of increasing (Nincrease) or decreasing (Ndecline) the activation of language units during a switch. If Nincrease and Ndecline were equal for the change in activation of L1 and L2 language units during a switch, the answer is no. However, if Nincrease and Ndecline were allowed to differ between the language units, the model was able to simulate a larger switch cost for L1. Specifically, when Ndecline(L1) was greater than the other parameters (50 vs. 25), the asymmetric costs were in the right direction. This does not make for a persuasive explanation of the switch cost asymmetry, however, because at this point, the asymmetry would be independent of the relative proficiency levels of L1 and L2. That is, it would arise even if L1 and L2 had equal training. In short, the model cannot produce the switch cost asymmetry as an emergent consequence of the differential proficiency of the two languages in an experience-dependent learning system, combined with the simple control processes drawn from the CDM model.
3.4 A developmental multiple-cues model of bilingual naming based on Gilbert and Shallice (Reference Gilbert and Shallice2002)
Architecture
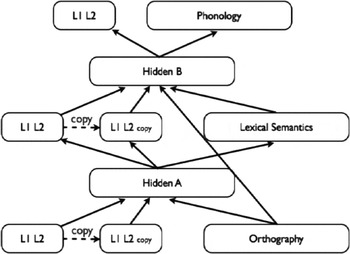
The architecture of the second model of language switching is shown in Figure 9. Similarly to the first model, the network was trained on mappings between orthographic, lexical-semantics, and phonological information, and employed task demand units to determine the output language. However, in the current model the following four modifications were introduced:
The architecture of the model 2. Dashed lines indicate copies of the targeted-language units in the previous trial.

-
1. The use of distinct processing pathways for the two languages was eliminated, and therefore all mappings were learnt in the same (single) route. This property was introduced to ensure that the representations at the hidden layer between orthography and lexical-semantics of two words corresponding to the Italian and the English version of a homograph would overlap. In a similar manner, the representations at the hidden layer between lexical-semantics and phonology of two words corresponding to the Italian and the English version of a cognate would also overlap. This allowed word class effects on switching costs to arise through partial overlap of representations.
-
2. There were connections between the orthographic input and the phonological layer. This manipulation aimed to make the pattern of partial overlap between representations of different word classes even more explicit, and reflected the direct naming route included in the Seidenberg and McClelland (Reference Seidenberg and McClelland1989) reading model.
-
3. As with the first model, control structures were implemented using task demand units that provided a cue on the language that the model should output. However, on the basis of the model of Gilbert and Shallice (Reference Gilbert and Shallice2002), the values of the task demand units were conditioned by their values in the previous trial. Gilbert and Shallice implemented this “carryover” effect by setting the values of the task units to some proportion of their value in the previous trial. This manipulation was also used for implementing switch trials. In the current model we duplicated the task demand units layer; the additional task demands unit kept a copy of the task demand units activation in the previous trial.
-
4. As the presence of connections between orthography and phonology was combined with the use of a copy of the activation pattern of the task demand units in the previous cycle, the output stage of the network presented a multiple-cues architecture (Karaminis & Thomas, Reference Karaminis, Thomas, Ohlsson and Catrambone2010; Thomas & Karmiloff-Smith, Reference Thomas and Karmiloff-Smith2003). Different types of information, i.e., orthography, lexical-semantics, and targeted language in the current and the previous training cycle were presented as input to the hidden units of the output stage. The network's task was to learn how to weight these cues together to produce the appropriate response.
Training set and representations
The training set and the representational schemes for the different types of information were identical to those of the first model. As in the previous model, there was no explicit training on switch trials, although for this model, the training set included (within language) task carryover effects.
Training and testing procedures
Models were trained for 1000 epochs with a learning rate of 0.01, a momentum of 0.0, and a random presentation order with replacement for the mappings. The training and testing procedures were similar to that of the first model, apart from minor modifications applied to accommodate the changes introduced in the second model. The most important of those changes concerned the implementation of switch trials. These were implemented by combining the language switching mechanism of the previous model (Figure 7) with the use of two pairs of task demand units. In particular, a switch trial was implemented as follows. Taking the example of an L2 switch, the network was initially set to an L1 non-switch mode, i.e., both the L1–L2 units and the L1–L2 copy units of Figure 9 were set to denote L1 as the target language. Thus, the L1–L2 units were set to the value [1 0], while the L1–L2 copy units were given the value [0.5 0]. As the trial proceeded, the activation of the L1–L2 task demand units was reversed exponentially (recall equations in (1) and (2) above), so that the network progressed gradually to an L2 switched state. The copy units, however, retained their value throughout the trial, since they represented information from the previous control state.
Results
Figure 10 shows response times in the network in a simulation where the activation build- up parameter was 0.25, while the Ndecline and the Nincrease parameters of switch trials were set to 50.
Comparison of empirical data and simulation data from model 2. First column: Response times (RTs) in the experimental task on switch and non-switch trials, for L1 (Italian), L2 (English) and switch costs. Second column: Simulation data for condition with balanced languages. Third column: simulation data for condition with imbalanced languages (L1:L2 = 2:1). Fourth column: simulation data for condition with imbalanced languages (L1:L2 = 4:1). Plots include error bars showing standard error over 10 replications with different random seeds. However, variability was small and thus error bars are not always visible.

In the remainder of this section, we identify and discuss similarities and differences of the output of this model in relation to the previous model and the target empirical phenomena. The section concludes with a prediction of the model with regard to the effect of orthographic cues on naming switch costs.
Imbalance between languages
Similarly to the model presented in the previous section, the current model learned the training set and exhibited faster response times for L1 than for L2, with this difference increasing as the imbalance between the two languages increased. Thus, the model simulated the target empirical phenomena 1 and 4. Again, the difference in L1 and L2 response times was a result of the asymmetric exposure of the network to L1 and L2 mappings, i.e., it was a frequency effect. A difference in naming high-frequency and low-frequency words was also observed within each language. Thus the use of a common representational resource did not alter the model's ability to capture these patterns.
Language switching and switch cost asymmetry
As with the first model, the control dynamics once more simulated a cost of switching between naming in each of the languages. In contrast to the first model, the second model was also able to simulate increased switch costs for L1 compared to L2 when the languages were imbalanced. These are shown in the third row of Figure 10. The degree of language imbalance determined the degree of asymmetry.
An inspection of Figure 10 suggests that the simulated asymmetry reflected primarily a drop of L2 switch costs as language imbalance increased. It was the result of an increase in naming times in non-switch L2 trials, which was more pronounced than a similar increase in naming times of switch L2 trials, as well as decreases in times related to L1 switch and non-switch trials. The main reason for the presence and the size of this increase for L2 non-switch trials was the extremely low frequency of L2 non-switch mappings in the training set. For example, when the language imbalance was 4:1, L2 non-switch trials corresponded to only 4% of the mappings. This protracted the rate at which activation built up in these mappings, resulting in naming times that were closer to those of switch trials, i.e., reduced L2 switch costs.
More generally, the switch cost asymmetry arose in the model because of the presence of carryover activation on the task demand units. The cues to language input were less salient on L1 switches (since they held a carryover of weaker L2 information) than on L2 switches, and therefore less able to reduce the competition arising on a switch trial. The second model contained two changes compared to the first model, with respect to switch trial dynamics, and with respect to architecture, in the form of direct orthography–phonology connections. We ensured that the switch cost arose from the former assumption by omitting the carryover activation on the language units. The asymmetric switch costs disappeared. When the contribution of the orthography–phonology route was eliminated, there was no alteration in the switch cost pattern.
Word class effects
Model 2 was also able to simulate effects of word class. As shown in the first and second rows of Figure 10, the model simulated faster response times for naming singles than cognates and homographs. These effects arose due to the shared representational resources for the languages, in which competition for the correct phonological output had to be resolved for cognates and homographs but not for singles. Importantly, this model also simulated the interaction of the asymmetry with word class, whereby cognates and homographs showed exaggerated asymmetries compared to singles. This is because the more ambiguous language information on L1 switch trials compared to L2 switch trials (see above, section “Language switching and switch cost asymmetry”) additionally delayed resolution of the competition. Notably, however, the model still predicted a switch cost asymmetry for singles, whereas none was observed in the empirical study.
Prediction on the role of orthographic cues in language switching
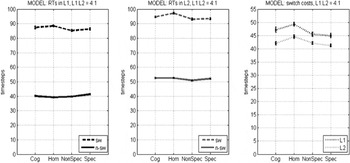
It is important for computational models to go beyond simulating existing empirical data and make novel testable predictions. The prediction of the model on the effect of orthographic cues on switch cost asymmetry is summarised in Figure 11. This figure shows the output of the simulation with a language imbalance ratio of 4:1 including the distinction between specific and non-specific singles. Although the differences are small, the model generated the following two predictions: (i) response times will be faster for non-specific singles, due to the higher degree of exposure of the network to patterns that are orthotactically legal in both languages – this was a greater influence on performance than any phonological inconsistency; and (ii) specific singles will have reduced switch costs, because, as the target word has orthographic cues of only the target language, there is less competition to be resolved from the non-target language during the switch trial. These (to our knowledge) unique predictions remain to be tested empirically.
Novel predictions from model 2. Panels show response times for switch and non-switch trials, where Singles have been split between those without and with language-specific orthographic cues, for the balanced condition and the imbalanced condition with L1:L2 of 2:1 and 4:1 respectively. The model predicts faster response times for non-specific than for specific Singles and slightly lower switch costs for specific Singles. (Cog = cognates, Hom = homographs, Nonspec = singles with no language-specific orthographic cues, Spec = singles with language-specific orthographic cues).

4. Discussion
Our studies focused on the control of the bilingual's languages during a production task using a language-switching paradigm. Language switching has mostly been studied in the context of comprehension tasks, where time and accuracy costs of switching have been observed. In production, studies have been confined to numeral naming (Meuter & Allport, Reference Meuter and Allport1999) and picture naming (Costa & Santesteban, Reference Costa and Santesteban2004). The principal observation of these studies was that there was a time cost in cued switching between languages, and an asymmetry of switch costs, where a larger cost was observed for the bilingual to switch into their more dominant language. In the current study, we extended this method to word naming. Italian–English bilinguals were required to switch between naming words in their two languages, cued by the colour of the background on which the words were presented. We additionally introduced the variable of word class, where words could exist in both languages (either having the same meaning, i.e., cognates, or different meanings, i.e., homographs), or exist in just one (singles). The manipulation of word class was intended to modulate competition effects between the languages, and our interest was whether this interacted with the time costs of switching language.
Our results replicated those of Meuter and Allport (Reference Meuter and Allport1999) and Costa and Santesteban (Reference Costa and Santesteban2004), with a larger time cost observed to switch into naming in the bilinguals’ more dominant language (Italian). This asymmetry depended on L2 proficiency and was larger when the imbalance between the languages was greater. Overall, cognates and homographs were named more slowly than singles despite being matched within language on psycholinguistic variables of length, frequency, and concreteness. This suggests that, at least within this experimental paradigm, a competition had to be resolved to produce the language-appropriate form. In addition, the interaction between switch cost asymmetry and word class indicated that cognate status exaggerated the switch cost asymmetry. There was no asymmetry, however, for singles. The interaction of cognate words with the asymmetry implicates between-language competition as a cause of the switch cost.
A qualitative analysis of error types was then carried out, with errors forming 4% of all responses. Errors mainly arose for cognates and homographs (92%). The analysis revealed a trend for more lexical errors (i.e., the language of utterance in the non-target language) when there was a switch, and particularly when the switch was into L1. These errors are consistent with stronger inhibition of L1 when performing the task in the weaker L2, an inhibition that carries over during a switch into L2. As far as sublexical errors were concerned (i.e., mixed-language utterances), they occurred randomly across trials and languages. Errors of this type have been previously reported in the literature of code-switching (e.g., de Bot, Reference de Bot1992; Poulisse & Bongaerts, Reference Poulisse and Bongaerts1994). Their occurrence is attributed to a single mechanism, the articulator, which is involved in the selection of phonemes. It is therefore hypothesised that L1 and L2 phonological representations are stored in a single network and tagged for language, as with lexical items (Poulisse, Reference Poulisse1999; Poulisse & Bongaerts, Reference Poulisse and Bongaerts1994). However, it should be noted that Grosjean and Miller (Reference Grosjean and Miller1994) did not find any specific phonological intrusion of one language when switching into the other using a more naturalistic experimental setting. Participants asked to read English and French passages with controlled language switches did not show any phonetic carryover effect when switching between languages. Sublexical errors may to some extent be the result of less naturalistic experimental designs where the tight pace of the task is the principal cause for slip-of-the-tongue effects, as it may occur to a monolingual speaker.
We then turned to computational modelling as a means to clarify what assumptions about control processes would be sufficient to explain the empirical data. The key requirements of our model were that it should be able to simulate word-naming (i.e., a mapping between orthography and phonology); it should include lexical-semantics representations that could distinguish between words existing in both languages that did or did not share the same meaning (i.e., between cognates and homographs); it should acquire its abilities – and especially its relative language dominance – through an experience-dependent learning process; it should have control structures that modulate the language of output and thus permit switching between languages; and that it should simulate asymmetries in language switching as emergent effects, rather than through asymmetries built into the assumptions of the control processes within the model (see Appendix II).
We began with what we believed was the simplest model that incorporated these requirements. This was an extension of the Cohen et al. (Reference Cohen, Dunbar and McClelland1990) model of the Stroop task. The CDM model employed separate, experience-dependent processing channels for word-naming and colour-naming, and task units to modulate their activity. Minimal changes were made to this model, to allow it to learn mappings between orthography, lexical-semantics, and phonology for a set of Italian and English words, and to permit the dynamic changes of control involved in a language switch. This model was successful in learning to name words in two languages via separate channels, and name words more quickly in L1 than L2 where the language dominance was imbalanced. Switching language also incurred a time cost. However, the model did not successfully simulate the direction of the asymmetry in switch costs, because (in line with the Stroop effect), interference was greater from dominant to non-dominant task, impacting L2 switches more than L1. And the model exhibited relatively weak word class effects, since the impact of cross-language similarity was attenuated by separating the languages into separate processing channels, an assumption inherited from the CDM model. Further or different assumptions were evidently required to simulate our empirical data.
We then drew inspiration from two further models. First, the Gilbert and Shallice (Reference Gilbert and Shallice2002) model of task switching incorporated assumptions that enabled it to simulate the task switching asymmetry as it appears in a switching version of the Stroop task (a greater cost to switch into word-naming than colour-naming). Their model implemented the “carryover” account of switching costs, i.e., that switch costs represent interference from a carryover of the previous task set into switch trials (Allport et al., Reference Allport, Styles, Hsieh, Umilta and Moscovitch1994; Allport & Wylie, Reference Allport, Wylie, Monsell and Driver2000). Second, the multiple-cues approach to language acquisition argues that, in line with the interactivity of language systems, all information potentially relevant for driving the output should be provided to a common representational resource, and the network should be allowed to utilise whatever information it needs via an experience-dependent learning processing (Karaminis & Thomas, Reference Karaminis, Thomas, Ohlsson and Catrambone2010). The model now reproduced the correct asymmetry in switch costs (greater in L1 than L2), which depended on the degree of language imbalance, word class effects, and the interaction between these factors. The switch asymmetry arose because the cues to language input were less salient on L1 switches (since they were a carryover of weaker L2 information) than on L2 switches, and therefore less able to reduce the competition arising on a switch trial. The word class effects arose due to the common representational resources used for naming in each language (Thomas, Reference Thomas, Bullinaria, Glasspool and Houghton1997b; Zhao & Li, Reference Zhao and Li2010), and the fact that greater competition had to be resolved in these shared resources for cognates and homographs than for singles. The factors interacted since they both modulated competition effects in naming.
The results of the empirical and computational studies support the idea that switching effects and word class effects in naming arise from competition effects between the bilingual's two languages during production, and the resolution of this competition, per Green's (Reference Green1998) Inhibitory Control Model. However, the error analysis of the empirical study suggests that competition effects can occur (or be resolved) at both lexical-semantics and phonological levels, leading to, respectively, lexical and sub-lexical errors. The modelling work was designed to capture reaction time data at ceiling accuracy levels, rather than error patterns, and so did not investigate the locus of different possible error types.
It should be noted that some authors argue against the presence of competition between the bilingual's languages during production beyond the conceptual level, with apparent interference effects from the non-target language reflecting only the natural flow of activation (Costa, Reference Costa2005; Costa, Miozzo & Caramazza, Reference Costa, Miozzo and Caramazza1999; Finkbeiner, Gollan & Caramazza, Reference Finkbeiner, Gollan and Caramazza2006; see Wu & Thierry, Reference Wu and Thierry2011, for discussion). Second, the carryover account of switching costs is not the only account. Some authors argue that the performance cost of switching arises from the operation of an exogenous control processing, that is, a resetting of a task set triggered by the stimulus itself (e.g., Monsell, Yeung & Azuma, Reference Monsell, Yeung and Azuma2000). Last, Finkbeiner, Almeida, Janssen and Caramazza (Reference Finkbeiner, Almeida, Janssen and Caramazza2006) found that switch costs (and asymmetries) in naming may have some task specificity – if while switching between naming numerals in each language, participants were asked to name pictures always in L1, no switch costs were observed, even if they had just been naming a numeral in L2. The task schema controlling L1 versus L2 competition may therefore involve specifics of the task set-up, whereby in the aforementioned paradigm, L2 was never in competition to respond to pictures and so no switch costs arose (but see also Abutalebi & Green, Reference Abutalebi and Green2008, for a different view).
Our use of computational modelling to complement the empirical study illustrates how implementation can clarify theoretical proposals and test their sufficiency to explain empirical data (Li, Reference Li2013; Thomas & Van Heuven, Reference Thomas and Van Heuven2005). Implemented models can also generate novel predictions, as they did here. In this case, our second model predicted that, for bilinguals switching between naming words with language-specific orthographic cues, word naming should be slower compared to words with orthographic cues common to both languages; however, switch costs should be smaller, as language-specific cues reduce competition effects. This novel prediction remains to be empirically tested.