


In the late 1990s, the World Bank Institute and the Research Department of the World Bank initiated a longstanding research program on governance indicators. At that time, virtually no internationally comparable measures of governance or corruption existed (International Bank for Reconstruction and Development/The World Bank 2006). Since 1996, Daniel Kaufman and Aart Kraay, with the assistance of Pablo Zoido-Lobaton and Massimo Mastruzzi, have been developing six governance indicators called the Worldwide Governance Indicators (WGI), which are now available biannually since 1996 and annually for the five-year period between 2002 and 2006. The data for the WGI is itself a composite data index organized through an aggregation methodology. Recently this methodology has been sharply criticized by scholars. This paper analyzes the critiques as well as the WGI's authors' responses to them and suggests possible solutions to the field.
WORLDWIDE GOVERNANCE INDICATORS
The WGIs capture six dimensions of governance: voice and accountability, political stability and absence of violence, government effectiveness, regulatory quality, rule of law, and control of corruption (Kaufman, Kraay, and Mastruzzi Reference Kaufman, Kraay and Mastruzzi2007a). In short, these authors define the WGI as follows:
-
1. Voice and accountability: the extent to which a country's citizens are able to participate in selecting their government, as well as freedom of expression, freedom of association, and a free media.
-
2. Political stability and absence of violence: perceptions of the likelihood that the government will be destabilized or overthrown by unconstitutional or violent means, including political violence and terrorism.
-
3. Government effectiveness: the quality of public services, the quality of the civil service and the degree of its independence from political pressures, the quality of policy formulation and implementation, and the credibility of the government's commitment to such policies.
-
4. Regulatory quality: the ability of the government to formulate and implement sound policies and regulations that permit and promote private sector development.
-
5. Rule of law: the extent to which agents have confidence in and abide by the rules of society, and in particular the quality of contract enforcement, the police, and the courts, as well as the likelihood of crime and violence.
-
6. Control of corruption: the extent to which public power is exercised for private gain, including both petty and grand forms of corruption, as well as “capture” of the state by elites and private interests.
Several hypotheses can be formulated by applying these concepts. Here are two of them:
-
1. In a country where there is no voice and accountability, it may be hard to pressure public administrators to be accountable to the public. As a result, it is hard to control corruption.
-
2. In the same vein, in a country where the quality of the bureaucracy is high, there may be fewer opportunities for corruption.
These theories can be tested by running ordinary least square (OLS) regression using the WGI data available at http://www.govindicators.org along with other independent variables. However, the results will never be highly reliable (i.e., 99% confident) because the WGI data are based on perceptions and is itself an aggregate figure. Below I statistically describe the indicators and the methodology used by Kaufmann, Kraay, and Mastruzi to measure governance.
STATISTICAL DESCRIPTION OF THE DATA
The data for the WGI are a composite data index. The data are based on surveys of firms and individuals, as well as the assessments of commercial risk rating agencies, nongovernmental organizations, and a number of multilateral aid agencies. They cover more than 200 countries for 1996, 1998, 2000, 2002, and 2003–06 (a sample of questions and issues included in the surveys evaluating the WGI is listed in Table 1).
Selected Survey Questions and Topics Used by the WGI Data Sources
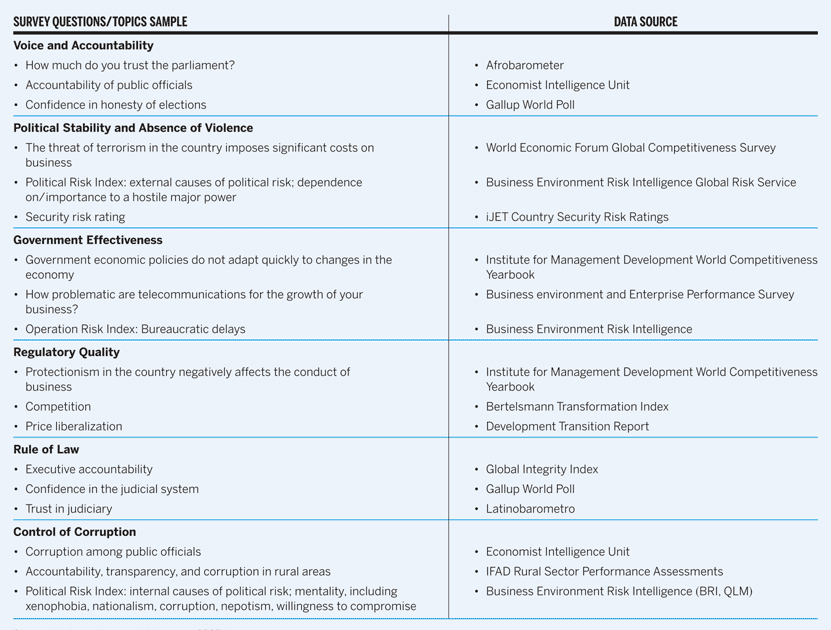
Source: Kaufman, Kraay, and Mastruzzi (Reference Kaufman, Kraay and Mastruzzi2007a)
The data include more than 300 individual variables provided by more than 30 organizations measuring the WGI. Each of those organizations has its own methodology and scale. Kaufman, Kraay, and Mastruzzi normalize these scores into a 0–1 scale to be comparable and then use them to produce the normally distributed indicators (i.e., aggregate indicators) detailed in the Governance Matters VI (Kaufman, Kraay, and Mastruzzi Reference Kaufman, Kraay and Mastruzzi2007a).
The estimates for each indicator are then the result of a maximum likelihood function and therefore are normally distributed (i.e., standardized to mean zero and unitary standard deviation). As such, 99% of the values are between −2.5 and 2.5 with higher scores corresponding to better outcomes (Kaufman, Kraay, and Mastruzzi Reference Kaufman, Kraay and Mastruzzi2005). For instance, in the Governance Matters VI report (Kaufman, Kraay, and Mastruzzi Reference Kaufman, Kraay and Mastruzzi2007a, Appendix C, Table C6: Control of Corruption), countries such as Finland (2.57), Iceland (2.46), Denmark (2.39), and Sweden (2.24) get good positive scores indicating that they are doing well in controlling corruption. In contrast, countries such as Equatorial Guinea (−1.53), Afghanistan (−1.47), Turkmenistan (−1.28), and Central African Republic (−1.06) obtain negative scores indicating that they are doing poorly in controlling corruption. Those scores may vary from one year to another depending on many factors such as successful implementation of policies on public sector reforms and anticorruption plans.
The methodology for obtaining the WGI scores such as those described above has been sharply criticized by scholars. The critiques address a variety of issues, which are briefly described below.
MAJOR CRITIQUES OF THE WGI
The critiques were explicitly made in four recent papers: Arndt and Oman (Reference Arndt and Oman2006), Knack (Reference Knack2006), Kurtz and Shrank (Reference Kurtz and Shrank2007), and Thomas (Reference Thomas2007). They address three main topics: (1) the aggregation methodology (e.g., the difficulty for making reliable comparisons of governance over time and across countries), (2) the independence of the assessments of governance provided by WGI's different data sources as well as access to that data, and (3) biases in the individual indicators (i.e., WGI are influenced by the level of development of a country).
Critiques Group 1
In brief, the first group of critiques points out that the aggregation methodology does not allow us to make comparisons of governance over time and across countries. In this regard, Arndt and Oman claim that governance cannot be compared across countries or over time with the WGI data since the estimates for governance for different countries or periods may be based on different underlying data sources. While Kaufman, Kraay, and Mastruzzi (Reference Kaufman, Kraay and Mastruzzi2007b) find this point factually correct, they reject it by arguing that in fact the aggregation methodology (used to construct the WGI) makes it possible to compare governance in these countries, despite the lack of common sources. Moreover, Kaufman, Kraay, and Mastruzzi maintain that the aggregation methodology provides a sophisticated way of placing very different underlying data sources into common units. They argue that this is precisely what permits comparisons across countries that do not appear in the same sources. Kaufman, Kraay, and Mastruzzi (Reference Kaufman, Kraay and Mastruzzi2007b) illustrate this point with the following particular case: Suppose one wants to compare corruption in the Bahamas with Saint Kitts and Nevis in 2000. Both countries appear in non-overlapping sets of underlying sources within the World Bank's data sources for corruption in 2000—the Bahamas in the International Country Risk Guide ratings (http://www.prsgroup.com) and Saint Kitts and Nevis in the Country Policy & Institutional Assessments ratings (http://www.wordbank.org). In this specific case, Kaufman, Kraay, and Mastruzzi (Reference Kaufman, Kraay and Mastruzzi2007b) argue that the aggregation methodology provides a way of putting the scores from these very different agencies into common units and permits comparison between them despite the absence of a common data source. This is, of course, subject to margins of error but Kaufman, Kraay, and Mastruzzi list them in the WGI report. Nevertheless, the main problem here is that both sources, the International Country Risk Guide and the Country Policy and Institutional Assessments, use different perspectives to measure corruption. While the former focuses more on the political aspect of corruption (i.e., political corruption), the latter looks at the administrative aspect of corruption (i.e., administrative corruption).
Related to the same issue about underlying data, Knack argues that since each underlying data source measures a somewhat different concept of corruption, the implicit definition of corruption changes overtime when we compare two countries with different sets of underlying data sources (Reference Knack2006). This issue is critical because the control of corruption indicator may have been measuring issues that conceptually are not corruption itself. However, Kaufman, Kraay, and Mastruzzi (Reference Kaufman, Kraay and Mastruzzi2007b) claim again that since the aggregation method put different data sources in common units it can make it possible to compare corruption in different countries and concepts. They illustrate it with the following example: Suppose one data source measures corruption in procurement, while another measures corruption in the judiciary, and suppose we want to compare one country that appears only in the one indicator with another that appears only in the other indicator. The aggregate indicator extracts the common component of these sources and then includes them in the overall definition of corruption (i.e., control of corruption). This is the implicit definition of corruption, which comes from the aggregation of the many data sources across many countries.
The shortcoming of the aggregation methodology is that it does not allow us to distinguish between the several dimensions of each WGI. For instance in the case of the control of corruption indicator, bribery, kickbacks, gifts, delays, etc. all are labeled control of corruption. It would not be surprising if within this indicator there might be several issues, which are in fact not corruption but something else. Moreover, while one thing is corruption in one country it may not be the same in another country (Rose-Ackerman Reference Rose-Ackerman1999). The aggregation model may not be able to control for this situation since it counts as corruption every issue recorded under the aggregate indicator control of corruption. Thus, we can not be sure of what we are actually measuring. A general concept of corruption may not capture particular perceptions of corruption in a given country.
One possible solution for the issues detailed above could be to disaggregate the data for a given indicator by identifying the individual data sources. These data are actually available on the WGI Web site. Nevertheless, a number of the individual data sources use unclear or vague indicators to measure corruption (e.g., Business Environment Risk Intelligence, Global Insight Global Risk Service, Economist Intelligence Unit, Global Integrity Index, Gallup World Poll, International Fund for Agricultural Development [IFAD] Rural Sector Performance Assessments, and Merchant International Group Gray Area Dynamics). See Table 1.
Critiques Group 2
This group of critiques addresses the issues related to the transparency of the information provided by the different WGI's data sources as well as access to them. Arndt and Oman argue that the WGI's data sources are interdependent. This is critical as one data source missing information for some indicators may take information from another source and so report the same results. Kaufman, Kraay, and Mastruzzi (Reference Kaufman, Kraay and Mastruzzi2007b) recognized this as possible but claimed that if this occurs, the errors made by the two data sources are highly correlated. Thus, the aggregate methodology will account for this issue by establishing a range of errors made by the two data sources. In fact, Kaufman, Kraay, and Mastruzzi (Reference Kaufman, Kraay and Mastruzzi2007a) do publish the margin of error for each indicator, and give an idea of how far the score is from the mean. However, since it is an aggregate indicator, meaning that it is a composite index based on several survey sources, one can never know what is actually causing the error. Nevertheless, one way to find out more about this potential problem and have access to individual data is by contacting the several WGI data sources. Kaufman, Kraay, and Mastruzzi list all data sources for each indicator on the WGI's Web site.
Critiques Group 3
In short, this last group of critiques argues that the WGI are biased towards the perspective of business elites, and that they are influenced by the level of development of a country (i.e., rich or fast-growing countries get better scores simply because they are rich or growing fast). In this vein, Kurtz and Shrank (Reference Kurtz and Shrank2007) point out that in a situation where public bureaucracies are imposing taxes or regulatory demands, businesspeople, especially the elite among them, will likely judge government as burdensome (i.e., impeding progress). On the contrary, where fewer controls (or no controls) exist, they will tend to evaluate the state positively. Thus, estimates of governance based on their perceptions will definitely be biased. In response to this argument Kaufman, Kraay, and Mastruzzi (Reference Kaufman, Kraay and Mastruzzi2007c) claim that they rely not only on views of businesspeople but also on non-corporate organizations and individuals. They report that their data sources include four cross-country surveys of firms, seven commercial risk rating agencies, three cross-country surveys of individuals, six sets of ratings produced by government and multilateral organizations (e.g., the World Bank and the U.S. State Department), and 11 data sources produced by a wide range of nongovernmental organizations (e.g., Freedom House, Reporters without Borders). However, more important than the number of surveys of corporate or non-corporate organizations is whether there are fundamental differences between the perceptions of businessmen and those of other members of society as to what constitutes good governance. As mentioned above, for business people good governance might mean low taxes and minimal regulation (e.g., free trade) while the public demands reasonable taxation and appropriate regulations (e.g., import inspections). So, what is actually good governance? The bias will still persist and may influence the final score for each WGI.
Regarding the argument about the influence of economic development on the WGI, Kurtz and Shrank argue that indicators measuring perceptions of probity and efficacy of the bureaucracy (i.e., government effectiveness) are significantly correlated with recent economic performance. Based on their original equation and ordinary least square (OLS) regression analysis, Kurtz and Shrank find a strong linkage between reported government effectiveness and previous rates of economic growth. According to this, rich countries, or countries recently enjoying improvement in economic performance, may be receiving better ratings in government effectiveness. This is a critical point and so Kaufman, Kraay, and Mastruzzi took it seriously and wrote a separate paper in response. In short, Kaufman, Kraay, and Mastruzzi (Reference Kaufman, Kraay and Mastruzzi2007c) replicated the regression model run by Kurtz and Shrank and also expanded the sample of countries to 150. They found only six cases where economic growth was significantly and positively correlated with government effectiveness, seven cases where the correlation was significant but negative, and the remaining cases were not significantly correlated.
The point made by Kaufman, Kraay, and Mastruzzi (Reference Kaufman, Kraay and Mastruzzi2007b) sounds strong but some real cases show that indeed governance indicators, especially the government effectiveness indicator, are significantly correlated with economic indicators. I will give just a couple of examples using data from “Governance Matters VI” (Kaufman, Kraay, and Mastruzzi Reference Kaufman, Kraay and Mastruzzi2007a, Appendix C, Tables C3 and 4). In 2004, Fiji got −0.65 in the regulatory quality indicator, which is only one indicator within the six WGI measuring the economic dimension, and −0.49 in the government effectiveness (i.e., good public service) indicator. However in 2005, Fiji obtained −0.41 in the regulatory quality indicator and −0.09 in government effectiveness. This shows that Fiji got a better government effectiveness score when performing a little better in regulatory quality. Vanuatu, another island in the South Pacific, makes an even better case for this point. In 2004, Vanuatu obtained −0.44 in regulatory quality and −0.64 in government effectiveness. But in 2005 Vanuatu got 0.01 in regulatory quality and −0.32 in government effectiveness. Vanuatu got a better government effectiveness score when performing better in regulatory quality. In contrast, in 2006 Vanuatu got −0.12 in regulatory quality and −0.39 in government effectiveness. Vanuatu's government effectiveness score decreased as its regulatory quality also decreased. The correlation looks strong between these two indicators. Nevertheless, it may also be the case that an increasing score in government effectiveness is due not only to improvements in economic issues but also to education, health, or other public policies. Thus the concept of good governance goes beyond the term government effectiveness. Although there is no consensus on the definition of effective government, actual effectiveness in government may lead to the achievement of strong institutions that are necessary to reduce corruption.
CONCLUSION
The conceptual and empirical issues on building governance indicators constitute an ongoing project. The accuracy in comparing governance over time and across countries through the aggregate indicators remains somehow unreliable despite the impressive quantitative arguments claimed by Kaufmann, Kraay, and Mastruzzi. Moreover, the WGI are based on perceptions, not actual data. This is mainly due to the difficulty of accurately measuring governance. These limitations of existing cross-country measures of governance emphasize the need to complement cross-country indicators with more detailed and objective data. This may be done for all WGIs except for corruption because most corruption acts are not disclosed or reported. Even where objective measures are available, they provide only imperfect proxies for real conditions.
A more critical issue related to the aggregation methodology used to construct the WGI is that each data source focuses on different concepts or aspects related to each indicator. For instance, in the case of the control of corruption indicator, bribery, kickbacks, administrative corruption, political corruption, gifts, delays, etc. all are labeled control of corruption. The main problem with this is that using a general concept of corruption may not capture particular perceptions of corruption in a country. Hence, it would not be surprising if within this indicator there might be several issues that are in fact not corruption but something else. The aggregation model may not be able to control for this situation since it names as corruption every issue recorded under the aggregate indicator control of corruption.
Therefore, if people decide to use the WGI they should take into account the limitations of the aggregation methodology as described above. For instance, one cannot really know if the final corruption rating is referring to administrative or political corruption. While both are indeed public corruption they have different policy implications. Furthermore, the WGI are somehow correlated to each other. For instance, a better score in the regulatory quality indicator may lead to a higher score in the government effectiveness indicator and vice versa as discussed above. This issue should be further explored as it may wrongly depict the real situation of a country. ■



