

Introduction
Although the presence of depression following stroke has been documented in many studies, the cause and course of the depressive disorder remain the subject of debate (Brown, Hasson, Thyselius, & Almborg, Reference Brown, Hasson, Thyselius and Almborg2012; Bush, Reference Bush1999; Herrmann, Bartels, Schumacher, & Wallesch, Reference Herrmann, Bartels, Schumacher and Wallesch1995; Narushima, Kosier, & Robinson, Reference Narushima, Kosier and Robinson2003; Spencer, Tompkins, & Schulz, Reference Spencer, Tompkins and Schulz1997). What is clear is that the presence of depression in the post-stroke period has significant implications for the wellbeing of the stroke patient, the burden experienced by their familial caregivers, and progress in rehabilitation (Hosking, Marsh, & Friedman, Reference Hosking, Marsh and Friedman1996; Zhang et al., Reference Zhang, Wang, Wang, Bai, Zhou, Wang and Wang2012). The consequences of post-stroke depression are amplified by the fact that treatment of the depression is not uniformly successful (Kneebone & Dunmore, Reference Kneebone and Dunmore2000; Lincoln & Flannaghan, Reference Lincoln and Flannaghan2003).
Wide variation is evident in reports of the prevalence of depression in the acute post-stroke period, with different studies reporting prevalence rates ranging from 10 to 55% (Hosking, Marsh, & Friedman, Reference Hosking, Marsh and Friedman1998). Medium-term (3-month) follow-ups have reported rates of between 20 and 50% (Hosking, Marsh, & Friedman, Reference Hosking, Marsh and Friedman2000). Longer-term follow-ups have reported prevalence rates at 1 year post-stroke from approximately 16% (Astrom, Adolfsson, & Asplund, Reference Astrom, Adolfsson and Asplund1993) to as high as 33% (Robinson, Bolduc, & Price, Reference Robinson, Bolduc and Price1987). A review by Hackett, Yapa, Parag and Anderson (Reference Hackett and Anderson2005) concluded that approximately one-third of stroke patients would experience depression, with the majority of these recovering spontaneously within several months after stroke. However, Gothe et al. (Reference Gothe, Enache, Wahlund, Winblad, Crisby, Lokk and Aarsland2012) concluded that while depression may be most prevalent in the acute (<1 month) period, the frequency remains high several years later.
Irrespective of the discrepancies in reported prevalence rates, researchers have consistently attempted to identify factors relating to the occurrence of depression following stroke. Such research efforts are essential to allow for the ready identification of those at greatest risk of developing this debilitating secondary complication to stroke (Hackett & Anderson, Reference Hackett and Anderson2005; Thomas & Lincoln, Reference Thomas and Lincoln2006; Wilz, Reference Wilz2007).
Previous research on demographic variables associated with depression at 1 year post-stroke has reported that while females are more likely to be depressed than males, few other significant relationships are evident (Andersen, Vestergaard, Ingemann-Nielsen, & Lauritzen, Reference Andersen, Vestergaard, Ingemann-Nielsen and Lauritzen1995; Appelros, Stegmayr, & Terent, Reference Appelros, Stegmayr and Terent2010; Astrom et al., Reference Astrom, Adolfsson and Asplund1993). Investigation of the possible role of medical variables has found that previous stroke is a risk factor for the development of depression following a subsequent stroke (Andersen et al., Reference Andersen, Vestergaard, Ingemann-Nielsen and Lauritzen1995). Although still debated, the majority of research during the past two decades indicates that depression is not consistently related to the hemispheric location of the lesion at 1 year post-stroke (Andersen et al., Reference Andersen, Vestergaard, Ingemann-Nielsen and Lauritzen1995; Astrom et al., Reference Astrom, Adolfsson and Asplund1993; Parikh, Lipsey, Robinson, & Price, Reference Parikh, Lipsey, Robinson and Price1987; Robinson & Price, Reference Robinson and Price1982).
Previous research on the relationship between physical impairment and the presence of depression in the chronic post-stroke period has been inconclusive. There is consistent evidence that functional impairment is related to depression (e.g., Gothe et al., Reference Gothe, Enache, Wahlund, Winblad, Crisby, Lokk and Aarsland2012), and Brown et al. (Reference Brown, Hasson, Thyselius and Almborg2012) reported that functional independence was consistently associated with depression across the acute (1–3 weeks), medium (3 months) and chronic (1 year) periods following stroke. However, other researchers have noted that the relationship is weaker in the chronic stage than in the acute or medium-term periods following stroke (Andersen et al., Reference Andersen, Vestergaard, Ingemann-Nielsen and Lauritzen1995; Astrom et al., Reference Astrom, Adolfsson and Asplund1993; Parikh et al., Reference Parikh, Lipsey, Robinson and Price1987). This weakening of the relationship over time may be due to either recovery of physical functioning or adaptation and compensation to physical impairment. A similar explanation of either recovery of function or compensation may explain previous reports of an absent or only weak relationship between cognitive impairment and depression at 1 year post-stroke (Andersen et al., Reference Andersen, Vestergaard, Ingemann-Nielsen and Lauritzen1995; Downhill & Robinson, Reference Downhill and Robinson1994; Parikh et al., Reference Parikh, Lipsey, Robinson and Price1987).
Therefore, although up to a third of patients may still experience depression at 1 year post-stroke, it is unclear whether those factors which are related to depression in the early periods following stroke still have predictive power in the chronic phase. A clear understanding of the relationship between possible predictors and depression in the chronic period following stroke is an obvious requirement to improving the efficacy of any treatment procedures that may be considered for older adults still experiencing depression many months following their stroke (Brown et al., Reference Brown, Hasson, Thyselius and Almborg2012).
One of the limitations of previous research is the narrow range of variables that have been considered as possible predictors of depression following stroke. While a variety of variables has been considered across studies, many individual studies only consider a small number of variables. This does not permit a comparison of the relative predictive power of different variables nor an understanding of the possible cumulative impact of multiple variables. Wilz and Barskova (Reference Wilz and Barskova2007) provide evidence of the broad range of factors that may be related to the presence of depression at 1 year following stroke, and their results support the adoption of a comprehensive biopsychosocial model of post-stroke depression. Similarly, Lincoln et al. (Reference Lincoln, Brinkmann, Cunningham, Dejaeger, De Weerdt, Jenni and De Wit2013) have demonstrated that depression can develop late (5 years) after stroke with early (<6 months) stroke-related variables having little predictive power. This again demonstrates the wide, and possibly evolving, range of variables that need to be considered as predictors of depression at different stages following stroke.
The purpose of the current study was to document the prevalence and predictors of depression at 1 year following stroke in a group of older (>59 years) adults. The impacts of the disabilities that can result from brain injury can vary as a function of age (Marsh & Whitehead, Reference Marsh and Whitehead2005). Different tasks are associated with different stages of the human life cycle (e.g., completing an education, career, child rearing, etc.) and to better understand the relationship between disability and depression a sample which was homogeneous with respect to life stage (i.e., older adults) was chosen. Four different types of predictor variables – demographic, medical, physical and cognitive – were considered in an attempt to provide a more comprehensive coverage of possible factors relating to depression at 1 year after stroke and thereby provide results which may directly inform planning for possible interventions.
Methods
Subjects
The stroke sample was selected from consecutive admissions, over a 12-month period, to Waikato Hospital for ischaemic stroke or intracerebral haematoma. Criteria for inclusion in the study were: (1) at least 60 years of age at the time of the stroke; (2) occurrence of stroke confirmed by medical examination and/or computed tomography (CT) scan; (3) willing and able to provide consent; and (4) no recent (i.e., past 10 years) history of psychiatric treatment. The criteria for the medical examination to confirm stroke were based on clinical signs (hemiplegia or ataxia in the case of cerebellar stroke, dysphasia, hemianopia) which lasted longer than 24 hours and for which there was no other explanation (e.g., side-effects of medication, transient ischaemic attack, etc.). A total of 103 patients were selected for inclusion in the study.
At the 1-year follow-up, 20 of the 103 stroke patients originally selected for inclusion in the study were deceased, 7 patients were either unable or unwilling to take part in the follow-up assessment, and 2 patients were currently receiving medication as treatment for depression. Two further patients were excluded as they had been admitted to hospital as a result of a subsequent stroke since the initial assessment. Screening for the presence of aphasia was undertaken by administration of the short-form of the Minnesota Differential Diagnosis of Aphasia Test (Powell, Bailey, & Clark, Reference Powell, Bailey and Clark1980). Results of the aphasia test indicated that five patients were too aphasic to provide meaningful responses to the assessment procedures. The remaining 67 patients constituted the final sample for the 1-year follow-up.
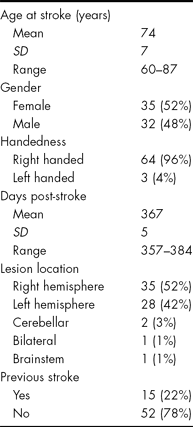
The 67 stroke patients were assessed, on average, at 367 days post-stroke (SD = 5, range = 357–384). The average age of the patients at the time of the stroke was 74 years (SD = 7, range = 60–87). Thirty-five (52%) patients were female and 32 (48%) patients were male. Sixty-four (96%) patients were right-handed, and 3 (4%) patients were left-handed. Fifty-six (84%) patients were retired, 6 (9%) patients were in paid employment and 5 (7%) patients gave their occupation as ‘homemaker’.
Sixty-three (94%) of the 67 stroke patients had CT scans. The CT scans of these 63 patients, and clinical examination of the remaining 4 patients, determined that 35 (52%) patients had right hemisphere strokes, 28 (42%) patients had strokes in the left hemisphere, 2 (3%) patients had cerebellar strokes, 1 (1%) patient had a brainstem stroke, and 1 (1%) patient had a bilateral stroke. For 52 (78%) patients this was their first stroke, 15 (22%) patients had experienced at least one previous stroke, with 2 of these latter 15 patients having had two previous strokes. This demographic information is summarised in Table 1.
Demographic Information of Stroke Population (N = 67)

Measures
Information was obtained from hospital records, and interviews of the patients and their relatives. The selection of psychometric measures was informed by a consideration of their established usefulness in assessing people after stroke and, for the cognitive measures, the availability of suitable normative data. In addition, the battery was designed to be brief but comprehensive so as to avoid fatiguing or distressing the elderly and possibly impaired patients. The following measures were completed for each patient, and these measures are described in detail in Spreen and Strauss (Reference Spreen and Strauss1998) and Wade (Reference Wade1992).
Questionnaires
Level of functional independence due to physical impairment was assessed by administration of both the Barthel Activities of Daily Living (ADL) Index and the Nottingham Extended ADL Index. Both of these measures have demonstrated usefulness in assessing stroke patients. The Barthel is a measure of physical independence in 10 basic self-care activities, and total scores range from 0 to 20 with higher scores reflecting greater independence. The Nottingham is a measure of common daily activities that do not directly involve self-care tasks, such as mobility, kitchen activities, domestic tasks and leisure. Each of the 22 items on the Nottingham was rated on a 4-point scale from 0 (not performing the task) to 3 (performing the task on their own). Assessing both basic and extended activities of daily living is an important aspect of determining functional status following stroke (Chen et al., Reference Chen, Wu, Lin, Chen, Huang, Hsieh and Liu2013).
Oral administration of the Geriatric Depression Scale assessed level of depression. This is a 30-item scale designed specifically to assess depression in the elderly population, and requires respondents to indicate the presence/absence of symptoms based on their feelings in the past week. Total scores range from 0 to 30 with higher scores indicating greater depression. The scale is reliable, with reports of internal consistency ranging from .82 to .94 and test–retest reliability of .80 to .98 over 2 months (Spreen & Strauss, Reference Spreen and Strauss1998). Evidence for the validity of the scale comes from studies of a variety of clinical groups, and evidence for convergent validity has been found with a range of other self-report and rating scales for depression (Spreen & Strauss, Reference Spreen and Strauss1998). Although there is some evidence that the scale may operate differently depending on the language with which it is administered (Kim, DeCoster, Huang, & Bryant, Reference Kim, DeCoster, Huang and Bryant2013) in the current study the scale was administered in its original language, English.
Cognitive tests
The Cognitive Assessment Scale from the Clifton Assessment Procedures for the Elderly (Pattie & Gilleard, Reference Pattie and Gilleard1979) was administered to provide an assessment of basic cognitive functioning. This scale contains three sections assessing information/orientation, mental abilities and psychomotor abilities. The scores from the three sections are totalled and interpretation of overall performance is provided by the use of cut-off scores based on the performance of a group of healthy elderly people living in their own homes.
Four subtests from the Wechsler Adult Intelligence Scale–Revised were also administered. Using the tables provided by Brooker and Cyr (Reference Brooker and Cyr1986), scores on the Vocabulary and Block Design subtests were used to provide an estimate of current level of intelligence. The Digit Span subtest was used to assess simple attention abilities. The Digit Symbol subtest was used to measure complex attention abilities. Premorbid level of intelligence was assessed by administration of the National Adult Reading Test. Verbal fluency was assessed by administration of the Controlled Oral Word Association test. Immediate and delayed verbal memory was assessed by administration of the Verbal Paired Associates subtest from the Wechsler Memory Scale–Revised.
Procedure and Data Analysis
This study was approved by the Waikato Ethics Committee. Each assessment took approximately 1.5 hours to complete, and took place at the patient's place of residence. The tests were administered in accordance with the standardised instructions available for each measure.
Clinical interpretation of obtained scores was undertaken using the cut-off scores or outcome categories provided by the normative data. For those measures that did not provide an interpretative system, obtained scores were interpreted in terms of standard deviations from the mean of the normative sample. Those scores equal to, or greater than, one standard deviation from the mean of the normative sample were considered to indicate ‘mild’ impairment, and scores equal to, or greater than, two standard deviations from the mean of the normative sample were considered to reflect ‘severe’ impairment. Interpretation of performance on the neuropsychological tests was undertaken using the age-appropriate normative data provided by Ivnik and co-workers (Ivnik, Malec, Smith, Tangalos, & Peterson, Reference Ivnik, Malec, Smith, Tangalos and Petersen1996; Ivnik et al., Reference Ivnik, Malec, Smith, Tangalos, Petersen, Kokmen and Kurland1992a, Reference Ivnik, Malec, Smith, Tangalos, Petersen, Kokmen and Kurland1992b).
An alpha level of .05 was used to determine statistical significance. In those instances when p < .05, the exact alpha level is reported. Prior to conducting the multiple regression analysis the independent variables were screened for multicollinearity and, following the recommendation of Tabachnick and Fidell (Reference Tabachnick and Fidell2007), variables with a correlation > .70 were combined. The hierarchical (sequential) regression was performed with the variables of demographics being added in step 1, medical variables in step 2, physical functioning variables in step 3 and cognitive variables in step 4.
The order of entry of the variables was determined by a consideration of the extent to which the variables could be targeted for rehabilitation. Variables were entered in the order from least to most suitable: demographic and medical variables are pre-existing characteristics and cannot be the focus of rehabilitation efforts, whereas the majority of physical recovery would have already occurred by 1 year post-stroke (Brown et al., Reference Brown, Hasson, Thyselius and Almborg2012).
Results
Functional Independence
Results obtained on the Barthel ADL Index indicated that 34 (51%) patients were physically impaired. Twenty-three (34%) patients had mild impairment, 5 (7%) patients had moderate impairment, 5 (7%) had severe impairment and 1 (1%) patient had very severe physical impairment.
The Nottingham Extended ADL Index covers the four areas of mobility, kitchen, domestic and leisure. Eleven (16%) patients performed all of the mobility tasks on their own, 44 (66%) performed some of the mobility tasks on their own and 12 (18%) patients did not perform any of the mobility tasks on their own. Thirty (45%) patients performed all of the kitchen tasks on their own, 36 (54%) performed some of the kitchen tasks on their own and 1 (1%) patient did not perform any of the kitchen tasks on their own. Ten (15%) patients performed all of the domestic tasks on their own, while 34 (51%) performed only some of the domestic tasks on their own and 23 (34%) patients did not perform any of the domestic tasks on their own. Nine (13%) patients performed all of the leisure activities on their own, while 55 (82%) performed only some of the leisure activities on their own and 3 (4%) patients did not perform any of the leisure activities on their own.
Depression
Twenty-two (33%) patients reported a clinically significant (score > 9) level of depression on the Geriatric Depression Scale. Nineteen (28%) reported symptoms of mild depression and 3 (4%) patients reported symptoms of severe (score > 19) depression.
Cognitive Functioning
Six patients were unable to complete the Cognitive Assessment Schedule due to visual and/or writing impairments. Of the 61 patients who did complete this measure, 17 (28%) displayed impairment in basic cognitive functioning. For 11 (18%) patients this impairment was of a mild degree, whereas the remaining 6 (10%) patients had moderate impairment.
Of the original 67 patients, 61 completed both the premorbid and current measures of intellectual functioning. The average estimated premorbid IQ for the patients was 99 (SD = 12, range = 69–121), which was significantly higher than the mean obtained IQ score of 79 (SD = 15, range = 55–114), t (60) = −12.08, p < .0005.
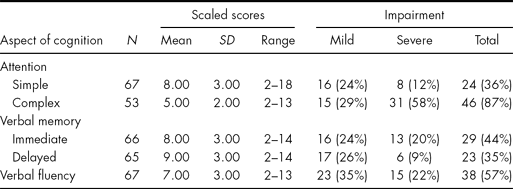
Table 2 shows the degree of impairment in tests of attention, memory and verbal fluency. Due to their various physical impairments, not all patients completed all measures of specific cognitive functions. The number of patients completing each measure is also shown in Table 2. The degree of impaired performance on the tests of specific cognitive functions ranged from 35% for delayed verbal memory through to 87% for complex attention. Similarly, the greatest prevalence of severe impairment (58%) was also apparent on the measure of complex attention. More patients were impaired on the measure of immediate verbal memory than delayed verbal memory (44% and 35%, respectively), and impairment of immediate verbal memory was more likely to be severe in degree (20% and 9%, respectively).
Means, Standard Deviations and Ranges for Scaled Scores and Degree of Impairment on Cognitive Measures
In total, 15 of the 67 stroke patients were unable to complete all measures of cognitive functioning due to visual or motor impairments, and one of these patients also refused to complete one of the cognitive measures. These 15 patients were therefore excluded from the correlational and regression analyses, as information was not available regarding their performance on all tests.
Correlational Analysis
In addition to the 15 patients excluded from the correlational and regression analyses as they were either unable or unwilling to complete all cognitive measures, 4 patients were excluded on the basis that their lesions were not located in either the left or right hemisphere (i.e., cerebellum, bilateral or brainstem strokes). Excluding these patients was necessary as the analysis included determining whether there was a relationship between either left or right hemisphere strokes, and post-stroke depression. Therefore 48 stroke patients were included in the correlational and regression analyses. Following the method described by Tabachnick and Fidell (Reference Tabachnick and Fidell2007), a t-test was used to determine whether the 19 patients who were excluded from further analysis were significantly different on the dependent variable (depression score) from the 48 patients included in the analyses. The excluded patients did not differ from those included in the analyses on the measure of depression, t(65) = −0.89, p > .05.
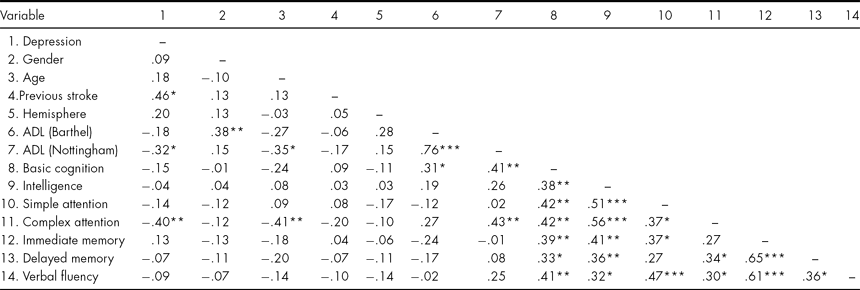
Analysis of the relationships between the predictor variables and depression was initially undertaken by correlational procedures. These results are displayed in Table 3. Higher depression scores occurred for those patients who had experienced a previous stroke (r pb = .46, p = .001), had greater impairment on the Nottingham Extended ADL Index (r = −.32, p = .027) and were more impaired on the measure of complex attention (Digit Symbol subtest; r = −.40, p = .005). Therefore, patients with higher depression scores were more likely to have experienced a previous stroke, and be relatively more impaired on measures of extended ADL tasks and complex attention abilities.
Correlational Analysis of Individual Variables at 1 year Post-stroke (N = 48)
ADL, Activities of daily living; * p < .05, ** p < .01. *** p < .001.
Regression Analysis
Due to the multicollinearity between the two measures of functional independence (Barthel ADL Index and Nottingham Extended ADL Index; r = .76, p < .001), the scores for these two measures were combined by addition to form one total score of physical functioning for use in the regression analysis.
As there were 48 cases suitable for the regression analysis and it is recommended that the number of independent variables be limited to a ratio of five cases for every independent variable (Tabachnick & Fidell, Reference Tabachnick and Fidell2007), only nine independent variables could be included in the regression analysis. To achieve this, the cognitive variables were combined or excluded as follows. As the scores on the immediate and delayed verbal recall subtests were highly correlated (r = .65) and as they measured similar constructs, these scores were added to form one score of Verbal Memory. In addition, as the correlations between the measures of general intelligence and verbal fluency and the depression score were not statistically significant and were the smallest for the remaining cognitive measures (r = −.04 and −.09, respectively) these two scores were excluded from the regression analysis.
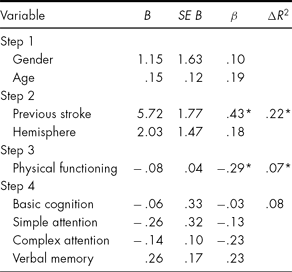
The hierarchical regression analysis was used to determine if demographic variables (gender and age), medical factors (previous stroke and hemispheric location of the lesion), level of physical functioning (as measured by the combined scores of the Barthel ADL Index and the Nottingham Extended ADL Index), and/or cognitive functioning, were related to level of depression at 1 year post-stroke. Aspects of cognitive functioning included in the analysis were basic cognition (Cognitive Assessment Scale), simple attention (Digit Span), complex attention (Digit Symbol) and verbal memory. Table 4 displays the unstandardised (B) and standardised (β) regression coefficients, R 2 for step 1, and the change in R 2 after entry of each of the additional blocks of independent variables.
Summary of Hierarchical Regression Analysis for Variables Predicting Depression at 1 year Post-stroke (N = 48)
R 2 = .04 for Step 1 (p > .05); *p < .05.
At step 1, the demographic variables of gender and age explained only 4% of the variance in depression, F(2, 45) = 0.98, p > .05. At step 2, the demographic and medical variables explained a total of 26% of the variance in depression, F (4, 43) = 3.79, p = .01, and the medical variables alone accounted for 22% of the variance at this step. The medical variable of previous stroke made a significant unique contribution to the amount of variance accounted for at this step (p = .002), and the addition of the medical variables resulted in a significant increment in R 2 (p = .004).
At step 3, the demographic, medical and physical variables explained a total of 33% of the variance in depression, F(5, 42) = 4.07, p = .004, and the physical variable alone accounted for 7% of the variance at this step. The addition of the physical variable resulted in a significant increment in R 2 (p = .049). At step 4, the cognitive variables alone accounted for 8% of the variance in depression, although none of the individual cognitive variables made a significant unique contribution to the amount of variance accounted for at this step and the addition of the cognitive variables did not result in a significant increment in R 2 (p > .05). With all the independent variables in the equation, the regression model explained 40% of the variance in depression, F (9, 38) = 2.84, p = .011.
Therefore, in total, the nine independent variables explained 40% of the variance in depression. The variables included in the regression equation did significantly predict post-stroke depression. However, these results indicate that the strongest predictors of depression at 1 year post-stroke were previous stroke and level of functional independence.
Discussion
The purpose of the current study was to report on the prevalence of depression at 1 year following stroke in a group of older adults, and to determine from a broad range of factors which were the strongest predictors of depression. Previous reports have suggested a high prevalence of post-stroke depression, the presence of which has negative implications for successful rehabilitation, and that such depression may be difficult to treat effectively (Brown et al., Reference Brown, Hasson, Thyselius and Almborg2012; Hosking et al., Reference Hosking, Marsh and Friedman1996, Kneebone & Dunmore, Reference Kneebone and Dunmore2000; Lincoln & Flannaghan, Reference Lincoln and Flannaghan2003; Zhang et al., Reference Zhang, Wang, Wang, Bai, Zhou, Wang and Wang2012).
The prevalence of depression at 1 year post-stroke in the current study was 33%. This is similar to that reported by Robinson et al. (Reference Robinson, Bolduc and Price1987), although other researchers have reported lower prevalence rates (e.g., Astrom et al., Reference Astrom, Adolfsson and Asplund1993; Brown et al., Reference Brown, Hasson, Thyselius and Almborg2012). While the prevalence rate reported here is the same as the average prevalence rate reported by Hackett et al. (Reference Hackett, Yapa, Parag and Anderson2005) following their review of 51 studies, the fact that this rate was present at 1 year post-stroke is not consistent with their conclusion that, in the majority of stroke patients, depression resolves spontaneously within several months of onset.
Although half of the patients indicated impairment on self-care activities as measured by the Barthel ADL Index, results from the Nottingham Extended ADL Index indicated that the majority of patients performed at least some of the mobility, kitchen, domestic and leisure activities. Approximately one-quarter of the patients demonstrated impairment in basic cognitive functioning. Consistent with this finding, the average IQ for the group was significantly lower than the estimate of intellectual functioning prior to the stroke. The prevalence of impairment was greater on more difficult tasks of cognitive functioning, with the rates of impairment on the more complex tasks ranging from 35 to 87%.
Depression was significantly correlated with previous stroke, complex attention (although this relationship did not reach significance in the regression analysis) and functional independence as measured by the Nottingham Extended ADL Index. Consistent with the majority of previous research (e.g., Appelros et al., Reference Appelros, Stegmayr and Terent2010; Hackett & Anderson, Reference Hackett and Anderson2005), demographic variables were not significantly related to post-stroke depression. Similarly, depression was not significantly correlated with performance of self-care activities as measured by the Barthel ADL Index at 1 year post-stroke. A possible explanation for the finding of a relationship with extended ADLs but not basic ADLs is that failure, or inability, to perform the extended ADL activities may have a greater negative impact on the patients’ emotional wellbeing than failure, or inability, to perform the basic self-care activities. Alternatively, the patients who are depressed may be less likely to perform the extended ADL activities, but continue to perform their self-care activities. However, given that depression is likely to be a reaction to impairment beyond the acute post-stroke stage (Brown et al., Reference Brown, Hasson, Thyselius and Almborg2012), the former alternative may be the more likely explanation.
Results from the regression analysis allowed for a clearer understanding of the relationships between depression and associated factors. Of the two medical variables considered, previous stroke, but not hemispheric location of the stroke, was strongly associated with depression. Despite the majority of recent studies showing no relationship between side of stroke and depression, the idea that such a relationship exists persists. This is possibly because it forms the basis for an organic explanation of, and treatment for, post-stroke depression. The results from the current study are consistent with recent findings that side of stroke is unrelated to depression (e.g., Thomas & Lincoln, Reference Thomas and Lincoln2006).
The relationship of previous stroke to depression has been reported in other studies (e.g., Andersen et al., Reference Andersen, Vestergaard, Ingemann-Nielsen and Lauritzen1995). But reasons for the continuation of this relationship into the chronic post-stroke period are unclear. The relationship itself may be reactive in nature; if the patient has experienced a previous stroke, they may be more aware of the long-term consequences of their condition and that their chances of having further strokes are increased, therefore they may become depressed. However, the duration of the relationship is a concern as the lack of a significant relationship between previous stroke and degree of physical impairment suggests that, regardless of the extent of the patient's recovery, depression is still a likely outcome if the patient has had a previous stroke. Perhaps a third factor, such as the rate of recovery, is responsible for this relationship; the patient who has had a previous stroke may improve more slowly than the patient who has had only one stroke.
Consistent with previous studies (e.g., Brown et al., Reference Brown, Hasson, Thyselius and Almborg2012; Gothe et al., Reference Gothe, Enache, Wahlund, Winblad, Crisby, Lokk and Aarsland2012) the results of this study indicate that loss of functional independence is related to post-stroke depression. In the early stages post-stroke it is likely that depression and physical disability each exacerbate the effects of the other. However, in the chronic post-stroke period it is possible that the patient may be reacting to a different aspect of their physical impairment than earlier in the post-stroke period. That is, earlier in the post-stroke period the patient may become depressed due to the extent of their physical impairment and by 1 year post-stroke the patient may be depressed due to the duration of their disability.
Cognitive impairment has been consistently found to be related to depression following stroke (Hackett & Anderson, Reference Hackett and Anderson2005). Despite this, results from the current study support previous findings (Andersen et al., Reference Andersen, Vestergaard, Ingemann-Nielsen and Lauritzen1995; Parikh et al., Reference Parikh, Lipsey, Robinson and Price1987) which indicate that this relationship is no longer evident at 1 year post-stroke. If the initial depression is a reaction to awareness of the cognitive impairment, it is possible that over the year following stroke patients may adapt to the consequences of their decreased cognitive functioning. This would explain the absence of a significant relationship between cognitive impairment and depression in long-term follow-up studies.
The current study took a more comprehensive approach to assessing possible classes of variables that may be related to depression in the chronic (1 year) stage after stroke than is evident in much of the literature. The assessment of functional independence included not only the presence of impairment (Barthel ADL) but also the level of activity or participation (Nottingham ADL). The assessment of cognitive functioning, while comprehensive, was of necessity brief, given the age and impairment of the patients. However, there are also other classes of psychosocial variables, such as loneliness and social support, that would need to be assessed prior to developing a comprehensive model of depression following stroke (Wilz & Barskova, Reference Wilz and Barskova2007). Another limitation of the current study was the small number of patients who were able to complete all the measures. The final regression was based on the responses from 48 patients, and caution needs to be exercised in drawing firm conclusions from this small sample. Despite these limitations, the current findings provide further support for Brown et al.'s (Reference Brown, Hasson, Thyselius and Almborg2012) call for clinicians to pay greater attention to rehabilitation of physical functioning following stroke as the loss of functional independence appears to be consistently related to the presence of depression.
Overall, the results from this exploratory study indicate that depression is still a major factor in the presentation of approximately a third of older adults at 1 year following stroke. Consideration of the variables identified as significant unique predictors of depression, previous stroke and physical impairment, as well as those variables which did not have unique explanatory power, such as side of stroke and cognitive impairment, suggests that those factors responsible for the development of depression following stroke may not necessarily be the same as those that lead to its continuation. These findings are consistent with Wilz and Barskova's (Reference Wilz and Barskova2007) results supporting a biopsychosocial model of post-stroke depression. A rehabilitation approach which incorporates an understanding of the process of adaptation to disability may hold promise for explaining and effectively treating this debilitating condition.
Acknowledgments
The authors wish to thank Dr Paul J. Friedman and the staff of Ward 58 at Waikato Hospital for their assistance with this project. This paper is based on the PhD thesis of the first author.