Introduction
Switching behavior of phase-change materials and the relevance of liquid states
For more than half a century, mixtures of elements in the nonmetal section of the periodic table have been famous for their ability to form glasses (e.g., As-Se) from their liquid states, often with great stability, low acoustic losses, and high corrosion resistance. They have found many applications, particularly in infrared optics (e.g., night vision) and semiconductor electronics.Reference Eggleton, Luther-Davies and Richardson1 However, as the compositions tested include heavier elements (e.g., Se replaced by Te and As replaced by Sb), the glass-forming ability diminishes, seemingly as the bandgap decreases. While As2Se3 is extremely difficult to crystallize on laboratory time scales, Bi2Te3 is metallic and difficult to vitrify even by sputtering. In between the two is As2Te3, which undergoes a semiconductor-to-metal transition when heated above its melting point, T m.Reference Tveryanovich, Ushakov and Tverjanovich2
In 1968, OvshinskyReference Ovshinsky3 discovered that he could use the ability of Te-containing alloys to generate solid phases of greatly differing electronic conductivities depending on whether they were vitreous or crystalline, to make switching devices and memory devices. Apart from some excellent fundamental studies in Ovshinsky’s laboratory, however, development was slow, with a resurgence of interest only in the late 1980s after Yamada et al.Reference Yamada, Ohno, Akahira, Nishiuchi, Nagata and Takao4 published a study on the three-component Ge-Sb-Te system that showed special behavior in fast phase switching and property contrasts along what we will call the “Yamada line,” (the composition line joining GeTe to Sb2Te3). The Yamada line,Reference Yamada, Ohno, Nishiuchi, Akahira and Takao5 comprising the most popular phase-change materials (PCMs), features several closely related crystalline compounds with simple structures and remarkably fast crystallization kinetics. These crystalline compounds have been studied in detail by Wuttig, who in 2005, highlighted the storage potential of devices containing them.Reference Wuttig6 A follow-up 2007 paper on the subject by Wuttig and Yamada in collaboration,Reference Wuttig and Yamada7 has been greatly cited. Recently, this interest has been translated into manufactured devices, and even more recently, attention has been directed to the liquid states of PCMs, in order to understand their special crystallization properties.Reference Orava, Greer, Gholipour, Hewak and Smith8–Reference Wei, Evenson, Stolpe, Lucas and Angell12
In this article, we review these liquid-state issues and then take the development one step further by introducing and exploiting a new material parameter, the “metallicity.” Using this parameter in our plots allows us to strengthen the claim that it is the existence of a metal-to-semiconductor transition (M-SC) located at a critical distance below T m that makes it possible for these PCMs to perform as they do.
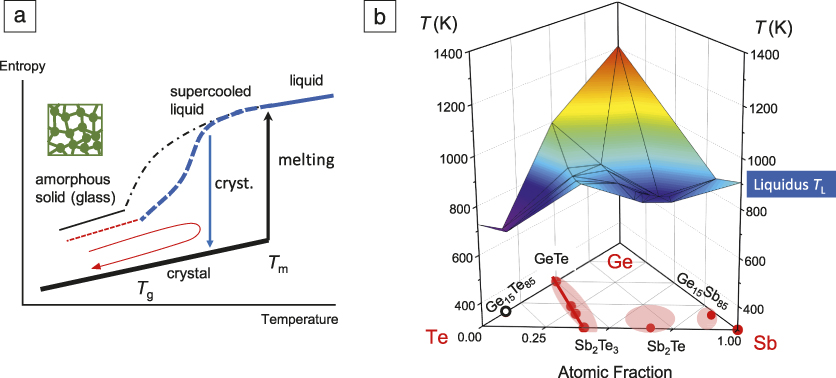
First, we give a brief introduction to glass-forming liquid phenomenology. Figure 1 illustrates both paradoxical and practical aspects of the typical glass-forming liquid, which is a liquid that is slow to crystallize on cooling below its T m.Reference Wuttig and Yamada7,Reference Bordas, Clavaguer-Mora, Legendre and Hancheng13 Figure 1a shows how the excess entropy of the liquid introduced on melting decreases rapidly as supercooling is extended, as a consequence of the higher heat capacity of the liquid. It is evident that the entropy of the liquid would fall below that of the crystal far above 0 K were it not for the intercession of a structural arrest phenomenon, the “glass transition” (T g), at which the heat capacity (C p) contribution coming from configurational changes with temperature, drops out. The avoidance of a thermodynamic catastrophe by a kinetic phenomenon is known as the Kauzmann paradox; this has attracted much attention from the theory community.
(a) A schematic plot for the entropy of a typical glass-forming liquid (dot-dashed line) and a switchable phase-change material (PCM) (dashed line) in an alternative scenario with additional entropy loss, where T g is the glass-transition temperature and T m is the melting point). (b) The liquidus surfaceReference Bordas, Clavaguer-Mora, Legendre and Hancheng13 (contour) of ternary Ge-Sb-Te. The solid red dots and shadow areas indicate the common compositions of PCMs, including the GeTe-Sb2Te3 Yamada line for memory and data-storage applications.Reference Wuttig and Yamada7

On the other hand, in PCMs, which are poor glass formers, this scenario is only realized when the cooling rate is very high. The glassy state that is trapped would be high in entropy and low in stability relative to more slowly cooled structures if not assisted by some additional source of entropy loss. The additional source of entropy loss will be the focal point of this article.
The action of reheating the glass, by a heat pulse, to a temperature kept well below T m provides a new opportunity for the glass to crystallize. The crystal, with more ordered structure and much higher electronic conductivity, can generate the “on” state of a microscopic “bit” of the material, which is illustrated by the red heat-and-cool arrow in Figure 1a. If the heat pulse is sufficient to raise the temperature above T m, and the surrounding provides a good enough heatsink, then the cooling rate after the pulse will be sufficient to return the sample to the glassy, or “off,” state. In PCMs, this fine-tuned and complex sequence can be repeated countless times with high reproducibility, allowing for fabrication of a chip with huge memory storage capacity.Reference Wong, Raoux, Kim, Liang, Reifenberg, Rajendran, Asheghi and Goodson14–Reference Zhang, Mazzarello, Wuttig and Ma16
Figure 1b shows the relation of the liquidus surface of the Ge-Sb-Te system in relation to the composition of known PCMs,Reference Bordas, Clavaguer-Mora, Legendre and Hancheng13 in particular, the Yamada line of crystals that has been given the most attention. The PCM compositions all have low T m, but apparently not the lowest or PCMs would be concentrated at the ternary eutectic composition, which is the most easily glass forming.
No-man’s land of PCMs
The problem with identifying the additional source of entropy loss that was previously mentioned is that it clearly must occur below the T m and, of course, well above T g. The fact that the crystallization rates of PCMs, in contrast to the chalcogenide glass formers of earlier studies, are extremely high, means that it is difficult to characterize what the additional source of entropy loss might be by direct experiments. The problem is reminiscent of that of supercooled water, the “most anomalous liquid,” which has been the source of much interest because of the apparent existence of a transition of higher order, (close to first order), lying about 20% below the T m.Reference Angell17
In the case of water, the thermodynamic properties, which are well known in the stable range between 0 and 100°C, develop striking anomalies as the liquid is supercooled. With samples of extreme cleanliness, these can be studied down to the “homogeneous nucleation temperature” T h near –31°C for large (10 ml ampoules) and –38°C for micron-sized samples (special emulsions). The isothermal compressibility, for instance, increases according to a power law with an apparent divergence temperature of 228 K, implying proximity to a critical point.Reference Angell, Essman, Hemmati, Poole and Sciortino18 So far, comparable supercooling has not been reported for PCMs.
This undercooling limit on measurements near T m, and corresponding termination of the glassy state due to fast crystallization at far lower temperatures, establishes the existence of a “no-man’s land” (a term used for the water problem) in which no observations can be made except by ultrafast probes or deduction from external studies such as crystallization rates. In the next sections, we will make use of a simpler and more powerful approach using plausible extrapolations of the properties of many non-PCM, but related, materials, to reach the conclusions about the PCMs themselves. In this approach, we will be greatly aided by the metallicity parameter previously mentioned.
Thermodynamic response functions in Group IV, V, and VI liquid alloys
Density and thermal expansivity anomalies
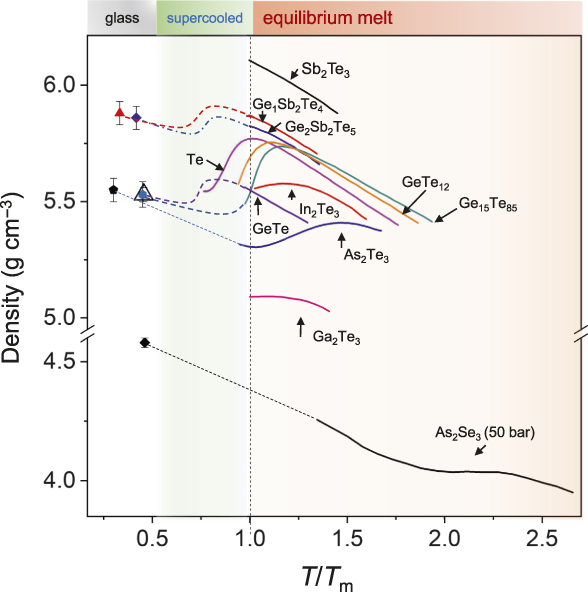
Three elements and many Group IV, V, and VI alloys exhibit temperatures of maximum density (T MD) in their liquid states, an anomaly often mistakenly thought to be unique to water. In Figure 2,Reference Hosokawa, Sakaguchi and Tamura19–Reference Betts, Bienenstock, Keating and deNeufville26 liquid densities are plotted against T m-scaled temperature for the elements and several alloys. The elements and alloys exhibiting a density (ρ) maximum include Te (direct measurement), Si and Ge (by computer simulation extension of experimental data), GeTe12, GeTe6 (i.e., Ge15Te85), As2Se3, As2Te3, and Ga2Te3 as well as In2Te327 and Tex-Se1−x28 (not shown). The T MD is ∼0.9 T m for tellurium. Liquid silicon undergoes a first-order liquid-liquid transition during supercooling seen as a sharp density decrease at around 0.65 T m in computer simulations.Reference Sastry and Angell29 Most observable density maxima are above T m (i.e., T MD > T m). Those with compositions typical of PCMs such as GeTe, Sb2Te3, and Ge1Sb2Te4, Ge2Sb2Te5 on the Yamada line, do not display a density maximum above T m.Reference Otjacques, Raty, Gaspard, Tsuchiya and Bichara20 But when we include the measured density of the glassy phase obtained by sputtering or hyperquenching (i.e., excessively fast cooling) and compare with the behavior of nearby compositions that do exhibit density maxima, it is highly plausible to interpolate the curves for temperature-dependence of density with maxima.
Liquid densities versus melting point (T m)-scaled temperature for Group IV, V, and VI elements and their alloys. The low-temperature data points are for glassy states, and dashed lines are interpolations of the density traces in the supercooled liquid regime based on evidence from the cases of As2Te32 and As2Se319 that the density follows a negative slope with respect to temperature below the temperature of maximum density, T MD. Data for GeTe, Sb2Te3, and Ge1Sb2Te4, Ge2Sb2Te5 are from Reference Reference Otjacques, Raty, Gaspard, Tsuchiya and Bichara20. Data for Te, GeTe12, GeTe6 (Ge15Te85) are from Reference Reference Tsuchiya21. For the glassy states, Ge1Sb2Te4: ρ = 5.88 g/cm3,Reference Steimer, Coulet, Welnic, Dieker, Detemple, Bichara, Beuneu, Gaspard and Wuttig22 Ge2Sb2Te5: ρ = 5.88g/cm3,Reference Njoroge, Wöltgens and Wuttig23 GeTe: ρ = 5.6 g/cm3,Reference Chopra and Bahl24 As2Te3: ρ = 5.53g/cm3,Reference Quinn25 and Ge15Te85: ρ of Ge17Te83 is available and assumed to be approximately the same 5.53 g/cm3.Reference Betts, Bienenstock, Keating and deNeufville26

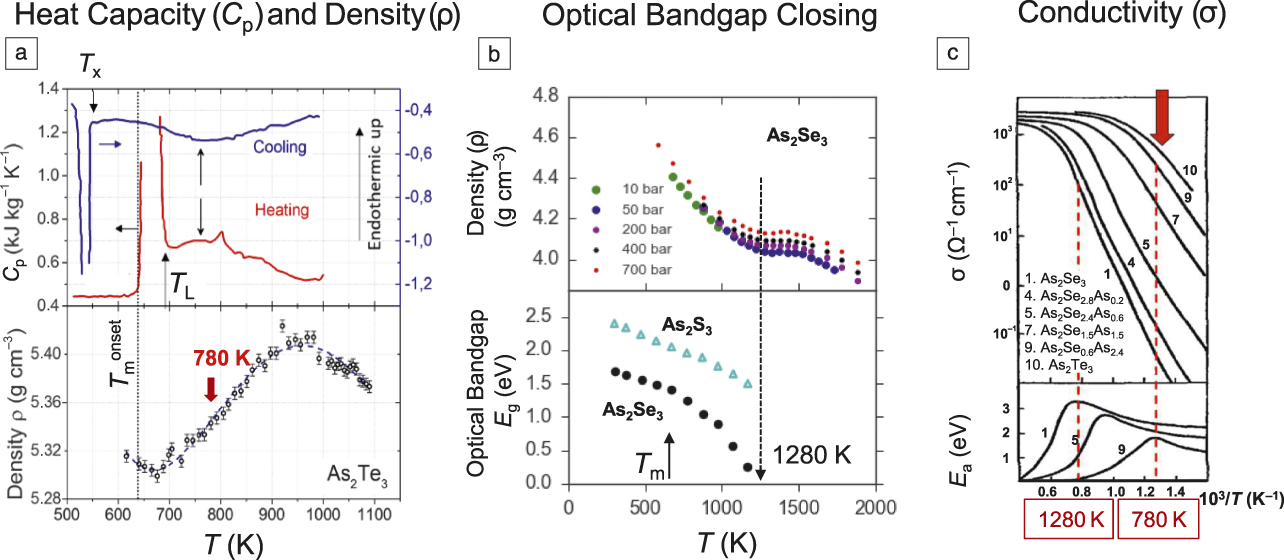
Note that between the density maximum and the density minimum, there lies an extremum in thermal expansivity, αp = V –1(∂V/∂T), where V is the volume. The temperature of the peak in αp corresponds to the peak in the heat capacity (see next section). It also corresponds closely with temperature of the closing of the bandgap (see Figure 3Reference Hosokawa, Sakaguchi and Tamura19,Reference Hosokawa, Yamada and Tamura28 ), and other properties that relate to a M-SC. It is obvious that the width of the αp(T) peak will be correlated with the sharpness of the maximum in ρ(T).
The metal-semiconductor transition (M-SC). (a) Upper plot: The C p maximum is ∼80 K above the liquidus T L in As2Te3. Dotted line indicates the onset of melting (T monset). T x is the crystallization temperature during cooling. Lower plot: the density maximum and minimum of liquid As2Te3.Reference Tveryanovich, Ushakov and Tverjanovich2 (b) Upper: Densities of liquid As2Se3 at various mild pressures. Lower: Optical bandgap (E g) of liquid As2Se3 closes at ∼1280 K, and that of As2S3 would close at a higher temperature.Reference Hosokawa, Sakaguchi and Tamura19,Reference Hosokawa, Yamada and Tamura28 (c) Electronic conductivity (σ) as a function of inverse temperature for (As2Se3)1–x(As2Te3)x alloys. σ drops from a plateau of ∼103 S cm–1 through a M-SC. The temperature at which the M-SC occurs (T M-SC) corresponds to the maximum in apparent activation energy (E a) of σ. The arrow indicates T M-SC of liquid As2Te3.Reference Nagels, Rotti and Vikhrov30,Reference Alekseev, Andreev and Sadovskii32

Heat capacity anomalies
Where heat capacities have been measured for the systems shown in Figure 2, they show maxima that coincide with the maximum in αp mentioned in the previous section. The widths of these peaks are also comparable. The sharpest C p anomalies have been observed for elemental Te and the Ge15Te85 eutectic alloy,Reference Tsuchiya31 which have been correlated with a fragile-strong transition in the viscosity that will be discussed in a later section. These sharp anomalies lie at or below the thermodynamic T m. Cases observable above T m tend to be broader, but are easier to study. The case of As2Te3 in particular has been characterized by not only C p and density measurements, which are assembled in Figure 3, but also Knight shiftReference Tveryanovich, Ushakov and Tverjanovich2 and electronic conductivity data.
Metal-semiconductor transition versus metallicity in PCMs
The maxima in thermodynamic response functions are, in each case, accompanied by conductivity transitions in Group IV, V, and VI alloys in which conductivities σ decrease from almost temperature-independent values slightly above σ = 1000 S cm–1 (Mott’s “minimum metallic conductivity”), to the lower and temperature-dependent values characteristic of semiconductorsReference Alekseev, Andreev and Sadovskii32 (Figure 3c). The transition, designated M-SC, is also evident in the closing of the optical bandgap E g as shown for the case of As2Se3 liquidReference Hosokawa, Sakaguchi, Hiasa and Tamura33 (Figure 3b).
Considering the series As2S3, As2Se3, and As2Te3, in Figure 3, it is clear that the M-SC transition moves to lower temperatures as the chalcogenide becomes more metallic, and the same is true for the series Sb2S3, Sb2Se3, and Sb2Te3 (the latter of which actually melts to the metallic phase, see Figure 8 of Reference Reference Wei, Coleman, Lucas and Angell11). Finally, the trend holds for the binary solutions Se-Te.Reference Kakinuma and Ohno34 In an attempt to quantify this trend, we introduce a new parameter, the “metallicity,” which we define as the inverse of the composition-averaged electronegativity of the alloy, according to:
 $${M_P} = {1 / {\left( {{x_1} \cdot {\chi _{P1}} + {x_2} \cdot {\chi _{P2}} + .. + {x_i} \cdot {\chi _{Pi}}} \right)}},$$
where 0 < x i < 1 is the atomic fraction of the alloy component i, and χPi is available for each element in any Table of revised Pauling electronegativitiesReference Allred35 (hence, the subscript P).
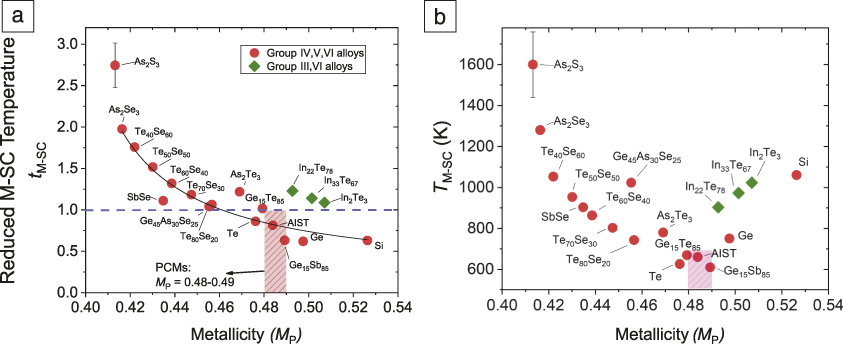
In Figure 4a,Reference Kakinuma, Ohno and Suzuki36–Reference Bhat, Molinero, Soignard, Solomon, Sastry, Yarger and Angell38 we use this parameter to rationalize the variation of the temperature of the M-SCs when scaled by the alloy melting points (or liquidus for Te-Se), referred to as the reduced M-SC temperature:
 $${t_{M - SC}} = {{{T_{M - SC}}} / {{T_{m}}}}.$$
Correlations of T M-SC/T m (= t M-SC) and T M-SC values with the metallicity parameter, M P for various alloys. (a) The t M-SC of Group IV, V, and VI alloys (red dots) and Group III, VI alloys (green diamonds). The phase-change material (PCM) compositions on the Yamada line, and (Ag, In)-doped Sb2Te (AIST) and Ge15Sb85 have metallicity ranging from M P = 0.48–0.49, marked by the shadowed pink area, which corresponds to t M-SC < 1.0. (b) The absolute T M-SC relation to metallicity M P. This shows a V-shape with respect to M P with a minimum zone (shadowed pink zone), where all known PCMs are located. Data sources: As2Se3 and As2S3;Reference Hosokawa, Sakaguchi, Hiasa and Tamura33 T M-SC of As2S3 is an extrapolation to optical bandgap closing; Te-Se,Reference Kakinuma and Ohno34 SbSe,Reference Kakinuma, Ohno and Suzuki36 Ge45As30Se25.37 The T M-SC is assigned to the temperature of maximum slope of density curve ∼750°C = 1023 K. As2Te3,Reference Tveryanovich, Ushakov and Tverjanovich2 Te,Reference Quinn25 Ge15Te85,Reference Wei, Lucas and Angell10,Reference Tsuchiya21 In-Te,Reference Thurn and Ruska27 Ge,Reference Bhat, Molinero, Soignard, Solomon, Sastry, Yarger and Angell38 Si,Reference Sastry and Angell29 AIST and Ge15Sb85.Reference Zalden, Quirin, Schumacher, Siegel, Wei, Koc, Nicoul, Trigo, Andreasson, Enquist, Shu, Pardini, Chollet, Zhu, Lemke, Ronneberger, Larsson, Lindenberg, Fischer, Hau-Riege, Reis, Mazzarello, Wuttig and Sokolowski-Tinten39

For low M P chalcogenides such as As2Se3 and Te40Se60, the t M-SC is larger than 1.0. With increasing metallicity, t M-SC decreases, approaching the value of 1.0 around M P = 0.47–0.48. For any IV, V, and VI alloy with M P > 0.48, t M-SC, the M-SC transition falls below T m. While the correlation is clear for Group IV, V, and VI alloys, the Group III, VI alloys (e.g., In-Te, green diamonds) are displaced, suggesting that a volume scaling might also be a needed addition.
For PCM compositions on the Yamada line (e.g., Ge1Sb2Te4 and Ge2Sb2Te5), M P lies between 0.481 and 0.487 (pink shadow area), and the Figure 4 correlation line suggests their M-SCs, should all be “submerged” below T m (t M-SC < 1.0), as our earlier study suggested.Reference Wei, Coleman, Lucas and Angell11 Note that the PCM compositions Ge15Sb85 and (Ag, In-doped) Sb2Te are not on the Yamada line, but they have similar values of M P, namely in the range 0.48–0.49.Reference Zalden, Quirin, Schumacher, Siegel, Wei, Koc, Nicoul, Trigo, Andreasson, Enquist, Shu, Pardini, Chollet, Zhu, Lemke, Ronneberger, Larsson, Lindenberg, Fischer, Hau-Riege, Reis, Mazzarello, Wuttig and Sokolowski-Tinten39
In Figure 4b, the absolute values of T M-SC are plotted against M P, showing a V-shape, where all known PCM compositions are located in the minimum zone around M P = 0.48–0.49. This zone appears to be crucial for Group IV, V, and VI PCMs, as it corresponds to a lowest T M-SC, and meanwhile, ensures t M-SC < 1. Their relevance to fast switching lies on a transition in kinetic properties at the same temperature T M-SC, known as a fragile-strong transition (which is discussed in detail in the next section). Only when t M-SC < 1, the temperature window of the fragile liquid is below T m. As such, the fragile liquid provides high atomic mobility, which facilitates crystallization that can only occur below T m.
Following these successes, we have noted that the element bismuth (Bi) has nearly the same metallicity as Ge (0.495 and 0.498, respectively), which might be predicted to replace Ge in PCM formulations. We find that Bi2Te3 has been identified by atomic probe tomography as having the bonding of a PCM,Reference Zhu, Cojocaru-Mirédin, Mio, Keutgen, Küpers, Yu, Cho, Dronskowski and Wuttig40 and Bi2Te3 nanowires exhibit memory switching behavior.Reference Han, Kim, Yang, Lee, Sohn, So, Ahn and Yoo41 It raises the question, “is there perhaps an equivalent of the “Yamada line” in the Bi-Sb-Te system (Ge-free) (e.g., along much of the Bi2Te3-Sb2Te3 join)?” Both are in the weak metal state at their melting temperatures, as for PCMs. Attention has already been drawn to the analog of the GST Yamada line provided by the (Ge-containing) Ge-Bi-Te systemReference Lee, Kim, Kang, Suh, Kim and Khang42 and to the similarity of the various crystalline structures along that line to those in the GST system. In that case, it was reported that the presence of Bi “significantly enhances the crystallization of the GBT layers.”
Finally, we caution that the use of the metallicity parameter should be limited to the covalent alloys based on the Group IV, V, and VI elements. These elements are metalloid or close to metalloid, where the inverse electronegativity gives a quantitative measure of how “metallic” the element is. Those alloys with a higher metallicity are usually associated with higher conductivities. This may explain why, for liquid PCMs (with high metallicities), the conductivity upon heating usually reaches the value of 102–103 S cm–1 of a “weak-metal” state earlier at a relatively low temperature (often below T m), at which the semiconductor-to-metal transition occurs. By contrast, non-PCM chalcogenides need to be heated to higher temperatures, usually above T m, so as to reach the weak-metal state for the semiconductor-to-metal transition to occur.
Note that there are density functional theory (DFT)-based parameter maps proposed for crystalline phase properties of PCMs.Reference Raty, Schumacher, Golub, Deringer, Gatti and Wuttig43,Reference Pries, Cojocaru-Miredin and Wuttig65 However, they are not available for amorphous phases. It remains to be seen whether and how they are related to the metallicity parameter introduced here and the M-SC behaviors.
Double-kink and smeared-out fragile-strong transitions in viscosity
In their classic 1965 paper,Reference Adam and Gibbs44 Adam and Gibbs presented a molecular kinetic theory in which the temperature dependence of relaxation time τ(T) is determined by the probability of cooperative rearrangement of mobile units in the system. The latter can be expressed in terms of configurational entropy, S c:
 $$\tau = {\tau _0}\,exp\left[ {{{ - C} / {\left( {T{S_C}} \right)}}} \right]$$
where τ0 is the pre-exponent near the phonon cycle time (10–14 s) and C is a constant. In treating experimental data, S c has been shown to be proportional to the excess entropy S ex of liquid over crystal, which can be derived from C p.Reference Wei, Lucas and Angell10 Thus, the C p maximum leads to a transition in τ(T) and therefore the viscosity η(T) (through the Maxwell relation η = G ∞∙τ, where G ∞ is the infinite-frequency shear modulus.)
The drastic change in the temperature dependence of viscosity from a high-temperature fragile liquid to a low-temperature strong liquid near T g is the so-called fragile-strong transition (FST). According to the liquid fragility concept,Reference Angell45 some liquids, exhibiting a near-Arrhenius rise in viscosity on approaching T g, are classified as “strong” liquids, while others, showing a range of non-Arrhenius behavior, are referred to “fragile” liquids. Fragility is commonly characterized by measuring the slope of the T g-scaled Arrhenius plot (fragility plot) at T g, called “steepness index” or “m-fragility,” m = d log η/d(T g/T) |T=Tg.Reference Angell45
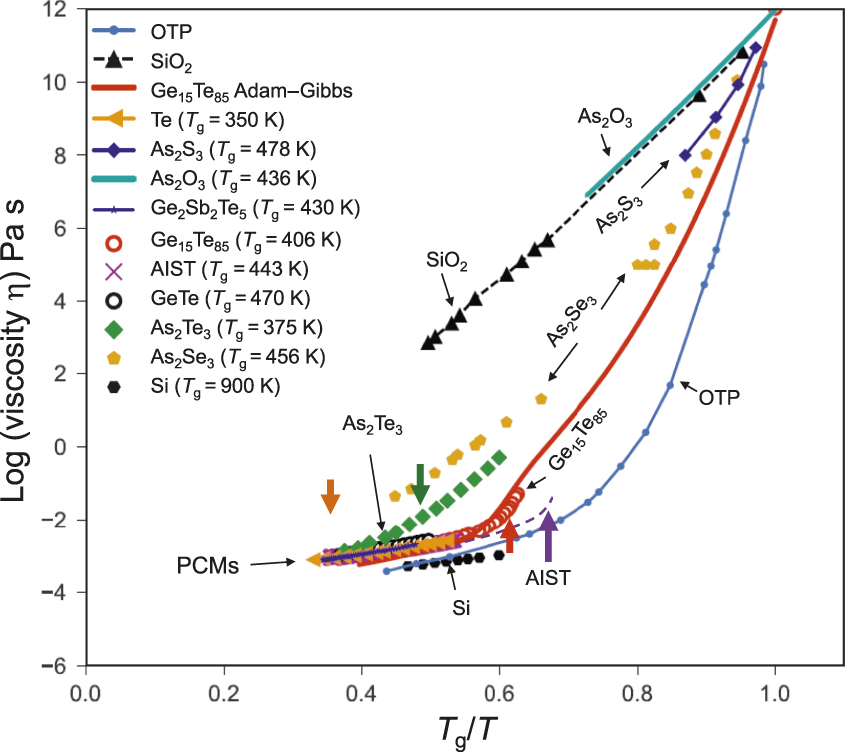
A clear FST is demonstrated in Ge15Te85 (Figure 5)Reference Orava, Greer, Gholipour, Hewak and Smith8,Reference Wei, Lucas and Angell10–Reference Wei, Evenson, Stolpe, Lucas and Angell12,Reference Angell45,Reference Orava, Weber, Kaban and Greer47,Reference Orava, Hewak and Greer48,Reference Weber, Orava, Kaban, Pries and Greer53,Reference Schumacher, Weber, Jóvári, Tsuchiya, Youngs, Kaban and Mazzarello57–Reference Rhim and Ohsaka64 as a “double-kink” in η(T)-curve near its eutectic temperature, which is verified by a direct differential scanning calorimetry (DSC) measurement near T g.Reference Wei, Lucas and Angell10 The corresponding structural change is shown as a stepwise rise in the second to first peak position ratio r 2/r 1 of reduced pair distribution functions G(r) from in situ x-ray scattering.Reference Wei, Stolpe, Gross, Hembree, Hechler, Bednarcik, Busch and Lucas46 In As2Te3, the FST is so smeared-out that no “double-kink” is discerned. The C p anomaly spans ∼300 K (Figure 3a). The viscosity of As2Te3 drops smoothly by ∼3 orders of magnitude in the transition range. The sharpness of the FST depends on the sharpness of the C p maximum and the associated loss of S ex across the transition.
Arrhenius plots scaled by the glass-transition temperature (T g) for the viscosity (η) of Group IV, V, and VI alloys. Phase-change materials (PCMs), which have the highest metallicity, exhibit the lowest viscosities at T m (where T g/T m ∼ 0.5). On the T g-reduced scale, they overlap the elemental Te data. Alloys of lower metallicity exhibit systematically higher viscosities, and lower m fragilities. The lowest metallicity case, As2O3, with m = 19 (according to light-scattering relaxation time data) is even stronger than the archetypal strong liquid, SiO2. Apart from this interesting case, Figure 5 contains only directly measured experimental viscosities. The crystal-growth-derived viscosities are not shown. The bold colored arrows indicate T M-SC (660 K) of AIST (purple) below T m, and that of As2Te3 (green), Ge15T85 (red), and As2Se3 (orange) above T m, respectively. Data sources: Ge2Sb2Te5;Reference Schumacher, Weber, Jóvári, Tsuchiya, Youngs, Kaban and Mazzarello57 T g = 430 K,Reference Kalb, Wuttig and Spaepen58 although the value is still under debate;Reference Orava, Greer, Gholipour, Hewak and Smith8 AIST (Ag-In-doped Sb2Te),Reference Orava, Weber, Kaban and Greer47 (its T g = 443 KReference Kalb, Wuttig and Spaepen58) is also under debate;Reference Orava, Hewak and Greer48 Te;Reference Herwig and Wobst59 T g = 350 K;Reference Wei, Coleman, Lucas and Angell11 Ge15Te85: viscosity data;Reference Neumann, Herwig and Hoyer60 Adam–Gibbs fitting line;Reference Wei, Lucas and Angell10 GeTeReference Weber, Orava, Kaban, Pries and Greer53 assigned T g = 470 K; As2Te3;Reference Tverjanovich61 T g = 375 K is the value at which calculated viscosity reaches 1012 Pa s; As2Se3;Reference Tverjanovich62 As2S3.Reference Angell45 For As2O3, relaxation times were directly measured using light scattering, from which the precise Vogel–Fulcher–Tammann (VFT) parameters were obtained. The viscosity is represented by a VFT fit in the similar temperature range of relaxation time data using the parameters in Reference Reference Yannopoulos, Papatheodorou and Fytas63; SiO2, and o-terphenyl (OTP);Reference Angell45 SiReference Rhim and Ohsaka64 (the T g of Si is unknown and here assigned as 900 K).Reference Wei, Lucas and Angell10

The viscosity of PCM compositions has been measured directly for (e.g., Ge2Sb2Te5, [Ag, In]-doped Sb2Te [AIST], and GeTe) at high temperatures above their T m, as shown in Figure 5. Those data nearly overlap the high-temperature viscosity of Te (orange triangles) and that of the fragile state of Ge15Te85 above its FST (open circles) at T g/T < 0.5. Thus, liquid PCMs above T m exhibit a “fragile” behavior, as expected from their weak-metal states in the equilibrium melt.
Insofar as the predicted FSTs (also M-SC transitions) always occur below T m in PCMs, they cannot be directly observed due to the interference of fast crystallization, but have only been inferred. Orava et al.Reference Orava, Weber, Kaban and Greer47,Reference Orava, Hewak and Greer48 measured the temperature-dependence of crystallization kinetics using ultrafast DSC, and inferred an “Arrhenius”-like behavior of viscosity between 383 K and ∼490 K for as-deposited AIST. They proposed a broad crossover from a high-temperature fragile liquid (m = 74) to a low-temperature strong liquid (m = 37). Zalden et al.Reference Zalden, von Hoegen, Landreman, Wuttig and Lindenberg49 identified a crossover temperature in AIST (∼570 K for melt-quenched samples and ∼540 K for as-deposited samples) through the kinetics of subnanosecond laser induced crystallization. In the same composition, Salinga et al.Reference Salinga, Carria, Kaldenbach, Bornhöfft, Benke, Mayer and Wuttig50 revealed a nearly constant activation energy for the temperature-dependence of crystal-growth-derived viscosity below ∼570 K, which they referred to as Arrhenius-like behavior. This was attributed to the falling out of equilibrium into glassy states due to extremely fast cooling rates (∼109–1010 K/s) by laser-melt-quench on the small beam spot.
An ab initio calculation by Zhang et al. for AISTReference Zhang, Ronneberger, Zalden, Xu, Salinga, Wuttig and Mazzarello51 successfully produced reasonable temperature-dependence of diffusivity at high temperature above T m, though it did not give a reasonable account for the supercooled liquid state at much lower temperatures. For Ge2Sb2Te5, the ultrafast DSC study of Orava et al.Reference Orava, Greer, Gholipour, Hewak and Smith8 implied a single fragility parameter (m ≈ 90) for the entire liquid regime, while the ab initio simulation of Flores-Ruiz and MicoulautReference Flores-Ruiz and Micoulaut52 proposed a FST from m ≥ 129 to m = 90 at 792 K. An ultrafast DSC study of Ge2Sb2Te5 nanoparticles suggested a broad FST.Reference Weber, Orava, Kaban, Pries and Greer53 In another PCM GeTe, a single fragility (m = 76) is suggested, partially based on ultrafast DSC measurements, to describe the liquid without a FST,Reference Chen, ten Brink, Palasantzas and Kooi54 which is in contrast to the extrapolation from reference Reference Wei, Coleman, Lucas and Angell11 and this work.
Zhang et al.Reference Zhang, Mazzarello, Wuttig and Ma16 emphasized a “kinetic crossover,” defined as a large change in activation energy of viscosity, that occurs somewhat below T m, as essential for fast crystal growth in PCMs. Note that a so-defined “kinetic crossover” is not the same concept as the FST discussed here (or fragile-strong crossover), because the former is expected during the undercooling of any fragile liquid that is described by mode coupling theory (MCT)Reference Götze55 at higher temperatures. It corresponds to the much-discussed crossover from MCT to “hopping” behavior (i.e., it does not imply a structural or heat capacity-based transition to a stronger liquid state).
Unlike the cases of good glass-formers (e.g., Ge15Te85 and As2Te3), the ambiguity and controversy of fragilities and FSTs in PCM compositions are no surprise because direct experiments cannot easily be carried out in the fast crystallization regime to determine the viscosity of supercooled liquid. In the literature, the reported crystal growth velocities themselves may differ by a few orders of magnitude, depending on different sample preparation processes and experimental approaches. Furthermore, since crystallization processes may occur in either glass or liquid, and since the glass-transition temperatures of PCMs are still debated, it is unclear whether the derived viscosity corresponds to the equilibrium viscosity, which is the meaningful quantity for discussion of liquid fragility, or something else. For instance, if a liquid falls out of equilibrium during cooling and forms a glass at a fictive temperature T f, which depends on the cooling rate, a quantity with dimensions of viscosity can still be measured, and it usually follows the Arrhenius Law,Reference Angell, Ngai, McKenna, McMillan and Martin56 but this behavior should not be confused with that of a strong liquid, nor the transition to the strong state, a FST.
Zalden et al.Reference Zalden, Quirin, Schumacher, Siegel, Wei, Koc, Nicoul, Trigo, Andreasson, Enquist, Shu, Pardini, Chollet, Zhu, Lemke, Ronneberger, Larsson, Lindenberg, Fischer, Hau-Riege, Reis, Mazzarello, Wuttig and Sokolowski-Tinten39 recently conducted a femtosecond pump-probe x-ray laser experiment that enables resolution of structural changes within nanosecond time scales, which provided the first direct evidence of a structural transition in PCMs below T m. This was observed at 660 K in AIST (Ag4In3Sb67Te26) and 610 K in Ge15Sb85, and is so far the most convincing evidence of liquid-liquid transitions (which are also M-SCs, as mentioned earlier) in the supercooled liquid PCMs. When the results are plotted in Figure 4, the data well support our prediction from the metallicity parameter.
We further comment on the significance of FSTs due to the sharp heat capacity anomalies in the PCM metallicity domain. The FST controls the kinetic factor (atomic mobility) of nucleation and growth of crystals. In the fragile state, a high kinetic factor facilitates crystallization (fast switching) at an elevated temperature between T M-SC and T m by a “set” pulse, while, in the strong state below T M-SC, a low kinetic factor hinders crystallization at ambient temperature, which is favorable for data retention. Within limits, this transition should be tunable by change of metallicity. From the previously discussed analysis, this transition is also the origin of the additional entropy loss during vitrification of PCMs, as mentioned in the Introduction section.
A recent study suggested that imminence of a M-SC/FST transition is signaled well above T m by the combination of viscosity with diffusivity data, known as the Stokes–Einstein relation (SER).Reference Wei, Evenson, Stolpe, Lucas and Angell12 In PCMs, unlike other liquids, the SER breaks down while in a high-fluidity state (τ ∼ ps) and even above T m.Reference Wei, Evenson, Stolpe, Lucas and Angell12
Summary and outlook
The liquid states of PCMs are shown to be anomalous in comparison with the majority of liquid (and glass-forming) chalcogenides. This appears to be due to the existence of M-SC transitions, hidden below T m, which are driven by structure-related thermodynamic and kinetic anomalies. The knowledge of the transition-related property changes is essential for understanding of switching behaviors. The M-SC for a wide range of compositions seems to be confined to a narrow range of values of a new parameter, the metallicity M P. Given that all PCMs are concentrated in a zone of M P = 0.48–0.49, the metallicity concept may provide useful guidance for future PCM designs.
Acknowledgments
P.L. acknowledges financial support from the National Science Foundation (NSF)–Division of Materials Research under Grant No. 1832817. C.A.A. acknowledges financial support from NSF Chemistry Division under Grant Nos. CHE-1213265 and CHE-185606. S.W. is grateful for discussion with P. Zalden and comments of M. Wuttig.

Shuai Wei is a postdoctoral researcher at RWTH Aachen University, Germany. He received his PhD degree in materials science in 2014 from Saarland University, Germany. He was a Humboldt Feodor-Lynen Fellow at Arizona State University and The University of Arizona. His research focuses on thermodynamics, kinetics, and structures of amorphous phase-change materials and bulk metallic glasses (amorphous metals). His awards include the RWTH Start-Up Fund, the Humboldt Feodor Lynen Fellowship, the Dr.-Eduard-Martin Award, a Materials Research Society Graduate Student Silver Award, and the Kühborth Award. Wei can be reached by email at swei@physik.rwth-aachen.de.

Pierre Lucas is a professor of materials science and engineering, and a professor of optical science at The University of Arizona. He received his PhD degree in physical chemistry from Arizona State University in 1999. He has authored more than 100 peer-reviewed articles and book chapters in the field of materials, calorimetry, and optics. He was past chair of the Glass and Optical Materials Division of The American Ceramic Society and is a senior member of SPIE, The International Society for Optics and Photonics. Lucas can be reached by email at Pierre@u.arizona.edu.

Austen Angell is a Regents’ Professor at Arizona State University (ASU). He received his BSc and MSc degrees from the University of Melbourne, Australia, and his PhD degree from Imperial College London, UK. He completed postdoctoral research at Argonne National Laboratory, and then joined Purdue University in 1966, moving to ASU in 1989. His research interests focus on supercooled liquids and glasses, particularly water and ionic liquids, anomalous liquids, and batteries. He has authored approximately 540 papers and reviews, with an H-index of 110 (Google scholar). His awards include the George W. Morey Award from The American Ceramic Society, the Joel Henry Hildebrand Award from the American Chemical Society, the David Turnbull Lectureship Award from the Materials Research Society, and the Max Bredig Award from The Electrochemical Society. Angell can be reached by email at caa@asu.edu.