I. INTRODUCTION
The fast development of microelectromechanical systems in the past decades has given rise to a high demand for mechanical testing procedures at the microscale, including fracture toughness testing techniques. Several methods have been proposed that evaluate the fracture toughness through microindentation with a sharp probe. Most popular is the Vickers Indentation Fracture Test where the fracture toughness, Kc, is determined using a Vickers probe and according to Eq. (1)Reference Anunmana, Anusavice and Mecholsky1:
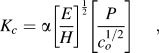
where P is the indentation load, E is the Young’s modulus, H is the hardness, co is the average length of the radial cracks generated by the indentation, and α is a dimensionless constant. Several refinements to Eq. (1) have been proposed,Reference Harding, Oliver and Pharr2–Reference Widjaja, Yip and Limarga4 taking into account the nature of the cracks, the residual stresses, and the plastic dissipation inside the material. All these expressions were derived from a combination of dimensional analysis and empirical observations, but they are not supported by a closed-form analytical model. Moreover, indentation fracture testing techniques require considerable care to measure the average length of the cracks that expand from the four corners of the probe. Despite recent advances in optical imaging devices, considerable uncertainties can arise because of the observer skill and subjectivity or because of possible spalling around the indentation impression.
This article presents an alternative technique to measure the fracture resistance using microscratch test. In fact, the microscratch test is popular today in many applications involving material characterization, including adhesion properties of coatings,5, Reference Ollendorf and Schneider6 damage and wear of metals and polymers,Reference Wredenberg and Larsson7 as well as strength of materials.8, Reference Bard and Ulm9 In this article, we present a novel technique that extracts the fracture toughness from the measured forces and depth of penetration during a microscratch test carried out with a Rockwell probe. The scratch test is first modeled using Linear Elastic Fracture Mechanics, and an expression of the fracture toughness is derived. From this model, an inverse technique is implemented. Application to several materials, ceramics, metals, and polymers, with a range of fracture toughness covering more than two orders of magnitude, yields values of the fracture toughness in agreement with values determined using conventional fracture testing methods such as the three-point bending test on single-end notched sample or the compact tension test.
II. ANALYTICAL MODEL
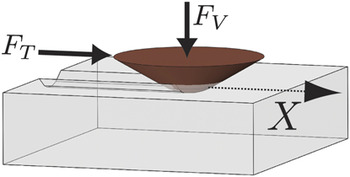
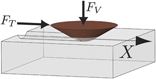
A scratch test consists in producing a scratch in the sample using a stylus which is drawn across the sample under constant or progressively increasing vertical load and with a constant speed as displayed in Fig. 1.
Three dimensional (3D) schematic of a scratch test.

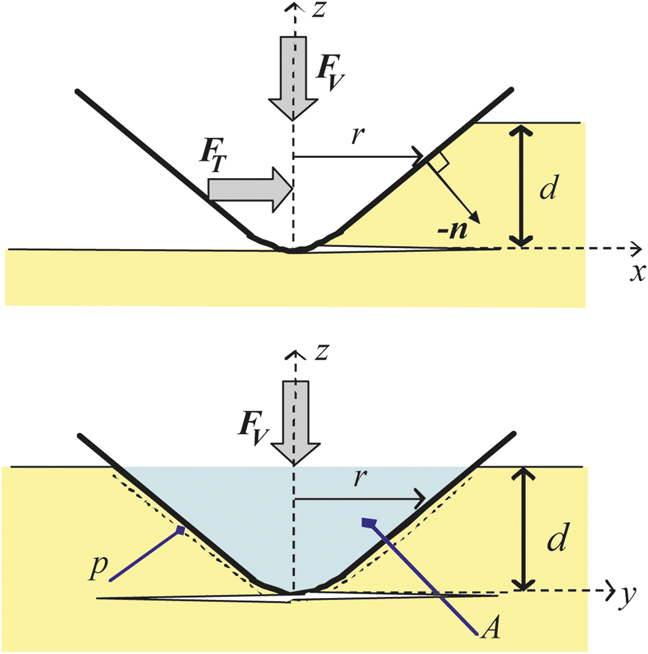
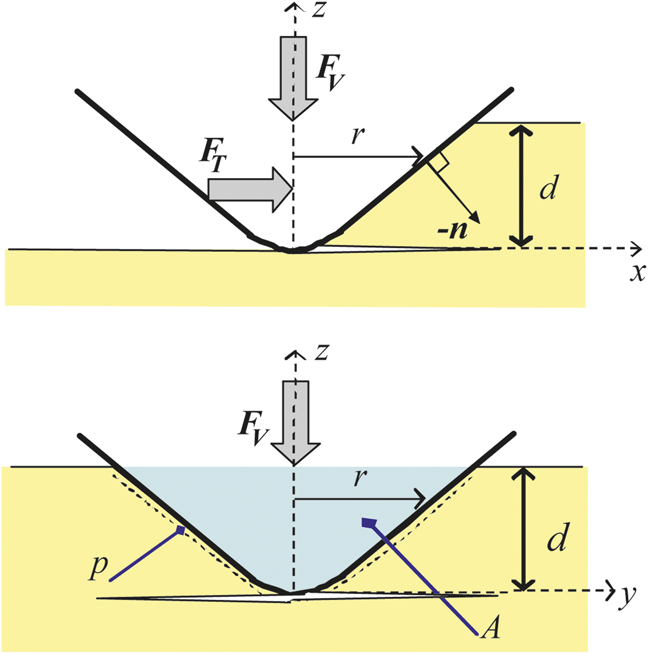
To understand the scaling of the forces generated during the scratch test, we consider the schematic representation of the geometry on Fig. 2: an axisymmetric probe is pushing into a material at a penetration depth d. S is the interface between the probe and the material,  is the projection of S on the plane normal to the x direction, p is the perimeter, n is the outward unit vertical to S, and nx is the component of n in the x direction. We hypothesize the existence of semicircular horizontal crack planes, emanating from the probe tip, as shown in Fig. 2(a).
Two dimensional representation of a scratch test with an axisymmetric probe. (a) Side view. (b) Front view. x is the direction of the scratch. FT is the horizontal force, FV is the vertical force, and d is the depth of the scratch. n is the outward unit normal to the probe-material interface, A is the projected horizontal load bearing contact area, and P is the perimeter.
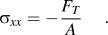
Furthermore, the material is assumed to be homogeneous linear elastic isotropic, and the influence of the vertical force FV on the fracture process is neglected. The stress field ahead of the probe is estimated to be uniaxial:
Using Linear Elastic Fracture Mechanics methods to evaluate the energy release rate of the system,Reference Barenblatt10 the following relationship is found between the horizontal force, FT, the perimeter, p, the horizontal projected load bearing contact area, A, and the fracture toughness, Kc Reference Akono, Reis and Ulm11, Reference Akono and Ulm12, Reference Akono and Ulm21:
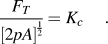
Therefore, the determination of Kc requires knowing the variations of the following function:

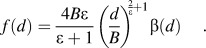
where d is the penetration depth. In the following paragraph, we will specify f for different geometries.
A. General axisymmetric probe
Consider an axisymmetric probe defined by a monomial function of the form:

where B is the height at unit radius and ε is the degree of the homogeneous function. The projected contact area A and perimeter p are then given byReference Akono and Ulm12:
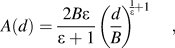
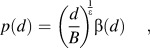
where β is a dimensionless parameter defined by:
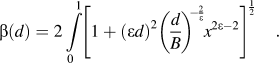
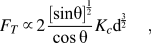
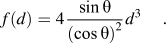
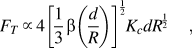
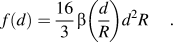
The scaling of the horizontal force FT and the variation of function f with d then readReference Akono and Ulm12:

III. EXPERIMENTAL
A. Materials
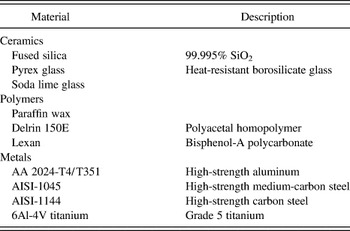
The materials used in this investigation are summarized in Table I. They were chosen to cover at least two orders of magnitude in fracture toughness. They include three ceramics (soda lime glass, pyrex glass, and fused silica), three polymers (paraffin wax, Delrin 150E, and Lexan) one soft metal (aluminum 2024-T4/T351), and three hard metals (AISI-1045, AISI-1144, and titanium 6Al-4V). Metals and ceramics were supplied by McMaster Carr (Robbinsville, NJ) as rods with a radius ranging from 1.3 to 1.9 cm. Delrin 150 E was also supplied as a 1.3-cm-diameter rod, whereas a 1.3-cm-thick Lexan plate was purchased from General Electric (Boston, MA). Finally, slabs of paraffin wax were purchased from Polygon Corporation (Boston, MA).
Materials used in the microscratch investigation.

B. Materials surface preparation
The main objectives of the surface sample preparation are: (i) to achieve as flat as possible a surface, (ii) to increase the accuracy of the determination of the fracture toughness, and (iii) to obtain repeatable results. The procedure described below is inspired from standard materials polishing methods used for nanoindentation.Reference Miller, Bobko, Vandamme and Ulm13
The first step consists in cutting a specimen of appropriate size with a brand saw or with a water-jet cutting machine. The specimens were cylindrical with a diameter ranging from 1.3 to 1.9 cm and with a height less than 1 cm.
The second step consists in flattening the faces of the specimen with a milling machine.
The third step is a coarse grinding step. The aim of this step is to improve the parallelism of the top and bottom faces. This is done with a 240 grit aluminum oxide sanding paper (McMaster Carr, Robbinsville, NJ). Afterwards, the sample is cleaned in an ultrasonic water bath for 5 min.
The last step is manual dry polishing. A Fibremet (Buehler) abrasive disc of a given size is mounted on a flat glass surface, and the surface of the specimen is gently brushed against the abrasive disc for 30 s to 1 min. Four different sizes of abrasive are consecutively used: 9, 3, 1, and 0.3 μm.
The final arithmetic average roughness achieved, R a, ranged from 0.01 to 1.55 μm with an average of 1.17 μm and a standard deviation of 1.21 μm. These values were more than an order of magnitude smaller than the maximal depth of penetration during the scratch test.
C. Equipment and testing procedure
Both the CSM Instruments Revetest Scratch Tester,Reference Randall, Favaro and Frankel14 with a capacity up to 200 N, and the CSM Instruments Micro Scratch Tester (Neuchatel, Switzerland), with a capacity up to 30 N, were used with a 200-μm Rockwell diamond indenter. With the former, it is possible to reach high loads and characterize very tough materials such as metals, whereas the latter provides a high resolution at small loads, required for soft materials such as paraffin wax.
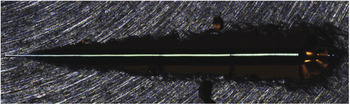
The scratch tests were performed with the Prescan procedure, which consists of two stages: first, the surface is scanned by the tip of the indenter with minimal load (0.03 N). Second, the scratch test is made, during which the penetration depth is recorded. In addition, for archive purposes, panoramic imaging was used. The Panorama imaging consists of recording the entire scratch image, which is synchronized to all recorded signals and is saved with the data. An example of such Panorama image is shown on Fig. 3.
Panorama image of a scratch on AA2024-T4/T351.

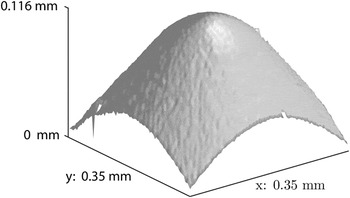
Moreover, the indenter used for testing, a 200-μm Rockwell diamond indenter, is a cone of half-apex angle θ = 60° that ends into a hemispherical tip of radius R = 200 μm and the transition from the cone to the sphere occurs at a depth of do = (1 − sin θ) R = 0.134R = 26.8 μm. Figure 4 represents a three dimensional image of the tip of the indenter, obtained with a CSM Instruments ConScan surface profilometer.
3D geometry of a Rockwell diamond indenter with tip radius of 200 μm and a half-apex angle θ = 60°. The picture was obtained using a CSM Instruments ConScan surface profilometer.

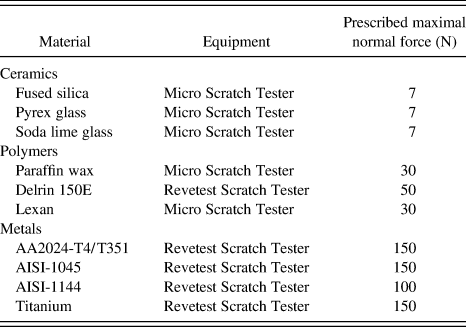
Because for a conical indenter the forces scale in a self-similar way [cf Eqs. (11) and (12)], the maximal vertical load for testing was chosen so as to have, for each material, a maximal depth in the conical range of the indenter. For metals and polymers, the maximal load ranged from 50 to 200 N for tests with the Revetest Scratch Tester and was equal to 30 N for tests with the Micro Scratch Tester. However, due to their high brittleness, ceramics exhibited a lot of chipping when tested at such high loads; this led to some fluctuations of both penetration depth and horizontal force. To reduce the amount of chipping, very low loads, 7 N, were used and, consequently, the tests occurred in the spherical region of the indenter. For all tests, the scratch length was 3 mm and the loading rate ranged from 14 to 300 mm/min so that each test lasted 30 s. The parameters of the testing procedure are summarized in Table II.
Testing parameters. In all tests the scratch length was 3 mm and each test lasted 30 s.

IV. RESULTS
A. General characteristics of the load–penetration depth curves
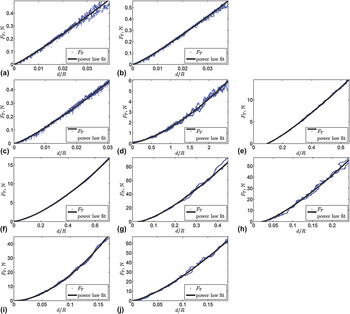
Figure 5 displays the horizontal load–penetration depth curves obtained for the materials used in this study. The horizontal force FT is less than 1 N for ceramics, less than 10 N for polymers, and less than 100 N for metals. The ratio of penetration depth-to-indenter radius, d/R, is in the range 0–0.04 (0 ≤ d ≤ 8 μm) for ceramics and in the range 0–2.5 (0 ≤ d ≤ 500 μm) for polymers and metals.
Horizontal force–penetration depth curves. (a) Fused silica, (b) pyrex, (c) soda lime glass, (d) paraffin wax, (e) Delrin 150E, (f) Lexan, (g) AA2024-T4/T351, (h) AISI-1045, (i) AISI-1144, and (j) 6Al-4V titanium.

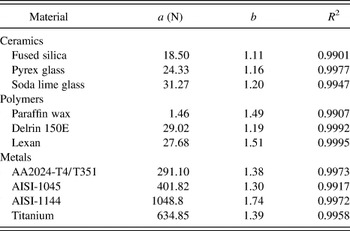
To understand the scaling of the horizontal force, the curve FT (d/R) was fitted, using a nonlinear least squares procedure, to the model function y = a(x − c)b. The fitting parameters for all materials are summarized in Table III. For ceramics, the exponent, b, is very close to 1, which is the theoretical value for a spherical indenter [see Eq. (13)]. This is consistent with the fact that the tests for ceramics occurred in the spherical range of the Rockwell indenter.
Fitting parameters for the horizontal load–penetration depth curves, the model function being y = a(x − c)b.

As for polymers, except for Delrin 150E, the exponent b is close to 1.5, that is the theoretical value for the conical indenter, [see Eq. (11)]. In fact, for depths d/R >> 0.15 (d ≥ 30 μm), the indenter can be approximated by a cone. This is the case for the tests on polymers, with a maximum penetration depth d max/R > 0.6 (d ≥ 120 μm).
Finally, for metals, except for AISI-1144, the exponent b is between 1 and 1.5. This indicates that both the spherical and the conical part of the indenter are influencing the test.
B. Calibration of the indenter shape
To predict the fracture toughness, we need to calibrate the indenter shape function, f = 2p(d)A(d). f is proportional to d 3 in the case of a conical indenter and to d 2 in the spherical case. Here, we calibrate the indenter shape for two scales of depths: 0–8 μm for ceramics and 0–500 μm for polymers and metals.
For the ceramics, from the scaling of the horizontal force, we assume the following expression of f:

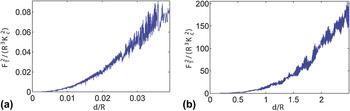
δ captures the spherical shape, whereas γ accounts for the blunting of the tip. The chosen reference material was fused silica, which is also commonly used to calibrate the indenter’s tip area function in nanoindentation applications.Reference Briscoe, Fiori and Pelillo15, Reference VanLandingham, Juliano and Hagon16 The fracture toughness of fused silica found in the literatureReference Harding, Oliver and Pharr2 from three-point bend chevron notch tests is equal to 0.58 MPa·m1/2. A linear least squares fit of f yielded δ = 54.51, γ = 0. Figure 6(a) displays f versus d/R.
Indenter shape function calibration: fitted curves. FT is the horizontal force, d is the penetration depth, Kc is the material fracture toughness, and R = 200 μm. (a) Fused silica: f(d/R) = 54.51(d/R)2. (b) Paraffin wax: f(d/R) = 13.02(d/R)3.

As for metals and polymers, function f was chosen so as to take into account the contributions from the conical, the spherical part of the indenter while allowing some blunting of the tip:

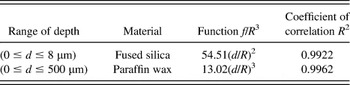
The reference material used was paraffin wax, whose fracture toughness, 0.15 MPa·m1/2, was measured by three-point bending tests. Paraffin wax being soft, it was possible to reach high penetration depth within the conical range of the indenter (d max = 500 μm, d max/R = 2.5). It was found: α = 13.02, δ = 0, γ = 0. The value of α is close to the theoretical value for a conical indenter of half-apex angle θ = 60°, α th = 4sinθ/(cosθ)2 = 13.86. Figure 6(b) displays f versus d/R, and all calibration coefficients are summarized in Table IV.
Indenter shape calibration function for different scales of depth f = 2pA. A is the horizontal projected load–bearing area and p is the perimeter.

C. Discussion
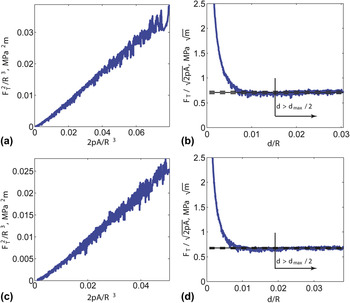
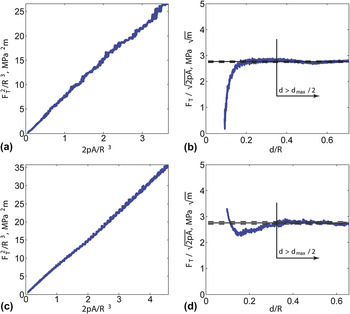
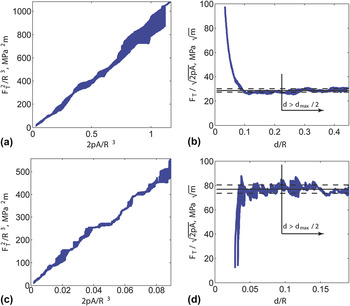
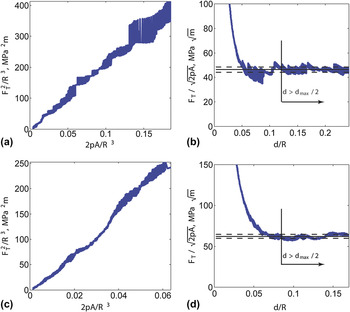
Figures 7–10 display the curves  versus 2pA/R 3 for the materials considered in this investigation. For ceramics, 2pA/R 3 was determined to be 54.51(d/R)2 from the calibration performed using fused silica. As for metals and polymers, 2pA/R 3 was determined as 13.02(d/R)3, which is the calibration function found with paraffin wax. As shown in Figs. 7–10, there is a linear scaling between
 and 2pA/R 3. This is in agreement with the scaling predicted by Eq. (3). This validates the calibration functions determined on fused silica and paraffin wax.
Fracture scaling of scratch tests: ceramics. (a) and (b) Pyrex. (c) and (d) Soda lime glass.

Fracture scaling of scratch tests: polymers. (a) and (b) Lexan. (c) and (d) Delrin 150E.

Fracture scaling of scratch tests: aluminum and titanium. (a) and (b) AA2024-T4/T351. (c) and (d) 6Al-4V titanium.

Fracture scaling of scratch tests: steels. (a) and (b) AISI-1045. (c) and (d) AISI-1144.

We use Eq. (3) to compute the fracture toughness. The quantity FT/[2pA]1/2, reminiscent of a stress intensity factor, is plotted versus d/R; we correct the scratch force FT by the off-set value of the linear fitting relation,  versus 2pA/R 3. Figures 7–10 show that, for all materials, the dimensionless force converges toward a constant value as predicted by Eq. (3). At small depths of penetration, there is some deviation that can be attributed to localized plastic deformation. The load–independent fracture toughness, Kc, was then calculated by taking the average and standard deviation of FT/[2pA]1/2 for penetration depths greater than half of the maximum depth:
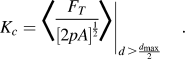
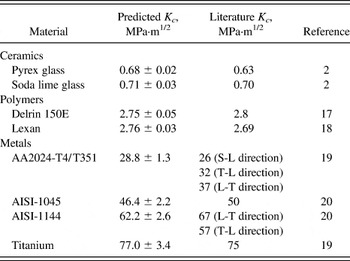
Table V compares the predicted values of Kc with literature values. For ceramics (pyrex and soda lime glass) and polymers (Delrin 150E and Lexan), there is an excellent agreement between the predicted fracture toughness and the literature value, with a relative error ranging from 2 to 8%. Given the homogeneous, isotropic, and elastic nature of these materials, the good agreement between experimental and literature fracture toughness values validates the proposed fracture approach for scratch test interpretation. A similar agreement is generally found for the tested metals. For AISI-1045 and for 6Al-4V titanium the predicted Kc values are within 3–7% of the literature values. Yet, we note that some of the metals exhibit anisotropy and heterogeneity at grain boundaries, which may explain the difference between our measurements and literature values, namely for AA 2024-T4/T351 and for AISI-1144, for which the Kc values of the literature display anisotropy. This anisotropy is not taken into account in our scratch fracture model and goes beyond the scope of the present study. The present isotropic model is thus restricted to the prediction of fracture toughness values within the bounds of the different measured literature fracture toughness values.
Predicted fracture toughness values versus literature values.

V. CONCLUSIONS
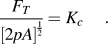
The proposition and implementation of a simple analytical Linear Elastic Fracture Mechanics model of the scratch test provides a means to determine the fracture toughness from the forces measured during the test and to the geometry of the probe:
This determination of the fracture toughness is enabled through the calibration of the indenter shape function:

The calibration of the indenter shape function is achieved by using samples of known fracture toughness. For a 200-μm Rockwell diamond indenter, we propose to use fused silica for small scratch depths, 0–8μm, relevant for hard materials, and paraffin wax for large depth ranges, 0–500μm, relevant for soft materials.
To validate the proposed approach, scratch tests were performed on ceramics, polymers, and metals, spanning fracture toughness values over more than two orders of magnitude. In particular, the linear scaling between  and 2pA for all tested materials confirmed the chosen fracture approach, with FT/[2pA]1/2 converging toward a constant value representative of the fracture toughness. The so predicted toughness values are in excellent agreement with literature values. All this opens new venues of application of microscratch tests as a means to characterize the fracture toughness of materials.