I. Introduction
The craft brewing industry has grown rapidly during the 21st century, as has the number of breweries, imposing economic pressure on traditional breweries. The Brewers Association (2018a) defines a craft brewery as one producing 6 million barrels of beer or less annually, not being 25% or more owned by a non-craft alcohol industry member, and brewing the majority of its total beverage alcohol volume from traditional or innovative brewing ingredients. In 2017, craft sales amounted to $26.0 billion, accounting for 12.7% of U.S. beer sales volume and 23.3% of sales value. Larger breweries have acquired craft breweries in recent years to capture a share of the growing craft beer segment and negate their diminishing sales—for example, in 2015 Constellation acquired Ballast Point Brewing Company for $1 billion and Heineken acquired 50% of Petaluma-based Lagunitas for an undisclosed sum.
In this study, I seek to determine how consumers’ willingness to pay (WTP) for beer changes with their knowledge of whether or not a product is independently and locally produced. I implement a choice experiment in which each participant's initial and uninfluenced selection is compared with ten other beers chosen at random from a bar's tap list. By structuring the experiment in such a way that consumers may switch from their original selection, I elicit realistic consumer responses. I am able to estimate consumer valuation of beer characteristics and identify self-sorting into different beer style and price segments. Using hedonic analysis and fixed effects modeling of the resulting data, I find that consumers prefer local and certified independent craft beer.
II. Experimental Design
The experiment was similar to that of Gustafson, Lybbert, and Sumner (Reference Gustafson, Lybbert and Sumner2016) who estimated consumer valuation of wine varieties and appellations. The Becker-DeGroot-Marschak (BDM) (Becker, DeGroot, and Marschak, Reference Becker, DeGroot and Marschak1964) method was used to elicit accurate WTP from participants. After they made an initial selection, participants were told they had a chance to receive a discount of up to $2.00 on their beer purchase. They were asked to state their WTP for each of ten alternative beers. They were told that each of those ten alternative beers will be assigned a randomly selected experimental price that is up to $2.00 below its actual price and that, at the end of the experiment, one of those ten beers will be selected at random and the participant's WTP will be compared to the experimental price for that beer. If their WTP for that selected beer was higher than the experimental price, the participant was issued a coupon to purchase that beer at the experimental price. This approach incentivized honesty for two reasons: (1) If individuals overstated their WTP, they may be issued a coupon for a beer that they would not wish to purchase at the experimental price. (2) If they understated their WTP, they may miss the opportunity to receive a discount for a beer they were actually willing to purchase.
To encourage participation, each participant was given a beer tasting glass emblazoned with the slogan: “I drink beer for Science.” The gift of the glass was used as a lower cost extrinsic motivation tool, not as a monetary reward, and its message provides intrinsic and image motivation. Individuals have the feeling they are assisting scientific research, and they receive a token to show their peers what they have done. Research has shown that intrinsic motivation can be sufficient for incentivizing research participants (Smith and Walker, Reference Smith and Walker1993), that the context in which a participant is selected to participate can be as important as the incentive (Levitt and List, Reference Levitt and List2007), and that the visibility of an individual's contribution can be motivating (Ariely, Bracha, and Meier, Reference Ariely, Bracha and Meier2009). Additionally, Heyman and Ariely (Reference Heyman and Ariely2004) found that gifts can be more effective than monetary incentives in motivating participants.
The experiment was carried out at the “University of Beer” in Davis, California, a bar that exclusively sells beer and cider, boasting a selection of 60 products on tap. Individuals were approached at random, usually before or after they ordered their first drink, told of the experiment, and invited to participate. A detailed explanation of the experimental procedure can be found in the Appendix.
III. Data
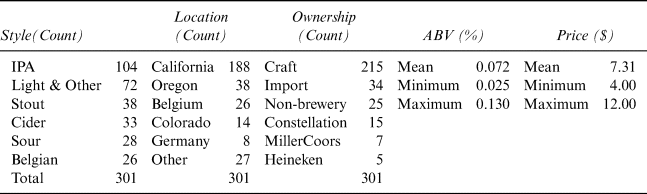
I collected data from 301 unique participants, combining for 3,311 total observations of WTP (i.e., 11 observations per participant; 3,299 observations were useable for analysis). Table 1 provides descriptive statistics for the initial beer choice participants made during the experiment. The University of Beer categorizes available beer into six primary groups: Belgian, Cider, IPA, Light & Other, Sour, and Stout. IPAs constituted the largest share of initial picks, totaling 104 instances, 34.6% of the initial choices. This share corresponds with the finding from the Brewers Association (2018b) that IPA constituted 3.1% of the total beer market volume, but 33% of craft beer volume. Style choices provide some evidence that the preferences of the sample may be representative of the average craft beer consumer. Details pertaining to participants can be found in the Appendix.
Initial Beer Choice Summary

Notes: Style categories are defined by the University of Beer; any beer that does not classify as IPA, Stout, Cider, Sour, or Belgian, is in the “Light & Other” category. There are 301 participants.
Source: Author created using experiment data.
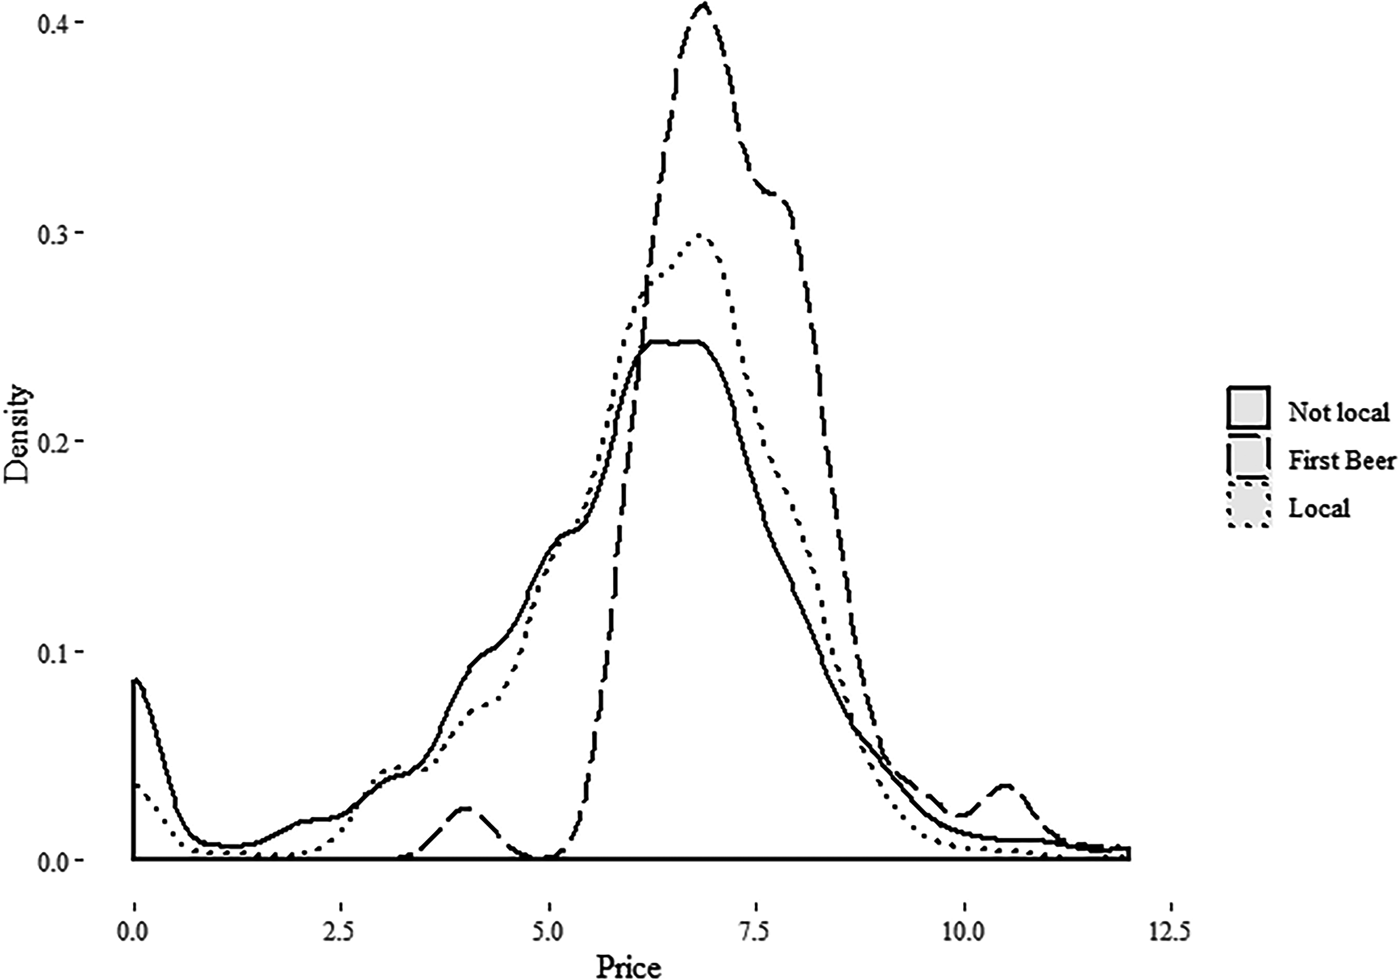
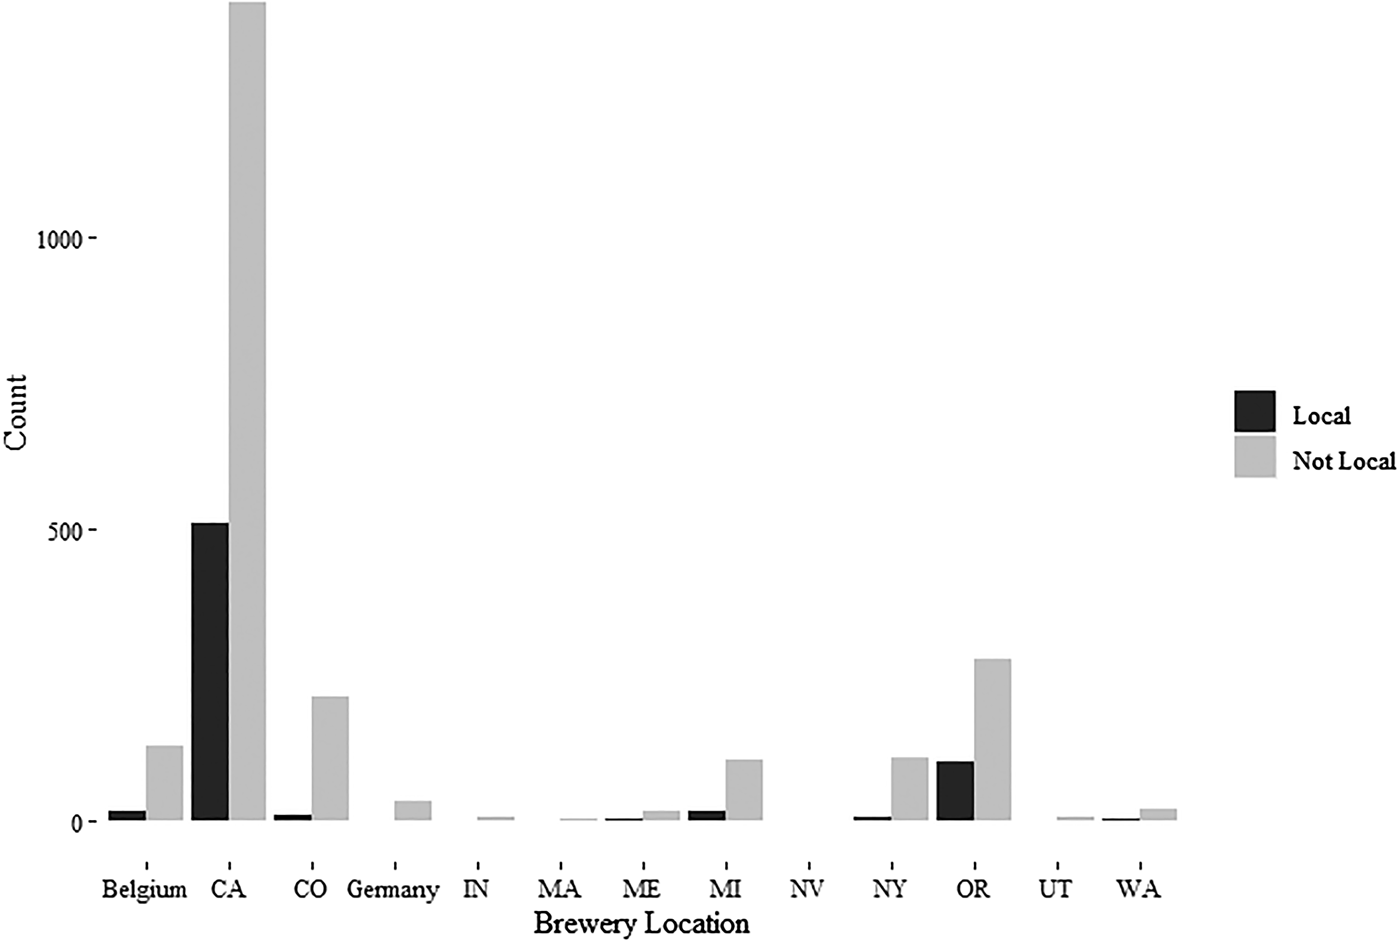
Figure 1 shows the distribution of WTP for beers considered to be local versus nonlocal, as well as the original selections of the participants. The distribution of the WTP for the initial choice is clearly offset to the right of the other distributions, whereas the distributions of WTP for local and nonlocal beers are quite similar. The distribution of WTP for local beer appears to be slightly to the right of that for nonlocal beer, but econometric analysis is necessary to determine if the difference is economically and statistically significant. The figure reflects what consumers identify as local, not what is geographically local to the place where the experiment is carried out. Figure 2 breaks down the origin of “local” beers, illustrating the flaw of assuming a universal definition. Participants identified beers from across the country and even internationally as being local. Some of the categorization can be attributed to individuals having moved to the area from other locations, but it is likely that some individuals were simply incorrect as to the home of some breweries. Regardless of whether or not the consumer correctly identifies a beer as being local, the belief that it is local may influence WTP.
Distribution of WTP for Local, Nonlocal, and Original Selections

Count of Local and Nonlocal Beers, by State and Country

IV. Model
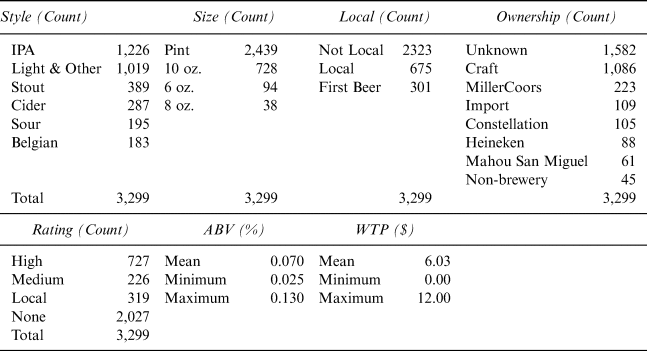
An econometric approach is used to determine the effects on WTP of the characteristics of both the participating consumers (j) and the beers they assessed (i). The tap price of the beer (price i) is regressed on measures of beer-specific attributes including alcohol content (ABV i) in % alcohol by volume, a categorical beer rating (rate i), and beer-specific fixed effects (beer i). Indicator variables are included that denote whether beer i was the initial selection (init i), if it was considered local by participant j (local ij), and if information was provided to the participant on the acquiring company or type of ownership (own ij). See Table 2 for summary variables.
Summary of Drawn and Initial Beers

Notes: Style categories are defined by the University of Beer; any beer that does not classify as IPA, Stout, Cider, Sour, or Belgian, is in the “Light & Other” category. There are 301 participants and 3,311 observations, but only 3,299 observations were used in the analysis. “Unknown” ownership indicates that the participant was in the control group. “Non-brewery” ownership only occurred for ciders.
Source: Author created using experiment data.
To discern if there is heterogeneity in the valuation of characteristics, a beer knowledge variable (know j) is interacted with the ownership treatment variable:
 $$\eqalignb{WTP_{ij} &= \beta _o init_{ij} + \beta _llocal_{ij} + \mathop \sum \limits_{q = 1}^Q \beta _qown_{ij} + \beta _kknow_j + \mathop \sum \limits_{q = 1}^Q \beta _{qk}own_{ij}{\,\ast\,}know_j \cr &\quad+\,{\mathop \sum \limits_{b = 1}^B \beta _bbeer_i + \beta _vABV_{ij} + \beta _rrate_{ij} + \epsilon _{ij}.\;} \cr} $$
The knowledge variable is determined by a quiz at the end of the experiment in which consumers identify breweries as being craft or not.
Individual-specific fixed effects are included to control for participant-specific variation, such as self-sorting into price segments, price anchoring, and other unobserved characteristics. Consumers may also sort into style segments. For example, a participant who originally chose an IPA may not be willing to consume sour beers, and this would be reflected in their WTP. To account for potential style sorting, an indicator variable signifying if a beer is the same style as the original choice (sort ij) is introduced and interacted with the local indicator and ownership treatment variables in Equation (2a). To allow for price sorting, the knowledge variable is dropped in favor of individual fixed effects in Equation (2b).
 $$ WTP_{ij} = & \mathop \sum \limits_{l = 1}^L \beta _llocal_{ij} + \mathop \sum \limits_{q = 1}^Q \beta _qown_{ij} + \mathop \sum \limits_{b = 1}^B \beta _bbeer_i + \beta _vABV_{ij} + \beta _rrate_{ij} + \beta _oorig_{ij} \cr + \,\beta _kknow_j + \mathop \sum \limits_{q = 1}^Q \beta _{kq}own_{ij}{\,\ast\,}know_j + \beta _msort_{ij} + \mathop \sum \limits_{l = 1}^L \beta _{lm}local_{ij}{\,\ast\,}sort_{ij} \cr + \mathop \sum \limits_{q = 1}^Q \beta _{qm}own_{ij}{\,\ast\,}sort_{ij} + \epsilon _{ij}.} $$
 $$ \eqalignb{WTP_{ij} & = \mathop \sum \limits_{l = 1}^L \beta _llocal_{ij} + \mathop \sum \limits_{q = 1}^Q \beta _qown_{ij} + \mathop \sum \limits_{b = 1}^B \beta _bbeer_i + \beta _vABV_{ij} + \beta _rrate_{ij} \cr & \quad + \beta _oinit_{ij} + \beta _nI_j + \beta _msort_{ij} + \mathop \sum \limits_{l = 1}^L \beta _{lm}local_{ij } {\,\ast\,}sort_{ij} \cr & \quad + \mathop \sum \limits_{q = 1}^Q \beta _{qm}own_{ij}{\,\ast\,}sort_{ij} + \epsilon _{ij} }$$
V. Results
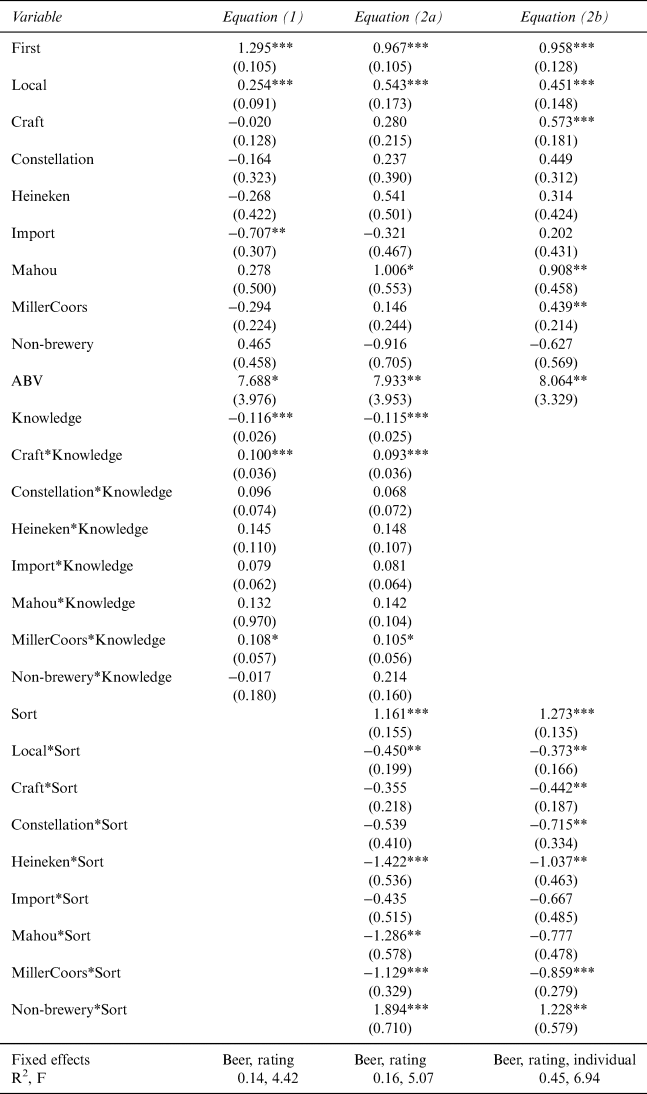
Estimation results from Equations (1), (2a), and (2b) are provided in the first, second, and third columns, respectively, of Table 3. The comparison of the results from Equations (1) and (2a) highlights the importance of controlling for consumer sorting into style categories. Equation (2b) is the preferred model, demonstrating significant changes in parameter estimates when controlling for consumer sorting into price categories. However, this model precludes analyzing the effect of consumer knowledge about craft beer on WTP. Results from Equation (2b) are the primary focus of discussion in this section, but the parameter estimates that relate the knowledge to certified craft beer in Equation (2a) are also discussed.
WTP for Local and Acquired Beer Controlling for Category Sorting

Notes: *** Denotes significance at 1%, ** at 5%, * at 10%. Numbers in parentheses denote standard errors.
Source: Author created using experiment data.
The marginal attribute price of being the customer's original selection is positive and statistically significant, increasing WTP by $0.96. Consumers likely chose their preferred beer as their initial selection, so this result is unsurprising. The category sorting variable is statistically significant, increasing WTP by beer in the same category as the initial selection by $1.27. This result suggests that the participants have preferred styles, and that they heavily discount beers outside of that style. The coefficient for beer identified as local is also positive and statistically significant, increasing WTP by $0.45. However, this premium is diminished when accounting for category sorting. The parameter for local beer that is in the same category as the initial selection is negative and statistically significant, decreasing WTP by $0.37. Although consumers exhibit a preference for local beer, the style of the beer is more important. Within consumers’ preferred style, the premium for local is insignificant. However, when choosing beer outside of this style, the local attribute has a significant value. The same relationship exists for certified craft beer. The premium is statistically significant, increasing WTP by $0.57. However, craft beer within the participant's preferred style is discounted by $0.44, negating the premium.
There are no absolute discounts associated with beers owned by a non-craft brewery. The parameters for Constellation, Heineken, import, and non-brewery are statistically insignificant. Beer owned by Mahou San Miguel or MillerCoors actually attract statistically significant premiums of $0.91 and $0.44, respectively. However, when a beer is in the same category as the initial selection, ownership by a non-craft brewery results in net discounts for some companies. Beers from Constellation, Heineken, and MillerCoors, which are the same style as the participant's original selection, are significantly discounted by $0.72, $1.04, and $0.86, respectively. Although consumers do not discount all beers produced by these companies, they devalue beers produced by these companies within their preferred style.
In Equation (2a), the base effect from the knowledge variable is negative and statistically significant, decreasing WTP by $0.12 per point scored on the end-of-experiment quiz. Knowledgeable participants are willing to pay less for beer are on average, but they place a premium on craft beer. The parameter estimate for craft beer is statistically insignificant, but there is a statistically significant premium for craft beer of $0.10 per knowledge point. Average consumers do not value craft beer differently from non-craft, but those with more knowledge of craft beer increasingly value the attribute.
VI. Conclusion
Choice experiments using the BDM method can be used to elicit accurate estimations of WTP without confounding supply and demand side effects by proposing non-hypothetical choices and incentivizing truthful responses. In this study, such an approach was used to determine WTP for local versus nonlocal beer, as well as certified independent craft beer versus beer produced by non-craft breweries.
No universal definition of “local” was adopted for the analysis. Instead, participants identified which beers they perceived as local at the end of the experiment. Local could refer to an individual's current location or hometown; furthermore, an individual's definition could refer to a small region or encompass multiple states. Regardless, consumers exhibited preferences for local beer across all models in the study. The marginal attribute price for local ranged between $0.25–$0.54, but the premium was lower for beer in the same category as the participant's original selection. The result suggests that consumers prefer local beer, but the premium for local beer is more significant for beer outside the consumers’ preferred styles. For example, an IPA lover is indifferent between a local and non-local IPA. He does not always drink sour beer, but when he does, he prefers local sour beer.
Several breweries have been purchased by large companies over the past few years, sparking outrage among craft beer enthusiasts. Ratings for acquired beers drop after acquisitions, and numerous angry threads can be found throughout popular online beer forums. However, my results suggest that this discontent is not universal. When I incorporate participant knowledge into the estimation, the premium for certified craft beer is significantly positive only for consumers with greater knowledge of craft beer. When I control for consumer sorting into price and style categories, the marginal attribute price for certified craft beer is significantly positive only for beer outside of a participant's preferred style category. Additionally, there is no significant discount associated with any of the beers acquired by non-craft breweries. However, there are significant discounts for some companies when an acquired beer was in the same style category as the participant's original selection. WTP may not be lower for acquired beer in general. However, for example, if a consumer prefers stouts, their WTP may be higher for a stout produced by a craft brewery than a brewery owned by a larger company. In general, consumers prefer local beer, but consumer preferences for craft versus acquired beer depend on consumer knowledge, the style of the beer, and the brewery's parent company.
Appendix
A1. Experiment Procedure
The participants were instructed to decide which beer they fully intended to purchase next, but to wait for more instructions before ordering the drink. The following details the systematic procedure for the experiment once an individual agreed to participate.
1. The participant is brought to a computer in the back of the bar to avoid influence or scrutiny from other patrons, because the presence of others can influence a participant's stated preferences (List et al., Reference List, Berrens, Bohara and Kerkvliet2004).
2. Participants begin by providing basic demographic data and information about their beer drinking habits, and any history of rating beers, brewing, or beer-related education.
3. The researcher provides and reads instructions for the experiment. The participant then practices one or more rounds of the experiment, until the individual is comfortable with proceeding.
4. At this point the choice experiment begins. The participants are divided into three random groups, to be given different information about the beers they will be assessing. Twenty-five percent of the participants are selected at random, to be given complete information about the beer's alcohol content, rating, brewery location, and ownership; 25% are selected at random to be provided no additional information; and the remaining 50% are provided some pieces of information, with some randomization of the details.
5. Each participant is asked to assess ten alternative beers, one beer at a time. These ten beers include three beers produced under ownership of a large company, three craft beers from California, and four other craft or imported beers. As much as possible, the ten alternative beers are selected to have characteristics in common with the initial choice; and in a similar price range. The price of the beer initially chosen, as well as any information provided on the bar's tap list, are provided on the screen at all times for comparison. The alternative beer has no price listed, instead there is a scroll bar for the participant's WTP. Participants move the bar to the price at which they are indifferent between the original and alternative; the scroll bar is in increments of $0.25, and the starting position is set to that of the originally selected beer. When participants have determined their WTP, they press a confirmation button to move on to the next beer.
6. After the ten beers have been assigned a WTP, the participant completes a quiz and an exit survey. The quiz asks the participant to identify the home state (or indicate that it is an import) of each of the beers they assessed, and to go through a list of 20 breweries and identify each of them as craft or non-craft to the best of their knowledge. The survey then prompts the participant to define “local” and to identify which of the beers from the experiment was local by that definition.
7. The computer then displays the discounted experimental price of one of the ten alternative beers, selected at random, and the participant's stated WTP. If the WTP is higher than the experimental price, the participant is issued a coupon to buy the beer at the experimental price. Otherwise, the participant receives a $2.00 coupon for their original selection. In either case, the beer to purchased and its discounted price are written on the coupon, and the participant may return to the bar to buy their beer. At this point, to conclude the interview, the participant receives the complimentary tasting glass.
A2. Consumer Demographics
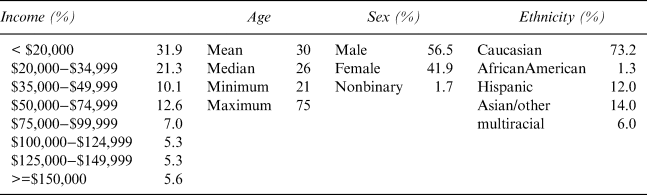
Table A1 summarizes a few key demographic characteristics of the participants in the experiment. The median income falls in the range of $20,000−$34,999, and the median age is 26. Julia Herz (Reference Herz2016) from the Brewers Association states that Millennials comprise 57% of weekly craft beer drinkers, thus, in general, the age and income of the sample appear to be representative of craft beer drinkers. Herz (Reference Herz2016) also states in the same article that only 25% of weekly craft beer drinkers are women, whereas the sample used in the present study is comprised of more than 40% women, which suggests that women might be overrepresented in the sample. However, other market research has reported significant growth in the share of women among craft beer drinkers; a 2016 report from Craft Brewing Business cites women as composing 32% of the craft beer market according to a Nielsen Report, and suggests that this share may be growing. Small Business Development Center Network (2018) cites women as accounting for 40% of craft beer consumers. The sample used in this study, therefore, may over-represent women compared with the market as a whole, but it is also possible that the sample reflects the trend of women consuming more craft beer. Furthermore, reflecting the racial composition of the Davis population, the sample is skewed towards Caucasians and Asians, leaving African Americans (1.3% of the sample) and Hispanics (12% of the sample) underrepresented. Herz (Reference Herz2016) states that African Americans and Hispanics encompass 10 and 21% of weekly craft beer drinkers, respectively.
Demographics Summary

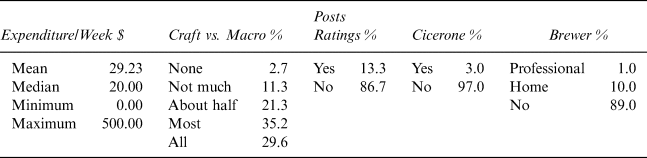
Craft beer consumption habits of the participants are summarized in Table A2. Participants typically consume craft beer regularly; the median individual spends $20.00 per week on beer on average. The participants are also primarily craft beer consumers; 35.2% claim that the majority of beer they consume is craft beer and 29.6% state that the only beer they consume is craft beer. To identify individuals who may be more knowledgeable about craft beer, participants were asked: “Do you post beer ratings?,” “Are you a certified Cicerone?,” and “Are you a brewer?” The answers reveal that 13.3% post beer ratings, 3% are certified Cicerones, and 11% brew beer either at home or professionally.
Beer Habits and Experience
A3. Additional References
Craft Brewing Business. (2016). Understand the age and changing demographics of craft beer drinkers (then market properly). Accessed May 15, 2018, https://www.craftbrewingbusiness.com/featured/understand-age-changing-demographics-craft-beer-drinkers-market-properly/.
Herz, J. (2016). Today's craft beer lovers: Millennials, women, and Hispanics. Accessed May 15, 2018, https://www.brewersassociation.org/communicating-craft/understanding-todays-craft-beer-lovers-millennials-women-hispanics/
List, J. A., Berrens, R. P., Bohara, A. K., and Kerkvliet, J. (2004). Examining the role of social isolation on stated preferences. American Economic Review, 94(3), 741–752.
Small Business Development Center Network. (2018). Brewery business 2018. Accessed May 15, 2018, http://www.sbdcnet.org/small-business-research-reports/brewery-business-2018.