I. Introduction
Entrepreneurship plays a vital role in stimulating economic growth through its significant contributions to job creation and innovation (Chemmanur and Fulghieri (Reference Chemmanur and Fulghieri2014), Haltiwanger, Jarmin, and Miranda (Reference Haltiwanger, Jarmin and Miranda2013)). Despite its benefits, entrepreneurship exhibits pronounced racial and gender gaps (Gompers and Wang (Reference Gompers and Wang2017)). Reducing these gaps can yield substantial effects on economic growth, the creation of jobs, and inequality. This underscores the importance of understanding the barriers that impede business formation among minorities and women (Ewens (Reference Ewens, Eckbo, Phillips and Sorensen2023)).
In this article, I examine how bank competition affects women’s and minorities’ propensities to become entrepreneurs by mitigating financial friction. To establish a causal relationship between access to finance and gaps in entrepreneurship, I leverage interstate bank deregulation that occurred from 1994 to 2021. My article finds that bank deregulation narrows gender and racial disparities in entrepreneurship. It fulfills this role through three main channels: enhancing the quantity and quality of banking services, and reducing discrimination within the financial market. Furthermore, equitable access to finance narrows the gaps in firm performance and thus facilitates the accumulation of business equity for female and minority entrepreneurs.
I focus on bank financing due to its pivotal role in entrepreneurial activities. The lack of startup capital has long been acknowledged as a critical factor impeding the success of businesses, particularly for minorities (Fairlie and Robb (Reference Fairlie and Robb2010)). Among different types of capital, Robb and Robinson (Reference Robb and Robinson2014) find that entrepreneurial firms rely heavily on bank financing instead of equity financing, and access to bank loans increases the size and the quality of firms. Nevertheless, various studies indicate that minorities and women are disadvantaged groups in the lending market when compared with Whites and men after controlling for creditworthiness (Alesina, Lotti, and Mistrulli (Reference Alesina, Lotti and Mistrulli2013), Asiedu, Freeman, and Nti-Addae (Reference Asiedu, Freeman and Nti-Addae2012), Blanchflower, Levine, and Zimmerman (Reference Blanchflower, Levine and Zimmerman2003), Fairlie, Robb, and Robinson (Reference Fairlie, Robb and Robinson2022), and Tootell (Reference Tootell1996)), which may impose limitations on the financing capabilities of minorities and women to establish a startup. Fairlie et al. (Reference Fairlie, Robb and Robinson2022) find that racial disparities in bank loans constitute the majority of the racial gaps in total financial capital. This underscores the significance of reducing racial gaps in bank loans as a crucial step in addressing entrepreneurial gaps. Financial frictions, such as credit rationing resulting from discrimination or bias, may be especially binding on these disadvantaged groups. Bank competition has the potential to alleviate barriers that hinder entrepreneurial opportunities for disadvantaged groups by allocating capital to these underprivileged groups with productive projects, thus reducing inequality. Therefore, understanding the effect of bank credit supply is of paramount importance. This article is the first to document that access to bank loans plays a pivotal role in diminishing gender and racial gaps in entrepreneurship.
My study comprises three parts. In the first part of my article, I establish that the relaxation of regulation reduces entrepreneurial gaps by instigating an exogenous improvement in credit accessibility for female and minority entrepreneurs. First, following Rice and Strahan (Reference Rice and Strahan2010), I construct a time-varying index to capture exogenous shocks to the supply of banking credit from 1994 to 2021 based on the 1994 Interstate Banking and Branching Efficiency Act (IBBEA) and the 2010 Dodd–Frank Wall Street Reform and Consumer Protection Act (Dodd–Frank Act). Effective in 1994, the IBBEA legalized interstate bank branching but allowed states to establish barriers to the entry of out-of-state banks. Over the subsequent years, several states gradually reduced these barriers. In 2010, the Dodd–Frank Act further eliminated the de novo interstate branching restrictions on a nationwide scale. Using this index and detailed household-level data from the Survey of Income and Program Participation (SIPP), I discover that the deregulation of interstate branching contributes to the reduction of gender and racial gaps in entrepreneurship due to a decrease in discrimination. After a state undergoes full deregulation, relative to their fully regulated counterparts, the probability of women or members of minority groups becoming entrepreneurs increases by 1.2%, which is equivalent to a 40% reduction in the gender gap and a 55% reduction in the racial gap in entrepreneurship. I also find that economies characterized by high levels of discrimination or bias against women and minorities witness a more substantial reduction in gaps in business formation after bank deregulation. This piece of evidence complements Becker’s (Reference Becker1957) argument that financial sector deregulation is expected to reduce discrimination due to the intensification of competition. Besides, the deregulation exhibits a greater strength effect in industries with higher dependence on external financing, suggesting that the relaxation of financial constraints narrows these gaps.
Second, I present evidence supporting the idea that bank deregulation reduces disparities in startup capital among entrepreneurs. This supports the notion that increased bank competition can eliminate financial barriers to entry for aspiring female and minority entrepreneurs who were previously subjected to loan rationing by banks before deregulation.
In the second part, I present channels in which bank deregulation reduces entrepreneurial financing gaps. I provide evidence by demonstrating that bank deregulation reduces racial gaps in access to the financial market by improving the quantity and quality of banking services. First, exploiting the deregulation index and the data from the Federal Deposit Insurance Corporation (FDIC), I find that bank deregulation leads to an increase in the density of bank branches in counties with high proportions of minority borrowers. Furthermore, by integrating this index with the household-level data, I show that bank competition increases the probability of financial inclusion for minorities in comparison to their White counterparts. This result suggests that bank competition enhances the quantity of banking services for minorities who were previously underserved by mainstream financial service providers.
Second, I utilize data from the Consumer Financial Protection Bureau (CFPB) to assess the quality of banking services using the total number of consumer complaints against banks about fraud, poor customer service, and misselling (Begley and Purnanandam (Reference Begley and Purnanandam2021)). The findings reveal that deregulation improves the quality of banking services in zip codes with high minority shares of the population.
Third, I introduce a novel measure of discriminatory treatment using the narrative information along with the complaints provided by the CFPB data set based on the textual analysis method. The analysis conducted using this novel measure shows that increased competition diminishes the occurrence of discrimination complaints, especially in regions with a high proportion of minority consumers. Overall, my article indicates that competition can improve the quantity and quality of bank services within minority communities.
In the last part, I find the effect of bank deregulation on firms’ performance and business equity accumulation. First, I document the existence of gender and racial gaps in entrepreneurial firm performance, which aligns with previous findings (Fairlie and Robb (Reference Fairlie and Robb2007), (Reference Fairlie and Robb2009)). Then, I demonstrate that the deregulation of interstate branching reduces the performance gap between firms owned by privileged entrepreneurs (male and White entrepreneurs) and underprivileged group-owned firms (female and minority entrepreneurs). This effect was particularly prominent during the financial crisis when financial frictions were exceptionally high and credit was in short supply.
Second, I find that the reduction in entrepreneurial gaps in firm performance leads to a decrease in the inequality of business equity accumulation and wealth. The gender and racial gaps in business equity account for 49% and 26%, respectively, of the gaps in wealth accumulation. In fully deregulated states, wealth gaps can be reduced by 12% as a result of narrowed gaps in business equity in comparison to fully regulated states.
Overall, I document that the marginal benefits of financial inclusion for female and minority entrepreneurs who are shocked by changes in supply-side credit are significant. My results suggest that female and minority entrepreneurs face financial constraints and stand to gain from equitable access to finance.
II. Related Literature and Contribution
My article contributes to the literature on bank deregulation and entrepreneurship in several ways. First, my article provides new insight into the determinants of gender and racial gaps in entrepreneurship. Recent articles explore how to motivate female entrepreneurs from the following perspectives: reproductive rights (Zandberg (Reference Zandberg2021)), equal inheritance rights (Naaraayanan (Reference Naaraayanan2019)), network frictions (Howell and Nanda (Reference Howell and Nanda2024)), career risk (Gottlieb, Townsend, and Xu (Reference Gottlieb, Townsend and Xu2022)), and gender stereotypes of venture capital investors (Ewens and Townsend (Reference Ewens and Townsend2020), Hebert (Reference Hebert2025)). However, despite bank loans being the primary source of capital for entrepreneurial firms, the role of bank financing is under-researched. My article fills in the gap and provides evidence that local bank competition also matters for both gender and racial gaps and underscores the necessity for policy interventions aimed at promoting financial inclusion as a means to reduce these gaps.
Second, my article makes a dual contribution to the existing literature that investigates the impact of bank competition on discrimination in two ways. To start with, using the unexplained racial gap in outcome variables as an indirect measure of discrimination to detect discriminatory treatment is challenging due to the omitted variables.Footnote 1 To the best of my knowledge, my article is the first to develop a novel and direct measure of discrimination by employing textual analysis of the narrative information derived from complaints against banks. This method has the potential for application in other settings, considering the widespread availability of unstructured textual data.Footnote 2 It has already influenced subsequent studies examining the role of complaint disclosure in mitigating discriminatory lending practices (Li (Reference Li2023), Li and Zhou (Reference Li and Zhou2024)). Additionally, my results complement previous studies that demonstrate the capacity of competition to mitigate discrimination. Financial economists typically focus on the effect of bank competition on wage inequality and labor participation ratio through the standard Beckerian framework that predicts financial sector deregulation will lead to a reduction in labor market discrimination because of intensified competition (Becker (Reference Becker1957)). For example, Black and Strahan (Reference Black and Strahan2001) find that bank deregulation diminishes the wage gap between men and women, which can be attributed to the increased cost associated with discrimination against female bank employees. Levine, Levkov, and Rubinstein (Reference Levine, Levkov and Rubinstein2014) document that bank competition reduces the wage gap between Black workers and White workers by boosting the entry of entrepreneurial firms and reducing racial discrimination in the competitive labor market. There is, however, little evidence on whether or how bank competition reduces discrimination or bias in the financial market. My article is the first one to utilize the CFPB complaint data to show how bank competition reduces discrimination complaints within the financial market.
Third, my article complements the literature on the real effect of bank deregulation. So far, this literature documents that bank reform enhances the efficiency of capital allocation and thus boosts economic growth and entrepreneurial activities (Amore, Schneider, and Žaldokas (Reference Amore, Schneider and Žaldokas2013), Bai, Carvalho, and Phillips (Reference Bai, Carvalho and Phillips2018), Black and Strahan (Reference Black and Strahan2002), Cetorelli and Strahan (Reference Cetorelli and Strahan2006), Chatterji and Seamans (Reference Chatterji and Seamans2012), Cornaggia, Mao, Tian, and Wolfe (Reference Cornaggia, Mao, Tian and Wolfe2015), Fonseca and Matray (Reference Fonseca and Matray2024), Hombert and Matray (Reference Hombert and Matray2017), Jayaratne and Strahan (Reference Jayaratne and Strahan1996), Kerr and Nanda (Reference Kerr and Nanda2009), and Krishnan, Nandy, and Puri (Reference Krishnan, Nandy and Puri2015)). However, there is a lack of comprehensive understanding regarding whether or how bank deregulation contributes to economic growth with equity and inclusion. My article shows that deregulation serves as a catalyst for equitable development by securing equal rights to access finance. In addition to the well-established improved capital allocation channel, I find that bank competition can influence economic growth through talent allocation by expanding the range of career choices available and shaping economic opportunities for disadvantaged yet talented groups.Footnote 3
Fourth, my article also adds to the literature that explores the impact of deregulation on income and wealth inequality. Unequal access to finance has long been acknowledged as a prominent driver of persisting income inequality. Financial deregulation can reduce inequality in many ways (see Beck, Demirgüç-Kunt, and Levine (Reference Beck, Demirgüç-Kunt and Levine2007) for a detailed survey of this strand of literature). Access to finance can help poor people invest in physical and human capital (Célerier and Matray (Reference Célerier and Matray2019), Sun and Yannelis (Reference Sun and Yannelis2016)). Beck, Levine, and Levkov (Reference Beck, Levine and Levkov2010) find that bank deregulation reduces income inequality by boosting the labor demand and wage rates of low-skilled workers. Despite witnessing the participation rate of the disadvantaged group (women and minorities) in the labor market approaching that of the advantaged group (men and Whites) over the past 50 years, there continues to be an underrepresentation of disadvantaged groups in highly skilled occupations, particularly in the field of entrepreneurship. Theory shows that financial friction may lead to persistent income and wealth inequality when talented individuals, who are financially constrained, are impeded from becoming entrepreneurs (Banerjee and Newman (Reference Banerjee and Newman1993)). My article empirically tests and validates these theoretical predictions. It provides a crucial yet relatively underexplored mechanism by which access to finance can contribute to reducing inequality through its effects on the convergence in occupational distribution, especially in entrepreneurial career choices.
Finally, I update the bank deregulation index developed by Rice and Strahan (Reference Rice and Strahan2010). Their index is limited to data up until 2005. I extend the bank competition index to 2021 to track the changes in bank deregulation in recent years. Researchers may utilize the extended index to investigate the impact of bank competition within a broader context (e.g., during the period of financial crisis and the COVID-19 pandemic).
III. Institutional Setting and Data
In this section, I provide an overview of the legislative history of bank deregulation spanning from 1994 to 2021 and construct the bank branching deregulation index. Subsequently, I describe the data utilized in my analysis to examine the effect of bank deregulation on entrepreneurial gaps.Footnote 4
A. Bank Deregulation Index
There have been two important deregulatory laws in U.S. history that I exploit in my empirical analysis: The Riegle–Neal Interstate Banking and Branching Efficiency Act (IBBEA) and the Dodd–Frank Wall Street Reform and Consumer Protection Act (the Dodd–Frank Act). In this subsection, I discuss each of these acts in turn and elucidate their role in my empirical analysis.
1. The Riegle–Neal Interstate Banking and Branching Efficiency Act (IBBEA) of 1994
Banks were restricted from branching across state lines before the enactment of the Riegle–Neal Interstate Banking and Branching Efficiency Act (IBBEA) in 1994. The passage of this act, however, enables banks located outside a state to establish branches across state lines without prior permission.
Although IBBEA enabled interstate branching, states can use the four important provisions within the act to restrict or increase the cost of out-of-state entry. The four provisions are shown below.
Provision I: the minimum age requirement for the target bank of interstate acquirers. The IBBEA permits interstate branching through bank mergers, allowing states to set a minimum age requirement of up to 5 years for banks being acquired. Many states have set their age requirement at 5 years, though several states have lower standards (3 years or less) or no minimum age requirement. When a newly established subsidiary office is in a state with a minimum age requirement, the Bank Holding Companies (BHC) must wait for the subsidiary to meet this age before converting it into a branch.
Provision II: the state permission of de novo interstate branching. According to IBBEA, banks can only open new interstate branches if explicitly permitted by state law. The rules for establishing new branches increase competition for existing banks. With the ability to develop new branches, entering specific out-of-state markets becomes easier. If entry can only be achieved through interstate whole bank mergers, it may potentially distort or limit the entering bank’s choice of branch locations within the state.
Provision III: the state permission of interstate branching by acquiring a single branch or portion of an institution. The IBBEA allows states to decide whether an interstate merger transaction can involve the acquisition of just one branch (or several branches) of a bank rather than the entire bank. Allowing the acquisition of individual branches reduces the entry costs for interstate banks. Banks are not required to purchase a whole bank to enter a market, but can choose to buy those local branches they wish to acquire.
Provision IV: the statewide deposit cap on branch acquisitions. The IBBEA sets a state-level deposit concentration limit for interstate merger transactions at 30%. Additionally, IBBEA allows states to independently restrict the percentage of insured deposits within the state that can be controlled or held by any single bank or BHC. States can relax the concentration limit beyond 30% or impose a lower deposit cap for initial entries through interstate bank mergers. This regulation prevents banks from entering into larger interstate mergers.
Following the passage of the IBBEA, states retained the authority to revise each provision. Between 1994 and 2021, 47 states eased their banking regulation constraints, and 39 states modified their provisions more than once, indicating a gradual and mild deregulation process (see Table 1). I construct a bank competition index from 0 to 4 based on these four provisions following Rice and Strahan (Reference Rice and Strahan2010). The index is 0 if a state has no interstate branching restrictions. I add 1 to the index if a state has any of the four restrictions. For example, 1 will be added to the index: i) if the minimum age requirement for target banks of interstate acquisition is 3 years or more; ii) if de novo interstate branching is not allowed in a state; iii) if an out-of-state bank cannot enter the local market via the acquisition of branches instead of buying the whole bank; or iv) if the deposit cap imposed by the state is <30%. By definition, a smaller index value signifies greater competition due to relaxed restrictions on the entry of out-of-state banks, posing a challenge to local and community banks.

Table 1 Long description
A table with eight columns: State, Bank Deregulation Index, Effective Date, Minimum Age Requirement of Institution for Acquisitions, Allowance of de novo Interstate Branching, Allow Interstate Branching by Acquiring a Single Branch or Part of an Institution, Statewide Deposit Share Cap on Acquisitions, and Acts.
Key data points include:
* Alabama: Index 3, effective 5/31/2007, 5 years age requirement, de novo Yes, single branch Yes, 30% cap, Riegle-Neal Act.
* Alaska: Index 3, effective 7/21/2010, 3 years age requirement, de novo Yes, single branch Yes, 50% cap, Dodd-Frank Act.
* Arizona: Index 3, effective 7/21/2010, 5 years age requirement, de novo Yes, single branch Yes, 30% cap, Dodd-Frank Act.
* Arkansas: Two entries. One under Riegle-Neal (3/30/2011) with Index 2 and single branch Yes; one under Dodd-Frank (7/21/2010) with Index 1 and single branch No. Both have 5 years age requirement and 25% cap.
* California: Two entries (Riegle-Neal and Dodd-Frank), both Index 2, 5 years age requirement, de novo Yes, single branch No, 30% cap.
* Florida: Two entries. Riegle-Neal (7/1/2011) has Index 4 and No age requirement; Dodd-Frank (7/21/2010) has Index 2 and 3 years age requirement.
* Idaho: Two entries. Riegle-Neal (7/1/2015) has Index 4 and No age requirement; Dodd-Frank (7/21/2010) has Index 2 and 5 years age requirement. Both have No deposit cap.
* Iowa, Kansas, and Missouri: All have Index 1 under Dodd-Frank with 5 years age requirement and single branch No. Deposit caps are 15%, 15%, and 13% respectively.
* Montana: Four entries ranging from 2010 to 2019. Indices move from 1 to 3 as branching allowances (single branch) change from No to Yes.
* New York: Two entries. Riegle-Neal (7/18/2012) has Index 4 and No age requirement; Riegle-Neal (7/21/2008) has Index 3 and 5 years age requirement.
* Texas: Index 3, effective 6/14/2013, No age requirement, de novo Yes, single branch Yes, 20% cap, Riegle-Neal Act.
2. The Dodd–Frank Wall Street Reform and Consumer Protection Act
Section 613 of the Dodd–Frank Act allows out-of-state banks to open new branches in any state. This provision treats these banks as if they were chartered in that state. The 2010 Act removed barriers to interstate branching, which enhanced banks’ ability to compete nationally. The Act was a response to the Great Recession, designed to promote financial stability and protect consumers from harmful financial practices. This nationwide legal change was beyond any state government’s control and can therefore be considered plausibly exogenous to local economic conditions and entrepreneurial financing needs. I add 1 to the bank deregulation index if a state did not allow de novo branching before the Dodd–Frank Act to measure the effect of this law shock.
Previous research on bank competition relied on the deregulation index by Rice and Strahan (Reference Rice and Strahan2010). This index only extends to 2005 and captures just 61% of regulatory changes from 1994 to 2021. Researchers faced two options: limit their analysis to pre-2005 data or assume no changes after 2005. Both approaches could bias their findings.
I extend this index to 2021 using the Westlaw legal database to track recent regulatory changes (see Table 1 and Table A2 in the Supplementary Material).Footnote 5 My comprehensive index helps researchers assess bank competition effects more accurately. It covers key periods like the financial crisis and the COVID-19 pandemic.
To illustrate the historical evolution of branch network density, I examine the FDIC’s Summary of Deposits data. Figure A1 in the Supplementary Material shows that while the total number of branches declined after the financial crisis, the share of interstate branches increased steadily, reflecting growing integration across state lines and heightened competitive pressure on local banks.
B. SIPP Data
I examine whether bank deregulation reduces entrepreneurial gaps using household survey data from the SIPP for 1990–2019.Footnote 6 This data set suits my research for three reasons. Its longitudinal nature allows me to track households’ transition to entrepreneurship over time. The survey provides comprehensive individual-level information on demographics, jobs, and financing. The long sample period enables examination of bank deregulation’s long-term effects. After excluding individuals aged below 22 or above 60, my final sample includes 3,26,809 unique individuals.
Table A3 in the Supplementary Material reports summary statistics. The sample consists of 3,26,809 individuals, with 51% male and 29% minorities. Panel A shows that within 3 years, 6.1% of men and 4.0% of women become entrepreneurs. The racial gap in business creation is 1.4%. Panel B of Table A3 in the Supplementary Material illustrates the economic conditions and financial well-being of these individuals. It reveals that men and Whites generally have higher incomes and better financing access. Male entrepreneurs’ secured business debt averages 3 times that of female entrepreneurs. White entrepreneurs borrow more than double the business debt of minority entrepreneurs. However, male and White business owners also have twice the business equity of women and minority owners. These equity gaps represent 49% of the gender gap and 26% of the racial gap in household wealth. Panel C of Table A3 in the Supplementary Material summarizes the data concerning the characteristics of firms founded by households that already operate businesses when they enter the sample and participate in the interviews. It shows that most sample firms have under 25 employees. Consistent with Fairlie and Robb (Reference Fairlie and Robb2007), (Reference Fairlie and Robb2009), I find performance gaps in firm size and profits between male (White) and female (minority) entrepreneurs. Table A1 in the Supplementary Material defines all variables.
C. CFPB Complaint Data
The CFPB is a regulatory agency created under the Dodd–Frank Act in 2010. As an independent watchdog agency, its primary goal is to protect consumers from unfair, deceptive, or abusive practices and pursue legal action against companies that violate the law. The CFPB has established a mechanism for consumer grievances, allowing individuals to file complaints against financial institutions through an online system accessible on the CFPB website. The complaint database encompasses various financial products and serves as a tool the CFPB uses for its enforcement actions against banks.Footnote 7 The CFPB discloses the narrative information alongside the complaints on its website, which enables me to measure the quality of banking services and identify any discriminatory practices within the financial system using textual analysis.
IV. The Discussion of Demand-Side Hypothesis and Supply-Side Hypothesis
Two competing hypotheses explain how deregulation narrows entrepreneurial gaps: the demand-side hypothesis and the supply-side hypothesis. These hypotheses provide contrasting explanations for two key questions. The first and central question is why entrepreneurial gaps decrease. The supply-side hypothesis suggests that deregulation triggers a credit supply shock. When interstate banks expand across state lines, the increased credit supply leads to more loans for women and minorities. The demand-side hypothesis focuses on shifts in borrowing preferences. It suggests that rising income levels and improved financial education may increase credit demand from women and minorities, potentially narrowing these gaps.
These hypotheses also provide contrasting explanations for deregulation motives. On the supply side, the market power of banks drives local deregulation efforts. Regions with large interstate banks may pursue deregulation to expand their markets. On the demand side, rising credit demand from women and minorities may motivate legislative bodies to deregulate the banking system.
A review of the literature predominantly supports supply-side over demand-side explanations (Agarwal, Song, and Yao (Reference Agarwal, Song and Yao2022), Célerier and Matray (Reference Célerier and Matray2019), and Rice and Strahan (Reference Rice and Strahan2010)). Multiple empirical studies challenge the demand-side explanation using various methodological approaches. For example, studies employ placebo tests with credit union samples unaffected by deregulation—these institutions show no lending expansion in response to supposed demand increases. This indicates that demand factors alone cannot explain the observed lending expansion. Beyond placebo tests, researchers have examined local economic conditions, interest rates, and bank debt ratios, consistently finding evidence that contradicts demand-driven explanations. Table B1 in the Supplementary Material provides a comprehensive overview of these methodological approaches used in the literature. However, given the unique context of entrepreneurial finance, I conduct a thorough examination of both hypotheses in this setting, beginning with a comprehensive review of the literature on gender and racial gaps in risk aversion and borrowing tendencies to evaluate the plausibility of the demand hypothesis.
The difference in risk aversion between genders remains a significant topic, as seen in gambling studies and real-world observations (Bernasek and Shwiff (Reference Bernasek and Shwiff2001), Charness and Gneezy (Reference Charness and Gneezy2012), and Jianakoplos and Bernasek (Reference Jianakoplos and Bernasek1998)). These well-documented patterns in risk preferences persist across financial domains, as gender-based differences in risk aversion appear in various financial behaviors, including the asset allocation of retirement savings plans (Hinz (Reference Hinz, McCarthy and Turner1997)) and investment in common stocks (Bajtelsmit and VanDerhei (Reference Bajtelsmit and VanDerhei1997)). This tendency toward risk aversion makes women less inclined to borrow externally (Coleman (Reference Coleman2002)). Huang and Kisgen (Reference Huang and Kisgen2013) observe that male executives are more likely to issue debt in corporate finance. This pattern is also present in entrepreneurship, where Sena, Scott, and Roper (Reference Sena, Scott and Roper2012) find that male entrepreneurs are more likely than female entrepreneurs to seek external financing. Cowling, Marlow, and Liu (Reference Cowling, Marlow and Liu2020) report that during times of financial uncertainty, female business owners may display increased risk aversion, leading them to adopt more cautious strategies when applying for loans. Consequently, female entrepreneurs may exhibit a lower demand for credit.
Regarding racial differences, African Americans and Hispanics show a lower inclination to take on financial risks compared to Whites, even when controlling for sociodemographic characteristics such as education level and household income (Yao, Gutter, and Hanna (Reference Yao, Gutter and Hanna2005)). This racial disparity is apparent in stock and bond investment patterns (Zhong and Xiao (Reference Zhong and Xiao1995)). Similarly, minority entrepreneurs demonstrate a reduced propensity to borrow. Black entrepreneurs, in particular, tend to apply for loans less frequently (Bates (Reference Bates1989), Sena et al. (Reference Sena, Scott and Roper2012)). However, in contrast to the literature on the gender gap in borrowing tendencies, I do not find much research supporting the idea that this is due to greater risk aversion among minorities. Scholars have proposed several potential explanations for these racial gaps. For instance, the low frequency of loan applications by Black entrepreneurs is attributed to their high expectations of credit denial, even when they possess good credit histories (Fairlie et al. (Reference Fairlie, Robb and Robinson2022)).
While women and minorities traditionally show lower credit demand, their recent income and financial literacy improvements have increased demand for entrepreneurial opportunities. This rising demand may influence their borrowing activities and potentially reduce entrepreneurship disparities. I examine whether this rising demand drives increased borrowing and influences state deregulation decisions.Footnote 8
To explore the first channel, I analyze whether increased credit demand translates into higher equilibrium lending activities in deregulated states. My first analysis investigates business loan applications, where Table B2 in the Supplementary Material explores the relationship between deregulation and minority credit demand. Using Home Mortgage Disclosure Act (HMDA) data, which captures approximately 90% of U.S. mortgage originations as documented by Engel and McCoy (Reference Engel and McCoy2016), I analyze loan applications secured by home equity, focusing on refinancing loans where applicants’ demographic information is marked as not applicable (Avery, Brevoort, and Canner (Reference Avery, Brevoort and Canner2007)). The analysis reveals no significant increase in minority business loan applications during the deregulation year. This pattern persists into the subsequent year, with all coefficients remaining statistically insignificant. The findings strongly suggest that deregulation does not stimulate minority business credit demand.
I extend the analysis beyond refinancing loans used for business purposes to examine the complete range of mortgage loans. This broader scope provides a more comprehensive understanding of credit accessibility patterns. Table B3 in the Supplementary Material presents this analysis and examines how deregulation affects credit demand gaps across different demographic groups. The results show no statistically significant changes in credit demand disparities following deregulation. These findings hold consistently for both racial and gender gaps across various specifications. I conduct an event study analysis to provide additional evidence. Figure B1 in the Supplementary Material shows that racial and gender credit demand gaps remain stable throughout the deregulation period. Figure B2 in the Supplementary Material demonstrates that credit demand patterns for White males, minorities, and females all exhibit flat trajectories around deregulation events, with application numbers and loan amounts showing no significant responses to policy change.
To explore whether shifts in application behavior might explain these patterns, I extend the analysis to the demographic composition of mortgage applicants. Using HMDA data from 1990 to 2021, Table B4 in the Supplementary Material provides a thorough analysis of deregulation’s impact on applicant demographics. The examination reveals no significant effect on either minority or female application rates, with findings remaining robust after controlling for individual characteristics. The analysis confirms that deregulation does not alter the demographic composition of loan applicants.
Additional evidence comes from comparing local and interstate banks. Table B9 in the Supplementary Material shows that only interstate banks expand lending following deregulation, while local banks show no change—a pattern inconsistent with demand-driven explanations.
Having established that credit demand does not respond significantly to deregulation, I now turn to the second channel: whether demographic credit demand influences deregulation decisions. In examining the deregulation process, Table B6 in the Supplementary Material evaluates the relationship between credit demand and deregulation intensity. The analysis examines both minority and female application patterns separately, demonstrating no significant influence of local demand on state deregulation decisions. These results indicate that credit demand does not drive regulatory changes.
The supply-side hypothesis predicts that states dominated by large interstate banks might initiate earlier deregulation. Supporting this prediction, I find a significant negative correlation between state-level small bank ratios and deregulation indices. Further analysis in Table B7 in the Supplementary Material reveals that states with higher small bank ratios exhibit slower deregulation. A 1-standard-deviation increase in the small bank ratio is associated with a 7.7% decrease in the subsequent deregulation index. These results support the hypothesis that bank bargaining power influences deregulation decisions.Footnote 9
To distinguish between demand-side and supply-side explanations, I conduct comprehensive horse race regressions that systematically compare the relative importance of these factors. Table B8 in the Supplementary Material presents the key results, with additional robustness tests reported in Appendix B. The results strongly support the supply-side hypothesis, with supply factors consistently significant while demand factors remain insignificant across all specifications.
The empirical analysis strongly supports the supply-side explanation while finding no evidence for the demand-side hypothesis. The evidence suggests that financial institutions and other supply-side factors, rather than consumer credit demand, are the primary drivers behind deregulation legislation, ultimately contributing to lending market inequalities. In the following sections, I conduct formal tests of the supply-side mechanism to examine how increased competition among banks affects credit access for female and minority entrepreneurs.
V. Bank Deregulation and Entrepreneurial Activity Gaps
A. Startup Creation
1. Specification
I examine how minorities’ and women’s entrepreneurial choices change after deregulation, relative to those of Whites and men. These staggered deregulation events help isolate the impact of bank competition from other confounding state-level changes.Footnote 10
I use a linear probability model to analyze how bank competition affects entrepreneurship.Footnote 11

where
$ {Entrepreneur}_{i,s,\left(t+1,t+3\right)} $
 is a dummy variable that takes the value of 1 if a resident
$ i $
 in state
$ s $
 establishes a startup within 3 years after the first interview (startup creation period: year
$ t+1 $
 to year
$ t+3 $
 ).Footnote
12
$ {Dereg}_{s,t} $
 is the time-varying deregulation index at the state level. Zero is assigned to fully regulated states, while 4 represents fully deregulated states. Therefore, a smaller index value implies more stringent regulation in my specification. The indicator variable
$ {Minority}_i $
 (
$ {Gender}_i $
 ) is equal to 1 if individuals are minorities (women). Joint state-time fixed effects
$ {\alpha}_{s,t} $
 are included to capture local economic and political conditions that may impact entrepreneurship.Footnote
13 I include numerous fixed effects in equation (1): income deciles fixed effects, family structure, age, homeownership, education, marital status, and employment conditions.Footnote
14 I interact state-year joint fixed effects with income deciles fixed effects to absorb every unobserved heterogeneous time-varying local shock across different income groups. The inclusion of these fixed effects allows me to better control for confounding factors that influence entrepreneurial career choices. Standard errors are 2-way clustered by state and year to control for correlation within states and over time.Footnote
15 To identify my key coefficients
$ \beta $
 , I rely on comparing the entrepreneurial gaps between advantaged individuals and disadvantaged individuals with similar sociodemographic features and income in a treated state before and after bank deregulation, relative to a group of control states that do not experience regulatory changes.
2. Bank Deregulation and Startup Creation
Table 2 reports the results of my baseline regressions, which show the positive, significant, and robust effect of bank deregulation on reducing the gender and racial gaps in entrepreneurship.

Table 2 Long description
A table titled Entrepreneurship Gaps and Interstate Bank Deregulation. The dependent variable is Entrepreneur. The table consists of five columns representing different model specifications.
Key Independent Variables:
* Female: Coefficients range from minus 0.022 to minus 0.030, all significant at the 1 percent level.
* Minority: Coefficients range from minus 0.013 to minus 0.022, all significant at the 1 percent level.
* Dereg times Female: Coefficients are 0.003 in models 2, 4, and 5, significant at the 1 percent level.
* Dereg times Minority: Coefficients are 0.004 in models 2 and 4 (1 percent level) and 0.003 in model 5 (5 percent level).
Fixed Effects (F E):
* State times Year F E: Yes for models 1 and 2; No for others.
* State times Year times Income decile F E: Yes for models 3, 4, and 5.
* M S A times Year times Income decile F E: Yes only for model 5.
* Sociodemographics (Family kids, Family adults, Age, Homeowner, Education, Employment, and Marriage F E): No for models 1 and 2; Yes for models 3, 4, and 5.
Summary Statistics:
* Observations: 326,798 for models 1 and 2; 325,500 for models 3 and 4; 172,446 for model 5.
* R-squared: Increases from 0.014 in model 1 to 0.091 in model 5.
* Sample mean: 0.050 for models 1 through 4; 0.057 for model 5.
In column 1 of Table 2, I include two indicators for the gender and race of individuals and state-year joint fixed effects. Controlling for state-year joint fixed effects enables me to compare individuals in the same state-year. The coefficients on the variables Female and Minority are −0.022 and −0.014, respectively, each significant at the 1% level. These results suggest that women and minorities are 44% and 28% less likely, respectively, to become entrepreneurs compared to their counterparts, men and Whites. The economic magnitudes are derived from the ratio of each coefficient to 0.050.Footnote 16 In column 2, I introduce the interaction terms between the bank deregulation index and gender or race to study the effect of bank deregulation. The coefficients on the interaction terms are 0.3% and 0.4% for gender and race, respectively. Given that the mean value of transition into entrepreneurs is 5%, these coefficients suggest that each step of bank deregulation enhances the probability of women and minorities becoming entrepreneurs by 6% and 8%, respectively, relative to their privileged counterparts. The coefficients are also economically significant regarding the gender and racial gaps: a 1-unit increase in bank competition can diminish the gender and racial gaps by 12% and 20%, respectively.Footnote 17
In columns 3 and 4, a large set of household-level fixed effects and state-year-income decile joint fixed effects are introduced to control demand for bank credit and confounding factors that may impact entrepreneurship. The results are stable and robust, suggesting that deregulation reduces gender and racial gaps even after accounting for household-level characteristics. The inclusion of these stringent fixed effects allows for the computation of entrepreneurial gaps by comparing individuals within the same income decile-state-year. In this case, each step of bank deregulation diminishes the entrepreneurial gaps between individuals within the same income-decile-state-year relative to the entrepreneurial gaps between individuals with the same sociodemographics and income level in the same year but residing in a state that does not undergo deregulation.
Column 5 introduces MSA-year-income decile fixed effects and excludes observations with unavailable MSA information.Footnote 18 MSAs are regions with high population density that include a core area and adjacent areas sharing economic ties. I use MSA-year-income decile fixed effects to control for time-varying local factors, particularly labor market conditions.
The design allows me to compare individuals within the same MSA who live in different states. The results show that entrepreneurial gaps are smaller in deregulated states compared to adjacent states within the same MSA, even after controlling for local economic conditions.Footnote 19
Recent scholarly works have highlighted potential issues in dynamic difference-in-differences designs. In particular, when heterogeneous treatment effects exist, some units might be assigned negative weights when their outcomes contribute to the calculation of treatment effects. This situation has the potential to introduce bias to the estimated values (Borusyak, Jaravel, and Spiess (Reference Borusyak, Jaravel and Spiess2024), De Chaisemartin and D’Haultfœuille (Reference De Chaisemartin and D’Haultfœuille2020), and Goodman-Bacon (Reference Goodman-Bacon2021)).
To address this potential issue, I apply the estimation method proposed by Borusyak et al. (Reference Borusyak, Jaravel and Spiess2024), as detailed in the Supplementary Material.Footnote 20 The results are consistent with the standard OLS estimates, supporting the robustness of my findings (see Table E1 in the Supplementary Material). In the Supplementary Material, I conduct a single-time shock test using the Dodd–Frank Act as an exogenous shock. The Act allows banks to establish de novo branches in any state as if they were chartered there in 2010. This nationwide change is independent of state-level economic conditions. The results indicate strong deregulation effects after 2010, reflecting reduced entry barriers due to de novo interstate branching, which is less costly than acquisitions. This test also helps address concerns about staggered treatment groups.
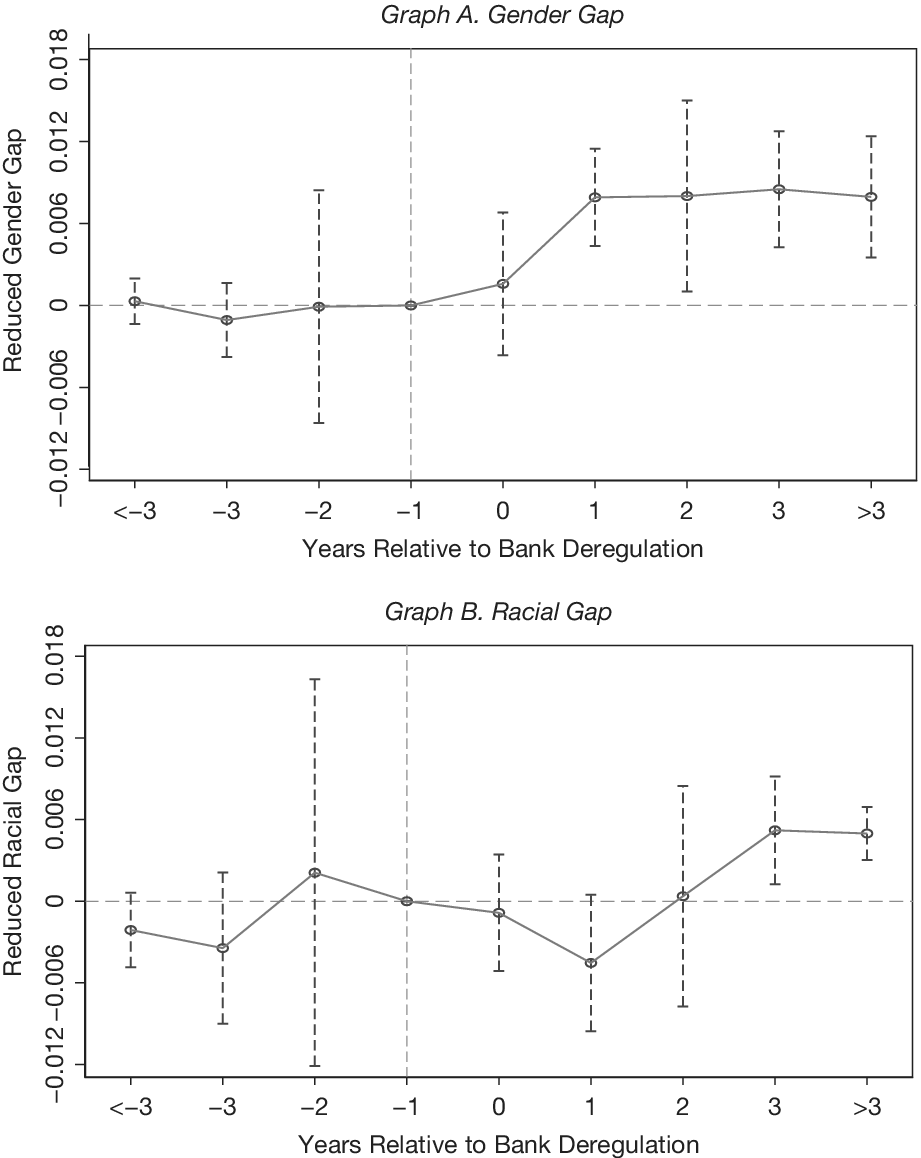
Figure 1 displays the dynamics of the reduced gender and racial gap in entrepreneurship around interstate bank deregulation. The specifications used in these two figures are identical to those in equation (1), except that I substitute the bank deregulation index with a set of dummy variables representing the years relative to bank deregulation and estimate the effect on gender and racial gaps separately. The gender and racial gaps exhibit a narrowing trend following deregulation, and no discernible pattern is observed before the deregulation year, suggesting that I can verify the parallel trend assumption.
Figure 1 illustrates a narrowing of both the gender and racial gaps in entrepreneurship surrounding the implementation of bank deregulation from 1990 to 2019. I use the same specification outlined in equation (1) in Section V.A.2, except that the bank deregulation index is substituted by a set of indicator variables
$ {\sum}_{t=-3}^3D(t) $
 , where
$ D(t) $
 is equal to 1 exactly
$ t $
 years before or after the deregulation year. The plot presents the dynamics of the reduced gender and racial gaps and 95% confidence intervals for
$ t=<-3,-3,\dots, 3,>3 $
 . The reference year is
$ t=-1 $
 (1 year prior to the deregulation year).

Figure 1 Long description
The figure consists of two panels, Graph A and Graph B. Both share a common X-axis labeled Years Relative to Bank Deregulation, ranging from less than minus 3 to greater than 3, with a vertical dashed reference line at minus 1. The Y-axis for both represents the reduced gap, ranging from minus 0.012 to 0.018.
Graph A. Gender Gap: The line remains near zero from year less than minus 3 to year minus 1. Following the deregulation year (0), the reduced gender gap increases sharply, peaking at year 3 with a value near 0.008. The 95 percent confidence intervals, shown as vertical dashed error bars, are wider before deregulation and narrow slightly as the gap stabilizes at a higher positive level after year 1.
Graph B. Racial Gap: The data shows more volatility. Before deregulation, the gap fluctuates between minus 0.004 and 0.002. After deregulation at year 0, there is an initial dip at year 1 to approximately minus 0.005, followed by a steady increase to a positive value of approximately 0.005 by year 3 and beyond. The confidence intervals are notably wider than those in the gender gap graph, particularly at year minus 2 and year 2.
I analyze the heterogeneous effects of bank competition on racial and gender gaps by dividing the sample based on sociodemographic characteristics. The coefficients are similar across different subsamples, suggesting my findings are not driven by specific sample components. For example, the effects are similar for both renters and homeowners, indicating that the house price appreciation channel identified by Favara and Imbs (Reference Favara and Imbs2015) may not fully explain bank competition’s impact on entrepreneurial gaps.Footnote 21
3. Heterogeneous Effects Through Discrimination and Financial Dependence
Table 2 shows that minorities and women are less likely to become entrepreneurs compared to their counterparts. Bank deregulation helps reduce this gap, possibly through reducing discrimination in financing markets. To test this channel, I examine whether bank deregulation has different effects in states with varying histories of discrimination.
Following Charles and Guryan (Reference Charles and Guryan2008), Chatterji and Seamans (Reference Chatterji and Seamans2012), and Levine et al. (Reference Levine, Levkov and Rubinstein2014), I use state-level racial discrimination indexes and add a triple interaction term
$ {Dereg}_{s,t}\times {Black}_i\times High\;{Discrimination}_{s,t} $
 to equation (1).Footnote
22 The High Discrimination dummy equals 1 if the state: i) was a slave state before the Civil War; ii) kept anti-miscegenation law until after the 1967 Loving v. Virginia decision; iii) had above-median interracial marriage bias; or iv) lacked fair housing law until the 1968 Fair Housing Act. Supporting Becker’s theory (Becker (Reference Becker1957)), bank competition has stronger effects on reducing financial barriers for Black entrepreneurs in high-discrimination states. Table D1 in the Supplementary Material shows that bank deregulation reduces the racial gap by about 10%, relative to the sample mean, in states with a history of discrimination. This effect is insignificant in low-discrimination states. The results help rule out an alternative explanation that reduced gaps are driven by cultural trends, as inclusive states, more likely to implement deregulation, do not show larger gap reductions.
To analyze gender bias effects, I construct four state-level gender imbalance indexes following Duchin, Simutin, and Sosyura (Reference Duchin, Simutin and Sosyura2021). Using SIPP data from 1990, I measure state-level gaps between men and women in income, earnings, education years, and labor participation. Duchin et al. (Reference Duchin, Simutin and Sosyura2021) show that exposure to gender inequality affects CEOs’ resource allocation to female managers. Similarly, bank deregulation may have stronger effects where banker bias against female entrepreneurs is higher. I test this by adding
$ {Dereg}_{s,t}\times {Gender}_i\times High\;{Bias}_{s,t} $
 to the regressions, where High Bias equals 1 if the imbalance measure exceeds the median. Panel B of Table D1 in the Supplementary Material shows that bank competition effects are stronger in states with higher gender bias, suggesting competition helps female entrepreneurs overcome financing barriers.
Beyond discrimination effects, financial access constraints represent another critical channel through which bank deregulation may affect entrepreneurship opportunities. Following Cetorelli and Strahan (Reference Cetorelli and Strahan2006) and Rajan and Zingales (Reference Rajan and Zingales1998), I also examine how bank deregulation effects vary with industries’ external financing needs. Table C2 in the Supplementary Material shows that female and minority business formation increases more in industries with high external financing dependence.
B. Startup Capital
Bank deregulation can reduce entrepreneurial gaps as it provides entrepreneurs with access to financial services. This access enables the use of varied financing sources: i) business loans and ii) personal loans, including secured home equity loans and unsecured credit card debt. I examine which financing channel supports entrepreneurs by investigating changes in all types of debt after bank deregulation. For instance, if business loans are indeed efficient sources of startup capital, a new business owner will likely support her business by borrowing money from banks and increasing her business debt. If not, it is difficult to argue for the existence of a business loan channel. My data set allows me to observe the behavior pattern of entrepreneurs in terms of variations in all kinds of debt.
To explicitly test the underlying channel, I run the following regression:

where the dependent variable
$ Bank\;{Debt}_{i,s,t+1} $
 is an entrepreneur-level bank debt outcome variable that measures access to business loans and home equity loans in year t + 1 for entrepreneur i in state s. I control the same set of fixed effects as in equation (1). The parameters
$ {\beta}_1 $
 and
$ {\gamma}_1 $
 estimate the racial and gender gaps in initial bank debt employed as startup capital, respectively. Similarly,
$ {\beta}_2 $
 and
$ {\gamma}_2 $
 evaluate whether bank deregulation can mitigate these racial and gender gaps, respectively.
Table 3 presents the impact of bank deregulation on the racial gaps and gender gaps in access to finance. It is observed that minority and female entrepreneurs have less secured business debt compared to White and male entrepreneurs, indicating that this gap is not trivial in column 1. A 1-unit increase in bank deregulation is associated with a reduction of 24.8% in the racial gap in business debt. My results are broadly consistent with Blanchflower et al. (Reference Blanchflower, Levine and Zimmerman2003), who document the existence of racial disparities in the business lending market, and the finding of Chen, Lin, and Sun (Reference Chen, Lin and Sun2021), who argue that bank deregulation can mitigate racial disparities in the small business lending market through intensified competition. In addition, I find that female entrepreneurs also benefit from bank deregulation in financing their businesses through secured business debt.

Table 3 Long description
A table with four columns of dependent variables. Column 1 is Log(Secured Business Debt), Column 2 is 1(Secured Business Debt), Column 3 is Log(Mortgage Debt), and Column 4 is 1(Mortgage Debt).
Key findings by row:
* Minority: Negative coefficients across all columns, ranging from minus 0.027 to minus 1.049.
* Deregulation Index times Minority: Positive coefficients across all columns, including 0.097 in Column 1 and 0.359 in Column 3, indicating deregulation reduces the debt gap.
* Female: Negative coefficients, notably minus 1.781 in Column 1 and minus 0.115 in Column 2.
* Deregulation Index times Female: Positive coefficients of 0.201 in Column 1 and 0.013 in Column 2, while results for mortgage debt in Columns 3 and 4 are not statistically significant.
Fixed effects for State times Year times Income Decile and Sociodemographics are included for all models. The number of observations is 24,139 for all columns. R-squared values range from 0.177 to 0.245.
As for personal debt, I find that only home equity loans matter for entrepreneurship, and bank deregulation has the potential to reduce the financing gap in home equity loans. Notably, minority entrepreneurs exhibit limited reliance on mortgage debt for business financing compared to White entrepreneurs, even after controlling for many sociodemographic fixed effects. One-step bank deregulation narrows the gap in mortgage debt by approximately 34.2%. It is well established that home equity plays an important role in supporting their businesses (Adelino, Schoar, and Severino (Reference Adelino, Schoar and Severino2015), Corradin and Popov (Reference Corradin and Popov2015), and Schmalz, Sraer, and Thesmar (Reference Schmalz, Sraer and Thesmar2017)). Herkenhoff, Phillips, and Cohen-Cole (Reference Herkenhoff, Phillips and Cohen-Cole2021) find that self-employment without employees and employer business ownership is positively associated with higher personal credit limits and credit scores. My findings complement their results by showing that bank deregulation can reduce the racial gap in entrepreneurship because of equal access to the mortgage lending market. Furthermore, I investigate the effect of bank deregulation on other kinds of debt. My article does not find evidence of racial gaps in unsecured consumer credit.Footnote 23 Overall, my results show that bank deregulation has the potential to diminish financing gaps in entrepreneurship. Minority and female entrepreneurs in deregulated states can raise more money to fund their businesses. However, it is important to note that this does not automatically mean an unconstrained increase in their leverage and associated risks since I do not find any significant results in terms of unsecured debt.Footnote 24
C. Bank Deregulation and Firm Quality
Thus far, my results demonstrate a robust association between bank deregulation and female or minority entrepreneurship but say less about the quality of business formation. I next examine the characteristics of businesses established by these individuals. Do they found small, transitory ventures that have a negligible impact on economic development? To further investigate the quality of these new ventures, I decompose the entrepreneurship variable into two mutually exclusive variables: a dummy variable equaling 1 for ventures hiring no less than 25 employees and an indicator variable equaling 1 for ventures hiring fewer than 25 employees. The cutoff of firm size is constrained by data limitations. In column 1 of Table 4, I first document that women and minorities are less likely to own large firms. However, the interaction terms between deregulation and female (minority) suggest that bank deregulation assists women and minorities in founding big firms, indicating that bank deregulation can remove entry barriers without worsening new firm quality.

Table 4 Long description
The table consists of four columns of dependent variables: 1 Big Firm (Employees greater than or equal to 25), 2 Small Firm (Employees less than 25), 3 Profitable Firm, and 4 Unprofitable Firm.
Key findings for independent variables include:
* Deregulation Index times Female: Positive coefficients for Big Firm (0.003), Small Firm (0.001), and Profitable Firm (0.003), all statistically significant. Unprofitable Firm is 0.000.
* Deregulation Index times Minority: Positive coefficients for Big Firm (0.002), Small Firm (0.002), and Profitable Firm (0.004), all statistically significant. Unprofitable Firm is 0.000.
* Female: Negative coefficients across all categories, ranging from -0.014 to -0.029, except Unprofitable Firm (-0.000).
* Minority: Negative coefficients across all categories, ranging from -0.007 to -0.020, except Unprofitable Firm (-0.000).
Fixed Effects (F E) for State times Year times Income decile, Family kids, Family adults, Age, Homeowner, Education, Employment, and Marriage are all marked as Yes for all columns.
Observations: 325,948 for columns 1 and 2; 328,654 for columns 3 and 4.
R-squared values range from 0.031 to 0.044.
The findings in column 1 demonstrate the significant positive impact of bank competition on businesses with employees. In contrast to self-employment, such as individuals running 1-person retail businesses (Levine and Rubinstein (Reference Levine and Rubinstein2017)), businesses with employees play a crucial role in advancing technological innovations and contributing to economic growth through the creation and introduction of novel products, services, and production processes. Column 2 shows that bank deregulation has a weaker effect on small business formation. In columns 3 and 4, I examine the profit amount. In that case, I define two dummy variables: a profitable firm dummy that equals 1 if the firm has positive profit and an unprofitable firm dummy that equals 1 if the firm earns 0 or negative profit. I find that bank deregulation increases profitable firms, but does not change the formation of unprofitable firms. Thus, the main finding from Table 4 indicates that these new ventures started by female and minority entrepreneurs are not trivial.
VI. Effect of Deregulation on Financial Services in Minority Communities
In this section, I pinpoint channels in which bank deregulation reduces entrepreneurial financing gaps. I present evidence to demonstrate that minorities are underserved by banks and that branching deregulation improves the quantity and quality of financial services in minority communities. Subsequently, I construct a discrimination measurement and find that competition reduces discrimination against minority groups.
A. Effect of Deregulation on the Quantity of Banking Services and Financial Inclusion
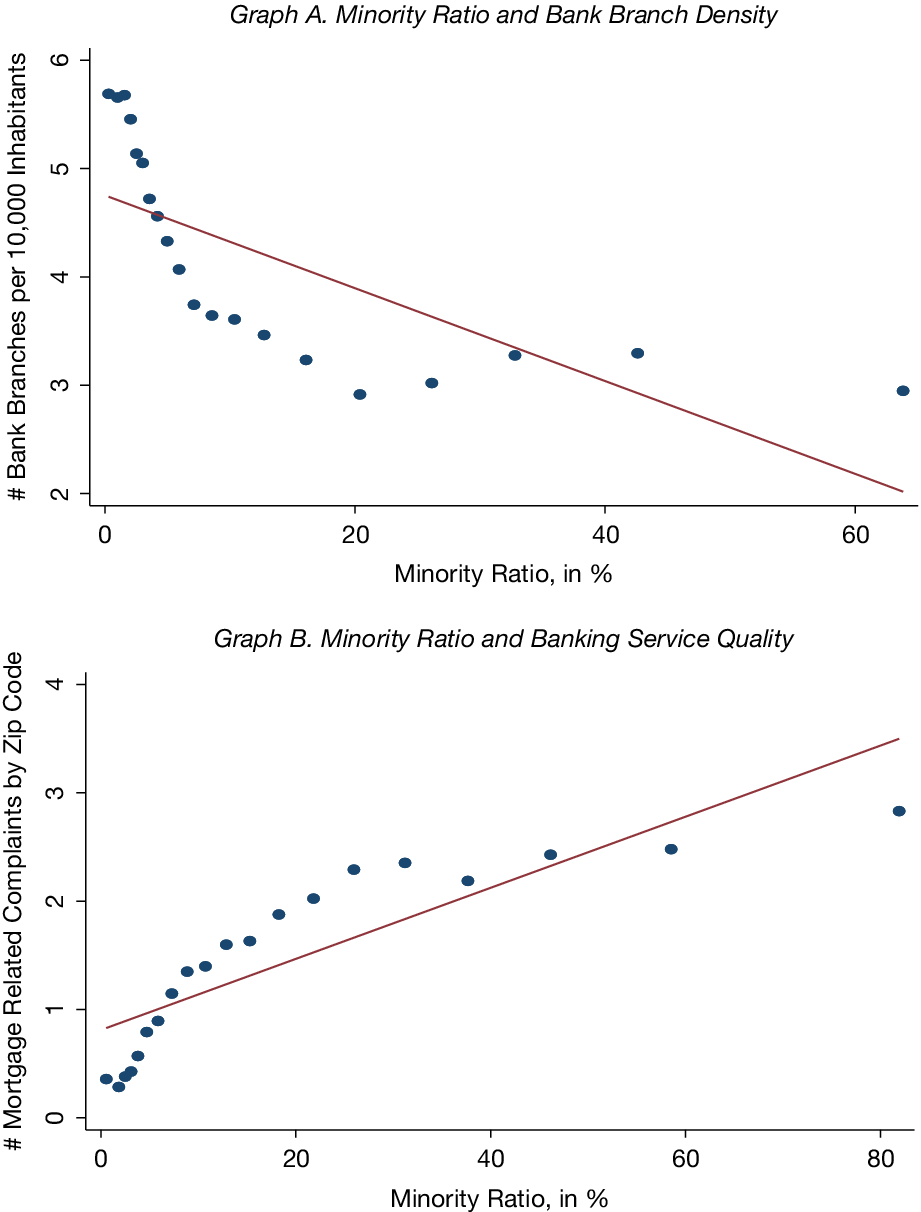
Graph A of Figure 2 shows a negative correlation between bank branch density (branches per 10,000 inhabitants) and minority ratio at the county level. A 1-standard deviation increase in the minority share is associated with an 18% decrease in bank branch density.
Figure 2 shows the relationship between the minority ratio and two pivotal banking service measurements: service quantity (Graph A) and service quality (Graph B). The quantity of banking services is measured by the number of bank branches per 10,000 inhabitants at the county level, while the quality of banking services is measured by the number of mortgage-related complaints filed to the CFPB at the zip code level. The fitted linear regression is presented by the red line. The data are from the Census, CFPB, and FDIC.

Figure 2 Long description
Two vertically stacked scatter plots.
Graph A, titled Minority Ratio and Bank Branch Density, features an x-axis for Minority Ratio, in % ranging from 0 to 60, and a y-axis for number of Bank Branches per 10,000 Inhabitants ranging from 2 to 6. Blue data points show a sharp initial decline in branch density as the minority ratio increases from 0 to 10%, followed by a more gradual decrease. A red linear regression line shows a negative correlation across the entire range.
Graph B, titled Minority Ratio and Banking Service Quality, features an x-axis for Minority Ratio, in % ranging from 0 to 80, and a y-axis for number of Mortgage Related Complaints by Zip Code ranging from 0 to 4. Blue data points show a steady increase in complaints as the minority ratio rises. A red linear regression line shows a positive correlation, indicating that higher minority ratios are associated with a higher volume of complaints filed to the C F P B.
I estimate the following model to examine whether bank deregulation increases the quantity of financial services, measured by bank branch density:

where
$ {BranchDensity}_{c,t+1} $
 is the number of branches divided by the number of residents in county
$ c $
 .Footnote
25
$ {Dereg}_{s,t} $
 is the time-varying deregulation index at the state level.
$ {Minority}_c $
 is the minority share of the population in county
$ c $
 in 1994. I also use a dummy variable
$ Minority\;{Dummy}_c $
 indicating whether a county is in the top quartile of the distribution in terms of minority ratio as an alternative measure. Log population, unemployment rate, log personal income per capita, and the growth rate of personal income per capita are included as control variables
$ {CountyControl}_{c,t} $
 . I include state-year joint fixed effects
$ {\alpha}_{s,t} $
 and county fixed effects
$ {\delta}_c $
 . Furthermore, to address the remaining concerns regarding serial correlation, I cluster the standard errors at the state level.Footnote
26
Panel A of Table 5 shows that bank deregulation reduces racial gaps in the quantity of financial services by improving the quantity of financial services in minority communities. The coefficient of the interaction term Deregulation
$ Index\times Minority $
 Dummy implies that counties in the top quartile of the distribution in terms of minority ratio experienced a 12% (
$ 4\times 3\%=12\% $
 ) increase in the bank branch density if a state is fully deregulated (columns 3 and 4 of Table 5).

Table 5 Long description
Panel A: The Effect of Bank Deregulation on the Racial Gap in Bank Branch Coverage. The dependent variable is Log(branch density per capita).
* Column 1: Deregulation Index times Minority Ratio is 0.121 with a standard error of 0.056.
* Column 2: Deregulation Index times Minority Ratio is 0.115 with a standard error of 0.058.
* Column 3: Deregulation Index times Minority Dummy is 0.030 with a standard error of 0.011.
* Column 4: Deregulation Index times Minority Dummy is 0.029 with a standard error of 0.011.
All columns include State times Year F E and County F E. Observations range from 76,369 to 77,652 with R-squared values around 0.945.
Panel B: The Effect of Bank Deregulation on the Racial Gap in Holding Bank Accounts. The dependent variable is Holds a bank account.
* Minority coefficient: Ranges from -0.055 to -0.133 across columns 1 through 4.
* Deregulation Index times Minority: Column 2 is 0.019 (0.005), Column 3 is 0.012 (0.004), and Column 4 is 0.011 (0.004).
Controls vary by column, including State times Year F E, Sociodemographics, and Income decile F E. Observations range from 289,454 to 356,517 with R-squared values between 0.025 and 0.107.
To rule out demand-driven explanations, I compare local banks with interstate banks. While interstate banks can expand across state borders after deregulation, local banks’ lending activities remain unaffected. If credit demand increases due to economic growth, both bank types should expand lending regardless of location.
Table B9 in the Supplementary Material shows that interstate banks expand after deregulation (Panel A, columns 1 and 2), while local banks show no expansion (columns 3 and 4). This implies that deregulation primarily impacts interstate banks by lowering entry costs, while local banks remain unaffected, thus ruling out demand-driven explanations. In Panel B, I exclude large interstate banks (JP Morgan, Wells Fargo, and Bank of America) to make the comparison more equitable, as these banks may be more efficient at addressing increased demand. Even with this adjustment, the distinct responses between interstate and local banks persist, further supporting that deregulation triggered a credit supply shock rather than reflecting demand changes.
I also examine the relationship between deregulation levels and bank density. Using dummy variables for each deregulation level in equation (3), Table C1 in the Supplementary Material shows bank branch density increases monotonically with deregulation levels. This monotonic positive relationship indicates that using a linear specification appears to be a reasonable approximation to capture the overall trend and direction of the relationship. To examine dynamic effects, I create dummies for different periods around deregulation. Column 2 shows that bank branch density increases by 3.4% within 3 years after deregulation.
The observed effects might be influenced by the Community Reinvestment Act (CRA), which requires banks to serve underserved communities. However, several tests confirm that the CRA does not drive the deregulation effects. First, analysis of branch-specific deregulation provisions that affect only branch distribution but not mergers and acquisitions still shows narrowing racial and gender gaps (column 3 of Table E1 in the Supplementary Material). Second, tests following Célerier and Matray (Reference Célerier and Matray2019) demonstrate that banks do not significantly alter their practices to comply with CRA ratings after deregulation (Table C5 in the Supplementary Material). Detailed analysis is provided in Appendix C in the Supplementary Material.
I investigate whether the impact of bank deregulation on bank branch density in minority communities leads to a reduction in the racial gap concerning access to bank accounts using the SIPP data set. My empirical specification is as follows:

where
$ Bank\;{Account}_{i,s,t+1} $
 is a dummy variable set to 1 if a resident
$ i $
 in state
$ s $
 opens a bank checking or savings account in the next year. The definitions of the remaining variables and the overall model specification follow those in equation (1). Panel B of Table 5 presents the results.
The coefficient estimates in column 4 of Table 5 show that full deregulation can reduce the racial gap by 80% (
$ \beta \times 4 $
 $ \div $
 $ \gamma $
 = 0.011
$ \times $
 4
$ \div $
 0.055 = 80%). This finding indicates that unbanked minorities face obstacles in accessing financial services, and bank deregulation can help remove these barriers to promote financial inclusion.
B. Effect of Deregulation on the Quality of Banking Services
Beyond examining the quantity of banking services, I investigate how deregulation affects service quality for minorities, measured by consumer complaints filed to the CFPB regarding issues such as fraud, poor customer service, and misselling (Begley and Purnanandam (Reference Begley and Purnanandam2021)). I focus on mortgage-related complaints due to the significance of home equity loans as sources of startup capital. Graph B of Figure 2 shows that areas with high minority populations experience more mortgage-related complaints. These complaints are meaningful indicators as they lead to CFPB-imposed fines on banks (Begley and Purnanandam (Reference Begley and Purnanandam2021)).
To analyze how deregulation affects service quality in minority communities, I estimate the following:

where
$ Log{(complaints)}_{z,t+1} $
 is the logarithm of total CFPB complaints in zip code
$ z $
 in year
$ t+1 $
 .
$ {Dereg}_{s,t} $
 represents the state-level deregulation index, and
$ {Minority}_z $
 is the minority population share in zip code
$ z $
 at the beginning of the sample period (2012–2021), using 2010 Census data. The specification includes zip code fixed effects
$ {\gamma}_z $
 , state-year fixed effects
$ {\alpha}_{s,t} $
 , and MSA-year fixed effects
$ {\phi}_{m,t} $
 to control for local economic and demographic conditions. This model exploits variation within MSAs that span multiple states with different deregulation levels.
Panel A of Table 6 presents the results. Columns 1–3 use the continuous minority ratio interaction, while columns 4–6 interact deregulation with a dummy for top-quartile minority population share. The results remain robust across different fixed effects specifications. Column 6 indicates that a 1-unit increase in deregulation reduces complaints by 5.4% in high-minority areas compared to less deregulated areas in the same MSA. According to Fairlie et al. (Reference Fairlie, Robb and Robinson2022), minority entrepreneurs often face discouragement as borrowers. Improved banking service quality may increase their loan application confidence, potentially helping reduce entrepreneurial gaps.

Table 6 Long description
Panel A: The Effect of Bank Deregulation on the Racial Gap in the Quality of Banking Services.
Dependent Variable is Log complaints.
Columns 1 through 3 use the interaction term Deregulation times Minority Ratio. Coefficients are -0.155, -0.167, and -0.147, all statistically significant.
Columns 4 through 6 use the interaction term Deregulation times Minority Dummy. Coefficients are -0.055, -0.058, and -0.054, all statistically significant.
Fixed effects include Zip code F E across all columns, with varying inclusions of Year F E, State times Year F E, and M S A times Year F E.
Observations range from 130,824 to 184,068 with R-squared values between 0.690 and 0.705.
Panel B: The Effect of Bank Deregulation on Complaints About Discriminatory Treatment.
Dependent Variables are Log discrimination complaints for columns 1 through 4 and 1 discrimination complaints for columns 5 through 8.
Interaction term Deregulation times Minority Ratio in columns 1 through 3 shows coefficients of -0.044, -0.057, and -0.083. In columns 5 through 7, coefficients are -0.060, -0.073, and -0.105.
Interaction term Deregulation times Minority Dummy in column 4 is -0.028 and in column 8 is -0.040.
Fixed effects follow a similar structure to Panel A.
Observations range from 87,216 to 122,712 with R-squared values between 0.247 and 0.264.
I conduct various tests to verify these findings. First, I examine different types of complaints beyond mortgages, including checking accounts and credit cards. Second, I use alternative measures such as complaints scaled by the total number of mortgage loans in a given zip code (which can be viewed as the complaint rate per mortgage loan in a given zip code) and find similar results (see Table C3 in the Supplementary Material). By dividing the number of complaints by the total number of mortgage loans, I can mitigate potential impacts arising from varying mortgage application volumes across different regions. Third, I employ a quasi-random identification strategy using incidental bank mergers. I focus on mergers that unintentionally lead to increased market concentration in overlapping markets, which are not central to either party involved in the merger. These tests confirm the robustness of the main results. Detailed analyses are presented in the Supplementary Material.
In general, my results indicate that competition enhances the quality of banking services received by residents in minority communities and reduces racial gaps in the quality of financial services.
C. Effect of Deregulation on Discrimination Against Minorities
Bank deregulation can reduce discrimination through increased competition (Becker (Reference Becker1957)). In competitive markets, discriminating banks lose market share as borrowers can switch to non-discriminating competitors. However, detecting discrimination through traditional measures like racial gaps in interest rates is challenging due to omitted variable concerns. To address this limitation, I construct a direct measure of discriminatory treatment using textual analysis of complaint narratives from the CFPB data set.Footnote 27 Using this measure, I find that interstate banking deregulation reduces discrimination-related complaints, with stronger effects in areas having higher minority populations.
Table D2 in the Supplementary Material presents an example of a consumer complaint about a mortgage application from the CFPB database. The complaint narrative contains explicit discrimination claims (e.g., “I believe that I am being discriminated against because I disclosed my race as XXXX”).Footnote 28 The company’s response of “closed with monetary relief” without dispute suggests potential discriminatory treatment, enabling the identification of potential discrimination cases in my analysis.
I measure borrowers’ perceptions of discrimination through textual analysis of complaint narratives.Footnote 29 Complaints containing words such as “discrimination,” “unfair,” “partial,” “inequity,” “prejudice,” “injustice,” or their derivatives are classified as discrimination-related.Footnote 30 Figure D1 in the Supplementary Material presents the geographical distribution of discrimination complaints by county.
I modify equation (5) by replacing Log(complaints) with either Log(discrimination complaints) or 1(discrimination complaints). Log(discrimination complaints) measures the logarithm of total discrimination-related complaints filed to the CFPB in a zip code, while 1(discrimination complaints) indicates the presence of such complaints. Table D3 in the Supplementary Material validates this measure by showing banks with more discrimination complaints exhibit higher minority loan rejection rates.
Panel B of Table 6 presents the impact of bank competition on discrimination. The dependent variable in columns 1–4 is Log(discrimination complaints), which represents the logarithm of the total number of discriminatory complaints. I find that a 1-unit increase in the bank deregulation index leads to a 2.8% reduction in discriminatory treatment (column 4) in minority communities, compared to less deregulated minority communities in the same MSA. As for the extensive margin, the probability of discrimination complaints decreases by 4.0% in areas with high proportions of minority borrowers as a result of 1-step deregulation (column 8). This effect is substantial considering that the mean value of the dependent variable 1(discrimination complaints) is only 5.3%. These results remain robust when using the total number of discrimination complaints scaled by the total number of mortgage loans as an alternative dependent variable (see Table C3 in the Supplementary Material). To address concerns about frivolous complaints,Footnote 31 I exclude complaints disputed by lenders and complaints closed without monetary relief, respectively, and find that my results remain intact (see Table C4 in the Supplementary Material).
Two potential explanations exist for discriminatory lending: racial bias and statistical discrimination. Racial bias combines taste-based discrimination and miscalibrated beliefs. Taste-based discrimination (Becker (Reference Becker1957)) occurs when banks derive dissatisfaction from approving applications from minority borrowers or satisfaction from approving White borrowers. Miscalibrated beliefs (Bordalo, Coffman, Gennaioli, and Shleifer (Reference Bordalo, Coffman, Gennaioli and Shleifer2016), Arnold, Dobbie, and Yang (Reference Arnold, Dobbie and Yang2018)) imply that banks maintain incorrect stereotypes about minority borrowers. Given the implicit nature of these biases and their potential interaction, I view their impacts as 1 channel, as suggested by Egan, Matvos, and Seru (Reference Egan, Matvos and Seru2022) and Ewens and Townsend (Reference Ewens and Townsend2020). Statistical discrimination (Arrow (Reference Arrow1974), Ewens, Tomlin, and Wang (Reference Ewens, Tomlin and Wang2014), and Phelps (Reference Phelps1972)) occurs when banks treat minority borrowers differently based on perceived higher inherent risks. Consequently, banks may rationally reject a greater number of minority borrowers to maximize their profits from a business perspective.
I conduct two tests to determine which type of discrimination my measure captures. The evidence supports racial bias over statistical discrimination. First, I analyze the financial characteristics of borrowers across banks. As shown in Table D4 in the Supplementary Material, banks with more discrimination complaints do not face higher financial risks from minority borrowers, who display lower loan amount-to-income ratios (Panel A) and comparable income levels to White borrowers (Panel B). Moreover, Table D5 in the Supplementary Material reveals that marginal minority borrowers in discriminatory banks are more creditworthy than their White counterparts, suggesting that discriminatory banks apply higher approval standards to minorities by requiring lower loan amount-to-value ratios.Footnote 32 The CFPB complaint narratives also provide direct evidence of prejudiced behavior. For instance, a complaint presented in Table D2 in the Supplementary Material states, “The loan officer sounded very condescending when she told me that I was denied,” which directly illustrates the racial bias endured by minority borrowers.
Second, I rule out statistical discrimination using the Paycheck Protection Program (PPP) loan setting. The PPP loans, designed to assist small businesses during the COVID period, come with a full guarantee from the government, thereby eliminating the default risks that banks typically encounter. Despite these loans carrying no default risk, Table D6 in the Supplementary Material documents persistent racial gaps and shows that competition increases minorities’ access to PPP loans.
My results align with Becker’s argument that increased competition may contribute to reduced discrimination. The reduction of discrimination in financial markets can benefit minority entrepreneurs and contribute to diminishing racial gaps in access to finance.
VII. Bank Deregulation and Entrepreneurial Firm Performance Gaps
A. Startup Firms’ Subsequent Performances
While Section V examines bank deregulation’s effect on firm creation, here I analyze its impact on firm performance. Prior research shows that Black-owned and women-owned businesses underperform relative to White-owned and men-owned firms (Fairlie and Robb (Reference Fairlie and Robb2007), (Reference Fairlie and Robb2009)). I test whether financial market deregulation affects these performance gaps. Using equation (1), I replace the entrepreneurship transition indicator with firm performance measures, focusing on existing entrepreneurs in my sample.
I use three variables to measure firm performance: i) Size, a dummy variable equal to 1 if the firm has 25 or more employees; ii) Survive, a dummy variable equal to 1 if the firm is still operating; and iii) Profit Amount, the amount of firm profit.
Furthermore, I link bank deregulation with economic fluctuation to check the effect of bank deregulation across business cycles by interacting the bank deregulation index with a financial crisis dummy equaling 1 for the 2008 financial crisis, and 0 otherwise. Iyer, Peydró, da Rocha-Lopes, and Schoar (Reference Iyer, Peydró, da Rocha-Lopes and Schoar2014) emphasize the importance of access to finance for small firms during the financial crisis. Duygan-Bump, Levkov, and Montoriol-Garriga (Reference Duygan-Bump, Levkov and Montoriol-Garriga2015) show that small firms were more likely to cut employment when financially constrained in 2008. Chodorow-Reich (Reference Chodorow-Reich2014) find that losing access to finance leads to a decrease of between one-third and one-half in employment at small and medium firms due to financial frictions deriving from asymmetric information. Motivated by these empirical findings, my prediction is that bank deregulation can aid minorities and women, particularly during financial crises, by reducing financial frictions.
Table 7 confirms gender and racial gaps in firm performance, consistent with prior studies. These gaps widen during financial crises as female and minority firms show greater vulnerability. Bank deregulation helps narrow the gaps in firm size. While deregulation has a limited impact on firm survival during normal times, it proves crucial during crises. In crisis periods with tight credit and high interest rates, female and minority entrepreneurs in fully deregulated states show higher survival rates.Footnote 33

Table 7 Long description
A statistical table with 6 columns of results. The dependent variables are Size (columns 1 and 2), Survive (columns 3 and 4), and Profit Amount (columns 5 and 6).
Key interaction terms and coefficients:
* Dereg times Minority times Crisis: Column 2 (0.000), Column 4 (0.006*), Column 6 (617.562**).
* Dereg times Female times Crisis: Column 2 (0.007*), Column 4 (0.013***), Column 6 (401.154*).
* Dereg times Female: Column 1 (0.066***), Column 2 (0.065***), Column 3 (0.001), Column 4 (0.000), Column 5 (-297.047), Column 6 (-319.419).
* Dereg times Minority: Column 1 (0.020**), Column 2 (0.020*), Column 3 (-0.001), Column 4 (-0.001), Column 5 (-265.652), Column 6 (-306.127).
* Female: Column 1 (-0.240***), Column 3 (-0.033***), Column 5 (-108.773).
* Minority: Column 1 (-0.049*), Column 3 (-0.026***), Column 5 (-395.294).
All models include Controls, State times Year times Income decile fixed effects, and Sociodemographics.
* Observations: Size (65,493), Survive (76,301), Profit Amount (75,299).
* R super 2: Size (0.253), Survive (0.155), Profit Amount (0.270).
Standard errors are provided in parentheses below each coefficient.
My results highlight bank deregulation’s role in reducing performance gaps across business cycles. During economic prosperity, deregulation modestly reduces gender and racial gaps in firm performance. More importantly, it prevents these gaps from widening during economic crises.
B. Bank Deregulation and Business Equity Accumulation Gaps
Bank deregulation reduces entrepreneurial gaps without compromising business quality. A key question is: How does this affect wealth inequality? Economic theory suggests financial frictions widen wealth disparities by limiting entrepreneurial opportunities for the poor (Banerjee and Newman (Reference Banerjee and Newman1993)). Similarly, financially constrained minorities and women face barriers to entrepreneurship, potentially widening wealth gaps. Therefore, in this section, I investigate the impact of reduced entrepreneurial gaps on wealth inequality between advantaged and disadvantaged groups.
My data reveal significant wealth disparities. Men’s average net worth ($1,83,115) exceeds women’s ($1,14,503). The racial gap is even larger—minorities’ average net worth ($82,029) is less than half of Whites’ ($1,89,324). Business equity gaps account for 49% of the gender wealth gap and 26% of the racial wealth gap. This suggests that closing business equity gaps could substantially reduce wealth inequality.
To identify the entrepreneurship channel, I examine business equity rather than total net worth.Footnote 34 Table 8 explores the impact of bank deregulation on the business equity gaps between advantaged entrepreneurs and disadvantaged entrepreneurs. Advantaged entrepreneurs have double the business equity of disadvantaged entrepreneurs. One step of bank deregulation reduces the gender gap by 6% and the racial gap by 11%.Footnote 35 This translates to a 3% decrease in wealth inequality.Footnote 36 These estimates likely represent a lower bound as they only consider existing entrepreneurs. My findings suggest bank deregulation reduces wealth inequality through equal financial access and entrepreneurial opportunities, contributing to the literature on banking competition and inequality (Beck et al. (Reference Beck, Levine and Levkov2010)).

Table 8 Long description
The table presents results for the dependent variable Log open parenthesis business equity plus 1 close parenthesis. It contains three numbered columns representing different model specifications.
* Deregulation Index times Minority Entrepreneur: Column 2 is 0.117 with standard error 0.050; Column 3 is 0.112 with standard error 0.049.
* Deregulation Index times Female Entrepreneur: Column 2 is 0.093 with standard error 0.055; Column 3 is 0.094 with standard error 0.055.
* Female Entrepreneur: Column 1 is minus 1.427 with standard error 0.094; Column 2 is minus 1.631 with standard error 0.147; Column 3 is minus 1.644 with standard error 0.147.
* Minority Entrepreneur: Column 1 is minus 0.782 with standard error 0.079; Column 2 is minus 1.032 with standard error 0.141; Column 3 is minus 1.032 with standard error 0.134.
* Entrepreneur: Column 1 is 7.453 with standard error 0.082; Column 2 is 7.342 with standard error 0.150; Column 3 is 7.303 with standard error 0.147.
Fixed effects and controls:
* Controls: Yes for all columns.
* State times Year times Income decile F E: Yes for all columns.
* Sociodemographics: No for columns 1 and 2; Yes for column 3.
Summary statistics:
* Observations: 638,937 for all columns.
* R-squared: Column 1 is 0.402; Column 2 is 0.402; Column 3 is 0.411.
VIII. Conclusion
In my article, I investigate whether access to finance reduces gender and racial gaps in entrepreneurship.
To achieve this goal, I take advantage of two pivotal acts determining the progress of interstate bank deregulation in the United States as exogenous shocks on the supply of credit. I document that following bank deregulation, women and minorities are more likely to be entrepreneurs, leading to a narrowing of the gender and racial gaps in entrepreneurship. Consistent with the hypothesis that bank deregulation can remove the barrier to entry for financially constrained individuals, I find that this effect is more pronounced in industries that heavily rely on external financing and in economies with a history of bias or discrimination against women or minorities. Turning to the mechanisms behind my main results, I argue that the direct channel is that bank deregulation reduces the gaps in accessing initial capital for supporting businesses. Furthermore, I evaluate the quality of these new ventures and find no evidence that bank deregulation worsens the quality of new businesses.
Additionally, I develop a novel discrimination measure, finding that deregulation can reduce complaints about discrimination against banks. This measure could aid CFPB monitoring by quantifying the discriminatory treatment of banks. The method employed in my research can also be applied to other contexts since unstructured textual data are prevalent in various domains. Moreover, my research contributes to evaluating the effect of the antitrust intervention on financial market structure and promoting equitable growth by highlighting the need for policymakers to consider underserved borrowers when making decisions regarding antitrust interventions.
Overall, my results suggest that equal access to finance fosters equitable economic growth.
Supplementary Material
To view supplementary material for this article, please visit http://doi.org/10.1017/S0022109025102172.