Peroxisome Proliferator Activated Receptor gamma (PPARG) is a ligand-activated nuclear hormone receptor (NHR) that modulates a variety of cellular processes including development and homeostasis (Chinetti et al. Reference Chinetti, Fruchart and Staels2000). PPARG is principally expressed in macrophages, mammary gland, colon, prostate and adipose tissues and plays pivotal roles in regulating adipogenesis and macrophage function (Chinetti et al. Reference Chinetti, Fruchart and Staels2000). Upon ligand binding, PPARG forms a hetero-dimer with the Retinoid X Receptor (RXR) (Moraes et al. Reference Moraes, Piqueras and Bishop-Bailey2006). The activated complex binds to Peroxisome Proliferator Responsive Elements (PPRE) in the promoter regions of target genes resulting in activation or suppression of their transcription (Moraes et al. Reference Moraes, Piqueras and Bishop-Bailey2006). Peroxisome Proliferator Activated Receptor Delta (PPARD) is a closely related isoform. Its functions in vivo have remained elusive but several reports suggest that activators of PPARD, including fatty acids and a linoleic acid metabolite, also activate reporter gene constructs containing PPREs (Peters et al. Reference Peters, Lee, Li, Ward, Gavrilova, Everett, Reitman, Hudson and Gonzalez2000). Generally, the activating ligands of PPARD are distinct from those activating PPARG although recent studies have shown that the thiazolidines and other known PPARG ligands can augment PPARD signalling in a PPARG-independent manner (Hall & McDonnell, Reference Hall and McDonnell2007).
The endogenous ligands regulating PPARG activity in vivo are not well characterized but some that have been identified include cyclopentenone prostaglandins of the J-series, which can be found in bone marrow, thymus and secondary lymphatic tissues (Nencioni et al. Reference Nencioni, Wesselborg and Brossart2003). These natural prostaglandins activate PPARG-dependent pathways, exhibit intrinsic pro-apoptotic potential and inhibit NFκB-signalling, thus putatively linking this transcription factor to the regulation of innate immune responses (Scher & Pillinger, Reference Scher and Pillinger2005). Indeed, both natural and synthetic PPARG ligands exert anti-inflammatory effects in macrophages and monocytes (Jiang et al. Reference Jiang, Ting and Seed1998; Ricote et al. Reference Ricote, Li, Willson, Kelly and Glass1998). For example, it has been shown that 15d-PGJ2 and the thiazolidinedione (TZD) class of insulin-sensitizing drugs inhibit expression of pro-inflammatory cytokines and chemokines in macrophages and intestinal epithelial cells (Ruiz et al. Reference Ruiz, Kim, Sartor and Haller2004; Scher & Pillinger, Reference Scher and Pillinger2005). Somewhat paradoxically, other studies have reported that 15d-PGJ2 potentiates inflammatory reactions by increasing the expression of Interleukin-8 (IL-8) in macrophages and endothelial cells (Jozkowicz et al. Reference Jozkowicz, Dulak, Prager, Nanobashvili, Nigisch, Winter, Weigel and Huk2001; Fu et al. Reference Fu, Luo and Lopes-Virella2002). These apparently contradictory observations suggest that the expression patterns of some cytokines and chemokines upon 15d-PGJ2 treatment are time and concentration-dependent and vary depending on cell type.
We previously demonstrated that bovine mammary epithelial cells (bMEC) have a robust innate immune defence capacity (Strandberg et al. Reference Strandberg, Gray, Vuocolo, Donaldson, Broadway and Tellam2005). To further investigate this capability, we tested the hypothesis that treatment of bMEC with a panel of PPARG agonists would result in modification of the transcription of pro-inflammatory innate immune genes, including Interleukin 1β (IL-1β), Interleukin 6 (IL-6), Interleukin 8 (IL-8), Tumour Necrosis Factor alpha (TNFα), Chemokine (CC Motif) Ligand 2 (CCL2) and Chemokine (CXC Motif) Ligand 6 (CXCL6), expressed by these cells. The agonists chosen for this study included the most potent natural PPARG ligand, 15d-PGJ2 (Jiang et al. Reference Jiang, Ting and Seed1998) and the synthetic ligands, troglitazone, rosiglitazone, ciglitazone and MCC-555 (Reginato et al. Reference Reginato, Bailey, Krakow, Minami, Ishii, Tanaka and Lazar1998).
Effects of 15d-PGJ2 on cytoskeletal reorganization and the expression of genes involved in oxidative stress responses in bMEC, including Ferritin heavy chain (FTH) and Superoxide dismutase (SOD-1), were also investigated. SOD-1 encodes a potent anti-oxidant enzyme that has been shown to protect lung epithelial cells against injury (Ilizarov et al. Reference Ilizarov, Koo, Kazzaz, Mantell, Li, Bhapat, Pollack, Horowitz and Davis2001). FTH functions as an anti-oxidant by sequestering inorganic iron and preventing accumulation of cellular Fe2+, the ultimate catalyst of oxidative damage in cells (Balla et al. Reference Balla, Jacob, Balla, Rosenberg, Nath, Apple, Eaton and Vercellotti1992).
Materials and Methods
Cell culture
Primary bMEC, kindly donated by Dr Sheehy (Sydney University, NSW, Australia), were isolated from a mammary tissue biopsy of a Holstein Friesian at peak lactation. bMEC were established on collagen type 1 (calf skin) (Sigma Chemical Co., St. Louis MO, USA) in a composite Medium 199/Hams F12 medium (Invitrogen, Carlsbad CA, USA) supplemented with 45 mm-sodium bicarbonate, 4 mm-sodium acetate, 18 mm-Hepes, 20% horse serum, 5% fetal calf serum (FCS), 100 units/ml penicillin, 100 μg/ml streptomycin, 100 μg/ml kanamycin (Invitrogen), 500 μg/ml insulin, 1 μg/ml cortisol and 10 ng/ml EGF (mouse) (Sigma Chemical Co.). The cells were cultured at 37°C in a humidified atmosphere of 5% CO2. The characterization of these cells has been described elsewhere (Strandberg et al. Reference Strandberg, Gray, Vuocolo, Donaldson, Broadway and Tellam2005).
Incubation of bMEC with PPARG ligands
bMEC were cultured in six-well plates (Sarstedt, Nümbrecht, Germany) until 80% confluence. The cells were then washed once in phosphate-buffered saline (PBS) before subsequent addition of fresh media with or without PPARG agonists at final concentrations of 10 μm for 15d-PGJ2, MC-555, ciglitazone, rosiglitazone and troglitazone. After incubation of the cells for 48 h, they were washed with PBS and harvested using a cell scraper for subsequent RNA extractions. Preliminary cell culture experiments and analysis of gene expression by quantitative real-time RT-PCR confirmed that 1% DMSO or 1% methyl acetate, the two solvents used for the stock solutions of the agonists, did not significantly alter the expression levels of RPLP0, IL-1β or IL-8 compared with cells treated with only PBS. The final concentrations of DMSO or methyl acetate used in the experiments were significantly lower. Consequently, controls consisted of cells incubated with PBS only. Two biological replicates, derived from the same primary bMEC culture, were included for each treatment. The mRNA expression patterns of selected genes were examined after treatment of bMEC with a range of PPARG agonists for 48 h. The cells were stimulated with 10 μm of the natural agonist 15d-PGJ2 since this concentration has been shown to be optimal for 15d-PGJ2 to exert both its reported pro- or anti-inflammatory effects in a variety of different cell lines including lymphocytes and endothelial cells (Jozkowicz et al. Reference Jozkowicz, Dulak, Prager, Nanobashvili, Nigisch, Winter, Weigel and Huk2001; Alvarez-Maqueda et al. Reference Alvarez-Maqueda, El Bekay, Alba, Monteseirin, Chacon, Vega, Martin-Nieto, Bedoya, Pintado and Sobrino2004). A concentration of 10 μm was also used for the synthetic PPARG agonists because this dose was reported to induce PPARG activation in human cultured airway smooth muscle cells and rat synovial fibroblasts. Higher doses of troglitazone (50 and 100 μm) have cytotoxic effects on B cells (Simonin et al. Reference Simonin, Bordji, Boyault, Bianchi, Gouze, Becuwe, Dauca, Netter and Terlain2002). bMEC were treated with the panel of PPARG ligands for a period of 48 h, an incubation period shown to be optimal for stimulation of PPARG in human THP-1 macrophages (Fu et al. Reference Fu, Luo and Lopes-Virella2002).
In a similar manner, bMEC were cultured in 175-cm2 flasks (Sarstedt, Nümbrecht, Germany) until 80% confluent and washed before the addition of fresh media with three different doses of 15d-PGJ2 (0·5, 2 and 10 μm) for a period of 48 h. Control cells received the equivalent volume of PBS. After incubation of the cells for 48 h, they were washed with PBS and harvested using a cell scraper for subsequent RNA extraction. Two biological replicates, derived from the same primary mammary epithelial cell culture, were used. The cytoskeletal organization of these cells was also examined (see below).
Isolation of RNA from bMEC and first strand cDNA synthesis
Total RNA was extracted from bMEC using an RNeasy Mini Kit (Qiagen, Basel, Switzerland). The total RNA prepared from each sample was treated with Dnase I on column (Qiagen Dnase I) and after elution (Ambion Dnase I) to minimize the presence of genomic DNA. RNA was quantified by spectrophotometric measurements at 260 nm and 280 nm and its purity and integrity were verified by the OD260/OD280 ratio (>1·8) and by visualization on a denaturing gel. cDNA synthesis was undertaken by incubating 5 μg of isolated total RNA with 2·5 μl dNTPs and 2·5 μl of an anchored oligo-T18 primer in a total volume of 32·5 μl at 65°C for 5 min. MMLV Superscript III reverse transcriptase (Invitrogen) (500 units in 2·5 μl), 2·5 μl 0·1m-DTT, 10 μl 5× buffer (Invitrogen) and 2·5 μl RNaseOUT (Invitrogen) were subsequently added to the RNA samples in a total volume of 50 μl. The reverse transcription reaction was carried out at 50°C for 60 min followed by 70°C for 15 min and then 4°C for 5 min. The resulting cDNA was diluted 1/10 and 0·5 μl of this dilution (derived from 5 ng of total RNA) was used in 5-μl qRT-PCR reactions.
Oligonucleotide primer design
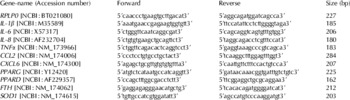
Primer pairs for all genes were designed using publicly available bovine sequences (Table 1). Database searches, alignments and sequence analyses were performed with the aid of the NCBI (http://www.ncbi.nlm.nih.gov/) and IBISS (Hawken et al. Reference Hawken, Barris, McWilliam and Dalrymple2004) (http://www.livestockgenomics.csiro.au/ibiss/) systems. Bovine genes that were not annotated were identified by BLAST searches (Altschul et al. Reference Altschul, Gish, Miller, Myers and Lipman1990) of bovine ESTs using orthologous mouse and human sequences. Primer design and optimization were carried out using Primer 3 (http://primer3.sourceforge.net). The genes investigated included: Interleukin 1β (IL-1β), Interleukin 6 (IL-6), Interleukin 8 (IL-8), Tumour Necrosis Factor alpha (TNFα), Chemokine (CC Motif) Ligand 2 (CCL2), Chemokine (CXC Motif) Ligand 6 (CXCL6), Peroxisome Proliferator Activated Receptor gamma (PPARG) and Peroxisome Proliferator Activated Receptor delta (PPARD). The reference gene was Acidic Ribosomal Protein Large P0 (RPLP0). Roux et al. (Reference Roux, Leveziel and Amarger2006) have recently described the existence of a bovine chimeric transcript resulting from cotranscription and intergenic splicing of PPARG and the neighbouring TSEN2 gene. These studies showed that PPARG was significantly more abundant than the chimeric transcript in adipose, liver, diaphragm and skeletal muscle tissue and thus the PPARG qRT-PCR assay used in this study is likely to measure principally PPARG. 15d-PGJ2 has been shown to generate reactive oxygen species in the breast cancer cell line MCF-7 (Pignatelli et al. Reference Pignatelli, Sanchez-Rodriguez, Santos and Perez-Castillo2005). Therefore, to study the effects of 15d-PGJ2 on genes involved in oxidative stress responses, we used qRT-PCR to measure the dose-response expression of Ferritin heavy chain (FTH) and Superoxide dismutase (SOD-1) mRNAs as markers for this response.
Oligonucleotide primer sequences used for real-time qRT-PCR analyses

Quantitative Real-time Reverse Transcription PCR (qRT-PCR)
For all qRT-PCR measurements, the abundance of each transcript was measured relative to RPLP0, which was shown to remain relatively constant across all treatments. The quantity of a transcript in one biological sample or state relative to that in a calibrating sample was expressed as the fold-change in gene expression (Strandberg et al. Reference Strandberg, Gray, Vuocolo, Donaldson, Broadway and Tellam2005). qRT-PCR measurements were performed using the SYBR Green system in an ABI Prism 7900 Sequence Detection System (Applied Biosystems, Foster City CA, USA). The relative quantities of the transcripts in the bMEC were measured in the absence and presence of the different treatments. A constant amount of cDNA (synthesized from 5 ng of total RNA, as described above) was used for each qRT-PCR measurement, and negative controls, in the absence of Reverse Transcriptase, were included in all assays. qRT-PCR reactions were carried out in total volumes of 5 μl containing 0·5 μl of a 1/10 dilution of first strand cDNA, 2·25 pmol of each primer (2×0·25 μl at 9 μm) and 2·5 μl of 2× SYBR Green Mastermix (Applied Biosystems). The cycling conditions consisted of 50°C for 2 min followed by denaturation for 10 min at 95°C, and 40 cycles of amplification with 15 s at 95°C and 1 min at 60°C. A melt curve analysis was undertaken by heating the samples to 95°C for 15 s, 60°C for 15 s and 95°C for 15 s to confirm the presence of a single amplicon in each reaction. All amplicons were validated by sequencing. Dilution curves were run for all primer sets to verify the linearities of the assays. Two biological replicates and three technical replicates, derived from the same primary bovine mammary epithelial cell culture, were performed for each gene. This allowed quantification of the target gene in the treated sample relative to that in the untreated control (the calibrator) using the ‘2−ΔΔCt method’ (Livak & Schmittgen, Reference Livak and Schmittgen2001). This method provides a convenient way of analysing the relative changes in gene expression from qRT-PCR studies provided the efficiencies of amplification are similar for all genes. In the current study, the efficiencies of PCR amplifications varied between 1·95 and 2·0. SDS 2.2.1 analysis software (Applied Biosystems) and Microsoft Excel (Microsoft) were used to analyse all qRT-PCR results. Unstimulated bMEC was used as the calibrator for bMEC treated with the PPARG agonists.
Statistical analysis
Results are presented as the mean fold-change±1sd. Significance was ascertained using the Student's 2-tailed paired t test. Differences were considered statistically significant at P<0·05. Linear regression analyses were undertaken using Microsoft Excel to determine the significance of the dose-response curves for IL-8, CXCL6, FTH and SOD-1.
Fluorescein-phalloidin staining of bMEC after treatment with 15d-PGJ2
The natural PPARG ligand, 15d-PGJ2, has been shown to disrupt the microtubule cytoskeletal network in the breast cancer cell line MCF-7 (Pignatelli et al. Reference Pignatelli, Sanchez-Rodriguez, Santos and Perez-Castillo2005). To investigate the effects of this natural ligand in bMEC, the cells were stained with fluorescein-phalloidin (FL-phalloidin, Invitrogen) after incubation with three different doses of 15d-PGJ2, to determine whether microfilament reorganization had been altered (Wulf et al. Reference Wulf, Deboben, Bautz, Faulstich and Wieland1979). Briefly, cells were incubated with 300 μl of medium containing 0·5, 2 or 10 μm 15d-PGJ2 for 48 h in eight-well chamber slides (LabTek Nunc, Naperville IL, USA). Cells grown on slides were washed twice with PBS, fixed in 4% formaldehyde in PBS for 10 min at room temperature, washed twice with PBS and permeabilized with 0·1% Triton X-100 in PBS for 5 min at room temperature. The slides were then washed twice with PBS containing 5% BSA for 15 min and once in PBS. FL-phalloidin was resuspended in 1·5 ml of methanol (final concentration 200 units/ml) and 10 μl of the stock was diluted into 200 μl of PBS for each slide. The FL-phalloidin was applied to the cells for 1 h at room temperature. Following staining, the slides were washed twice with PBS. Nuclei were stained with propidium iodide (Vindelov Reference Vindelov1977). The cells were subsequently examined for fluorescence using an Axiophot fluorescent microscope equipped with epifluorescence and phase contrast optics (Zeiss, Oberkochen, Germany). Photographs were captured and stored using the Axiovision software (Carl Zeiss).
Pre-treatment of bMEC with PPARG ligands followed by lipopolysaccharide-stimulation
An independent experiment was performed to assess whether incubation of bMEC with PPARG agonists could modify the responsiveness of some genes to subsequent lipopolysaccharide (LPS) stimulation. bMEC were pre-incubated with PPARG agonists for 48 h and then stimulated with 10 μg/ml of LPS for a period of 24 h (LPS; phenol-extracted from Escherichia coli serotype O55:B5; Sigma Chemical Co. Cat no. L2880). An earlier study demonstrated that LPS caused marked up-regulation of innate immune genes, including IL-1β, IL-8, TNFα and CXCL6, in these cells (Strandberg et al. Reference Strandberg, Gray, Vuocolo, Donaldson, Broadway and Tellam2005). The LPS concentration and incubation time chosen were based on a previously published dose-response study and kinetic study using the same cells (Strandberg et al. Reference Strandberg, Gray, Vuocolo, Donaldson, Broadway and Tellam2005). Following the incubations, cells were harvested using a cell scraper for subsequent RNA extractions. Controls included cells stimulated with LPS only. Two biological replicates, derived from the same primary bMEC culture, were included for each treatment. The qRT-PCR analyses were performed as described previously and RNA from LPS-stimulated bMEC was used as the calibrator.
Results
Expression of selected innate immune genes after treatment of bMEC with PPARG ligands
None of the agonists of PPARG, with the exception of ciglitazone, had any significant effects on the expression of PPARG, indicating the lack of a strong feedback between the activators of this transcription factor and its gene expression in these cells (Table 2). PPARD, on the other hand, was down-regulated (P<0·05) by all five agonists (Table 2).
Fold-changes (relative to untreated cells) in mRNA expression in bMEC after incubation with PPARG agonists for 48 h
The concentration of all agonists was 10 μm

* P<0·05 (specific P-values are shown in brackets)
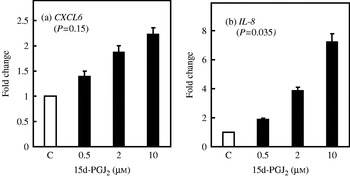
The mRNA expression patterns of six immune-related genes were assessed using qRT-PCR following incubation of bMEC with five PPARG agonists (15d-PGJ2, MC-555, ciglitazone, rosiglitazone and troglitazone) (Table 2). Treatment with the natural ligand 15d-PGJ2 resulted in enhanced expression of CXCL6 and IL-8 compared with untreated cells. Dose-response curves for 15d-PGJ2-stimulation of CXCL6 and IL-8 expression are shown in Fig. 1. The lowest dose of 15d-PGJ2 was sufficient to increase expression of both CXCL6 and IL-8, (P=0·01 and P=6×10⁻⁵, respectively) compared with the control cells. The expression levels of these genes increased in a dose-dependent manner up to the highest dose tested. Linear regression analyses revealed that the dose-response curve was significant only for IL-8 (P=0·035) and not for CXCL6 (P=0·15) (Fig. 1).
The effects of increasing 15d-PGJ2 concentration on CXCL6 and IL-8 mRNA expression in bMEC. qRT-PCR analyses were used to measure the expression of CXCL6 (a) and IL-8 (b) in bMEC treated with 0·5, 2 and 10 μm 15d-PGJ2 for 48 h. The control (C) corresponded to unstimulated cells. Fold-changes were measured relative to the control cells. Linear regression analysis (Microsoft Excel) was used to determine the significance of the dose-response for CXCL6 (P=0·15) and IL-8 (P=0·035). The error bars denote one sd.

Treatment of the cells with MC-555 caused up-regulation of CCL2 (P=0·019) and down-regulation of IL-1β (P=0·021) and IL-6 (P=0·01). Stimulation of the cells with ciglitazone resulted in down-regulation of three pro-inflammatory cytokines, IL-1β (P=0·024), IL6 (P=0·015) and IL-8 (P=0·0019) while TNFα was up-regulated (P=0·049). Treatment with rosiglitazone resulted in down-regulation of IL-1β (P=0·032) and IL-6 (P=5×10⁻⁴) while the expression of TNFα and CCL2 was increased (P=0·008 and P=0·0042, respectively). Incubation of the cells with troglitazone caused down-regulation of IL-6 (P=0·004), IL-8 (P=2×10⁻⁴) and CXCL6 (P=9×10⁻⁴) while CCL2 was up-regulated (P=0·025).
Dose-response effects of 15d-PGJ2 on the expression of genes involved in oxidative stress
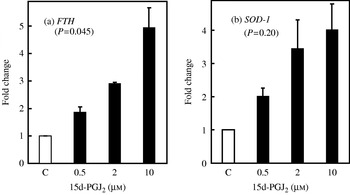
The expression of two genes SOD-1 and FTH were used as markers of oxidative stress responses in bMEC. The qRT-PCR results shown in Fig. 2 revealed that 15d-PGJ2 increased the expression of FTH and SOD-1 in bMEC and that a dose of 2 μm 15d-PGJ2 was sufficient to increase the expression of both transcripts by 2·9-fold and 3·5-fold, respectively. Linear regression analysis showed that the dose-response curve was significant for FTH (P=0·045) but not for SOD-1 (P=0·20).
The effects of increasing 15d-PGJ2 concentration on FTH and SOD-1 mRNA expression. qRT-PCR analyses were used to measure the expression of FTH (a) and SOD-1 (b) in bMEC treated with 0·5, 2 and 10 μm 15d-PGJ2 for 48 h. The control (C) corresponded to unstimulated cells. The fold-changes were measured relative to the control cells. Linear regression analysis (Microsoft Excel) was employed to determine the significance of the dose response for FTH (P=0·045) and SOD-1 (P=0·20). The error bars denote one sd.

Effects of 15d-PGJ2 on cytoskeletal organization in bMEC
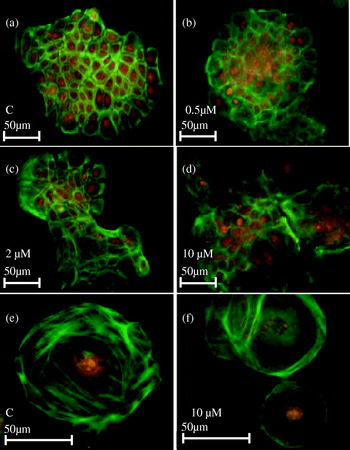
FL-phalloidin was used to determine whether 15d-PGJ2 caused microfilament organization in the bMEC (Wulf et al. Reference Wulf, Deboben, Bautz, Faulstich and Wieland1979). Actin filaments in the unstimulated cells were widely distributed throughout the cytoplasm (Fig. 3 (a) and (e)) while in the 15d-PGJ2-treated cells the filaments were concentrated adjacent to the plasma membrane (Fig. 3 (d) and (f)). This change in cytoskeletal organization was only discerned after incubation of the cells with the highest dose of 15d-PGJ2 (10 μm).
Microfilament organization in bMEC treated with 15d-PGJ2. Microfilaments were visualized with FL-phalloidin after treatment of bMEC with 15d-PGJ2 for 48 h. (a) Control cells (C) (40× magnification). Cells were incubated with: 0·5 μm 15d-PGJ2 (b) (40× magnification); 2 μm 15d-PGJ2 (c) (40×); and 10 μm 15d-PGJ2 (d) (40×). (e) 100× magnification of (a); (f) 100× magnification of (d). The propidium iodide stain (red) shows cell nuclei and the green fluorescence shows the FL-phalloidin staining patterns.

Expression of selected cytokines and chemokines after pre-incubation of bMEC with a panel of PPARG ligands followed by LPS stimulation
Table 3 shows the changes in the expression levels of a panel of genes after pre-incubation of bMEC with PPARG agonists followed by LPS stimulation. The fold-changes represent comparisons made with cells only stimulated by LPS. In contrast to the treatment of the cells in the absence of LPS, the expression levels of IL-8 and CXCL6 were less affected by 15d-PGJ2 in the LPS-stimulated cells. IL-8 was up-regulated (P=5·5×10−5) while the treatment caused down-regulation of CXCL6 (P=0·0028) (Table 3). However, TNFα, CCL2 and CXCL6 were all down-regulated by 15d-PGJ2 in LPS-stimulated cells (P=0·0019, P=0·0032 and P=0·0028, respectively). MC-555, ciglitazone and rosiglitazone caused down-regulation of IL-6 (P=0·0068, P=0·044 and P=0·0010, respectively) while CCL2 was up-regulated (P=0·0028, P=1·9×10−4, and P=0·011 respectively). Interestingly, pre-treatment of bMEC with troglitazone increased the responsiveness of the cells to LPS for IL-1β (P=2×10⁻⁴), IL-8 (P=8·7×10−5), TNFα (P=8·2×10−6), CCL2 (P=1×10⁻⁵) and CXCL6 (P=0·0046). Thus, the different PPARG ligands, and indeed the subset of different synthetic PPARG agonists, caused different patterns of changes in the expression of the measured genes after LPS stimulation.
Fold-changes (relative to cells stimulated with LPS at 10 μg/ml)in mRNA expression after pre-incubation of bMEC with PPARG for 48 h followed by LPS stimulation for 24 h. All agonists were at a concentration of 10 μm

* P<0·05 (specific P-values are shown in brackets)
Discussion
PPARG is a pivotal transcription factor regulating key steps initiating and sustaining adipogenesis, and recently it has been suggested that PPARG is also involved in regulating immune responses in some cell types. However, many of the latter studies report conflicting results, which could be attributable to the use of different cell types and different experimental designs (Jiang et al. Reference Jiang, Ting and Seed1998; Ricote et al. Reference Ricote, Li, Willson, Kelly and Glass1998). The current study used a primary culture of bMEC to investigate the effects of synthetic and natural PPARG agonists on the transcription of genes involved in innate immunity and genes involved in innate immunity in response to LPS-stimulation.
IL-8 is a potent pro-inflammatory chemokine that has been shown to be up-regulated in a wide range of cells, including monocytes and macrophages, upon stimulation with 15d-PGJ2 (Zhang et al. Reference Zhang, Wang, Gong, Mukaida and Young2001). Our results also showed that the expression of IL-8 mRNA was up-regulated in bMEC treated with 15d-PGJ2 and that the effect was dose-dependent (P=0·035) (Fig. 1). The transcript encoding the chemokine CXCL6 was also up-regulated and this is the first report to our knowledge of changes in the regulation of CXCL6 induced by 15d-PGJ2. Although CXCL6 was up-regulated in the cells incubated with 15d-PGJ2 compared with the untreated cells, linear regression analyses showed that the dose-response only approached significance (P=0·15) (Fig. 1). The up-regulation of IL-8 and CXCL6 is consistent with the partial activation of the Nuclear Factor-kappa Enhancer Binding Protein (NFκB) signalling pathway in bMEC stimulated with 15d-PGJ2 although not all pro-inflammatory cytokines under the control of this transcription factor were up-regulated, including IL-1β, IL-6 and TNFα. These results suggest that 15d-PGJ2 induces IL-8 and CXCL6 expression via PPARG independent pathways that may coordinate pro-inflammatory events in mammary epithelial cells. 15d-PGJ2 had no effect on the expression of PPARG (P=0·42) and caused only relatively small down-regulation of PPARD (P=0·025) indicating the absence of a strong feedback circuit that links the transcription of these genes with the activation of their encoded proteins. It is not clear whether the decreased expression of PPARD is the direct result of binding of 15d-PGJ2 to the corresponding encoded transcription factor.
The effects of the synthetic PPARG agonists MC-555, ciglitazone, rosiglitazone and troglitazone were generally consistent with each other but showed a different and much smaller range of effects compared with 15d-PGJ2. In agreement with the results obtained with 15d-PGJ2, the synthetic PPARG ligands reduced the expression of PPARD (Table 2). Previous studies have demonstrated that PPARG ligands can inhibit the growth of cancer cells through apoptosis in vitro and in vivo (Kubota et al. Reference Kubota, Koshizuka, Williamson, Asou, Said, Holden, Miyoshi and Koeffler1998) and Yoshimura et al. (Reference Yoshimura, Matsuyama, Segawa, Hase, Mitsuhashi, Tsuchida, Wada, Kawahito, Sano and Nakatani2003) found that both 15d-PGJ2 and troglitazone inhibited the growth of human bladder tumour cells, highlighting PPARG as a potential therapeutic target for treatment of different tumours. In comparison, Yee et al. (Reference Yee, Williams, Wen, Young, Lester, Johnson, Farrar, Walker, Povoski, Suster and Eng2007) found that rosiglitazone treatment of women with early stage breast cancer reduced the expression of PPARG as determined by immunohistochemistry although tumour cell proliferation did not seem to be affected by this short-term rosiglitazone treatment.
The synthetic PPARG agonists generally inhibited transcription of the measured chemokines and cytokines (Table 2). Previous studies show that rosiglitazone attenuates the expression of IL-6 and IL-8 (the key pro-inflammatory cytokines responsible for leukocyte recruitment) in peripheral blood cells from patients with type 2 diabetes, thereby resulting in reduced inflammation (van Wijk et al. Reference van Wijk, Cabezas, Coll, Joven, Rabelink and de Koning2006). In partial agreement with those findings, our studies revealed that IL-1β and IL-6 were down-regulated in bMEC after treatment with rosiglitazone although there was no obvious effect on the expression of IL-8 (Table 2). Hence, 15d-PGJ2 caused different responses in the unstimulated bMEC compared with the other PPARG agonists even though several of these synthetic agonists are known to have higher affinities for PPARG compared with 15d-PGJ2 (Jozkowicz et al. Reference Jozkowicz, Dulak, Prager, Nanobashvili, Nigisch, Winter, Weigel and Huk2001; Chaffer et al. Reference Chaffer, Thomas, Thompson and Williams2006). 15d-PGJ2 is an effective modulator of inflammatory responses in macrophages homozygous for a null PPARG gene indicating that 15d-PGJ2 has additional targets besides PPARG (Chawla et al. Reference Chawla, Barak, Nagy, Liao, Tontonoz and Evans2001).
In summary, the synthetic PPARG agonists generally caused down-regulation of the cytokines IL-1β, IL-6 and IL-8 and increased expression of CCL2 and TNFα. In contrast, 15d-PGJ2 markedly enhanced expression of both IL-8 and CXCL6 and had no effect on the expression of IL-1β, IL-6, TNFα and CCL2. Thus, the different responses observed for the synthetic agonists and 15d-PGJ2 in the current study may be due to 15d-PGJ2-induced activation of PPARG-independent pathways (Chawla et al. Reference Chawla, Barak, Nagy, Liao, Tontonoz and Evans2001; Jozkowicz et al. Reference Jozkowicz, Dulak, Prager, Nanobashvili, Nigisch, Winter, Weigel and Huk2001). The varied responses we observed in bMEC with the different synthetic PPARG agonists are consistent with the mixed reports of immune activation or inhibition by different PPARG agonists in other cell types including macrophages and monocytes (Jiang et al. Reference Jiang, Ting and Seed1998; Ricote et al. Reference Ricote, Li, Willson, Kelly and Glass1998).
It has been shown previously that cyclopentenone prostaglandins (including 15d-PGJ2) induce production of reactive oxygen species (ROS) through a PPARG independent mechanism in neuroblastoma cells (Kondo et al. Reference Kondo, Oya-Ito, Kumagai, Osawa and Uchida2001). To examine whether 15d-PGJ2 contributes to the generation of ROS in bMEC we used qRT-PCR to measure the expression of two genes encoding proteins known to be transcriptionally activated by oxidative stress (Balla et al. Reference Balla, Jacob, Balla, Rosenberg, Nath, Apple, Eaton and Vercellotti1992; Arita et al. Reference Arita, Joseph, Koo, Li, Palaia, Davis and Kazzaz2004;). The expression of FTH was induced by treatment of bMEC with 15d-PGJ2. FTH plays a major role in providing the cell with increased resistance to oxidative stress by removing intracellular free iron and consequently minimizing formation of highly reactive oxygen species (ROS) (Elia et al. Reference Elia, Polla, Rossi and Santoro1999). FTH is also known to protect cultured cells against damage induced by oxidative stress, which then confers resistance to subsequent challenges (Balla et al. Reference Balla, Jacob, Balla, Rosenberg, Nath, Apple, Eaton and Vercellotti1992). Some pro-inflammatory cytokines have the capacity to induce FTH. Whether the increased expression of FTH is a direct effect of 15d-PGJ2 or an indirect effect of the actions of IL-8 and CXCL6 is unclear (Torti & Torti, Reference Torti and Torti2002). The induction of FTH, an acute phase protein, in human monocytes has been shown to be specific for cyclopentenone prostaglandins (A-type prostaglandins A1, A2 J2) while other arachidonic acid derivatives displayed no effects (Elia et al. Reference Elia, Polla, Rossi and Santoro1999).
SOD-1 is another transcript encoding a protein involved in oxidative stress responses that was up-regulated by 15d-PGJ2. Thus, the up-regulation of both FTH and SOD-1 indicates that 15d-PGJ2 was inducing an oxidative stress response in these cells. Arita et al. (Reference Arita, Joseph, Koo, Li, Palaia, Davis and Kazzaz2004) showed that an increase in manganese superoxide dismutase (MnSOD) activity reduced bacterial adherence and IL-8 protein expression in lung epithelial cells. Similar results for CuZnSOD (SOD-1) were also demonstrated. The induction of SOD-1 expression by 15d-PGJ2 in bMEC may indicate that SOD-1 plays an important role in regulating infection and inflammation in bMEC and that SOD-1 may have partially dampened the IL-8 induction in these cells.
The microfilament network in bMEC treated with 15d-PGJ2 was disrupted with evidence for a larger number of smaller microfilaments attached to the cytoplasmic face of the cell membrane. Again, it is unclear whether this was a direct effect of 15d-PGJ2 or the result of a stress response in these cells. The cytoskeleton is a dynamic and highly responsive architectural system that is intimately involved in many aspects of cellular function. Disruption of microfilament organization may also have effects on the secretion of chemokines and cytokines from these cells. It is not known whether the increased mRNA expression of IL-8, and presumably increased IL-8 protein expression in bMEC stimulated by 15d-PGJ2, is directly influenced by the accompanying cytoskeletal reorganization. It has been demonstrated that cytoskeletal organization is altered in 15d-PGJ2 stimulated breast cancer cells (MCF-7) by a mechanism unrelated to PPARG transcriptional activation. (Pignatelli et al. Reference Pignatelli, Sanchez-Rodriguez, Santos and Perez-Castillo2005).
An earlier study showed that the expression of many innate immune genes in bMEC was markedly stimulated by exposure of the cells to LPS (Strandberg et al. Reference Strandberg, Gray, Vuocolo, Donaldson, Broadway and Tellam2005). Therefore, we investigated whether pre-treatment of bMEC with PPARG agonists would have any activating or dampening effects on this LPS-responsiveness. The effects of the PPARG agonists on the LPS-induced responses in bMEC were varied. Again, 15d-PGJ2 caused different effects compared with the synthetic agonists, in that it repressed the LPS-mediated activation of TNFα and CCL2 while the synthetic PPARG agonists stimulated their expression. Our studies also showed that troglitazone up-regulated the expression of TNFα, IL-1β, IL-8, CCL2 and CXCL6. The other agonists had only small effects on the expression of IL-8 and CXCL6, the two most highly differentially expressed genes in cells pre-incubated with 15d-PGJ2 in the absence of LPS (Table 3). The 15d-PGJ2 induced activation of IL-8 and CXCL6 in bMEC did not blunt their overall response to LPS. The capacity of the bMEC to respond to LPS is unchanged by pre-incubation with 15d-PGJ2 despite the latter being able to stimulate increased IL-8 expression in cells not stimulated by LPS. This suggests that the enhanced expression of IL-8 by these two agents, 15d-PGJ2 and LPS, is mediated by different pathways.
In summary, stimulation of bMEC with 15d-PGJ2 resulted in activation of a partial pro-inflammatory response, a probable oxidative stress response and substantial alteration of the cytoskeletal organization in these cells. Despite these effects, the cells maintained responsiveness to LPS. These effects were not mimicked by the synthetic PPARG agonists despite several of them having stronger affinities for PPARG (Chaffer et al. Reference Chaffer, Thomas, Thompson and Williams2006). It is concluded that 15d-PGJ2 has PPARG-dependent and PPARG-independent mechanisms of action in bMEC. The latter are yet to be defined. The study also demonstrated that the generation of pro-inflammatory mediators in bMEC can be modulated by commercially available therapeutic agents. These agents may potentially be used as an alternative or complement to antibiotics during the treatment of bovine mastitis, although their efficacies would need to be assessed by future experiments in cattle.
We thank Paul Sheehy at the University of Sydney (Camden) for providing the bMEC and Tony Vuocolo for providing some oligonucleotide primers. This research was supported by the Cooperative Research Centre for Innovative Dairy Products.