


The United States faces an acute housing shortage. Over the last several decades, city and state governments have made it increasingly difficult to build new housing—especially multifamily housing such as apartments. Research finds that these policies have created housing shortages which have more than doubled housing costs in many areas (Glaeser and Gyourko Reference Glaeser and Gyourko2018; Phillips, Manville, and Lens Reference Phillips, Manville and Lens2021), segregated cities (Trounstine Reference Trounstine2020), and stifled socioeconomic mobility (Schleicher Reference Schleicher2017). The public has noticed too: surveys routinely find that the cost of living is the American public’s number one concern, and housing costs are the biggest expense in household budgets.Footnote 1
Understanding why many voters support anti-development policies is an active area of influential research (for review, see Brouwer and Trounstine Reference Brouwer and Trounstine2024). Existing research emphasizes two explanations. First, homeowners are thought to oppose new housing supply in order to maintain their property values (Einstein, Glick, and Palmer Reference Einstein, Glick and Palmer2019; Fischel Reference Fischel2001; Marble and Nall Reference Marble and Nall2021).Footnote 2 Second, homeowners and renters alike are thought to oppose new housing in their homes’ immediate vicinity due to the “noise, congestion, and aesthetic change that comes with new housing”—a phenomenon known as NIMBYism (Not In My BackYard) (Hankinson Reference Hankinson2018, 474; see also Einstein, Glick, and Palmer Reference Einstein, Glick and Palmer2019; Hankinson and Magazinnik Reference Hankinson and Magazinnik2023; Larsen and Nyholt Reference Larsen and Nyholt2024; Marble and Nall Reference Marble and Nall2021; Mast Reference Mast2024; Sahn Reference Sahn2025).
While these two theories clearly hold merit, they may be incomplete. First, with respect to homeowner financial self-interest, research often finds small differences between homeowners’ and renters’ attitudes toward development (Larsen and Nyholt Reference Larsen and Nyholt2024), or even that homeowners are more supportive of development than renters (Elmendorf, Nall, and Oklobdzija Reference Elmendorf, Nall and Oklobdzija2024b). Such mixed findings align with research in other domains that self-interest typically has small impacts on public opinion (Citrin and Green Reference Citrin, Green and Long1990).
Second, the theory of NIMBYism offers less insight into understanding voter support for consequential housing policies that do not concern specific proposed projects. Policymakers and advocates have increasingly focused on making broadly-applicable housing policies, rather than negotiating over specific proposed projects. For example, state legislatures nationwide have recently passed dramatic reforms regarding single-family zoning, accessory dwelling units, environmental review, density bonuses, below-market unit mandates, development fees, rent control, nondiscretionary permitting, and more (Alameldin and Garcia 2023). Because it is hard to gauge whether any given neighborhood would be substantially impacted by such policies, NIMBYism is less clearly applicable to understanding voter support for them. But in many states, such policies are the only policies that matter: due to recent reforms in many states, local governments lack discretion to approve or deny specific proposed projects altogether.
In this article, we argue for a third, complementary theoretical explanation for anti-development sentiment rooted in symbolic politics theory (Sears Reference Sears, Iyengar and McGuire1993): that different housing policies make different groups salient to voters, and that voters judge policies in part on their affect toward the groups those policies make salient.
A housing development involves a large number of groups, including investors to finance it, developers to propose it, government entities to approve it, and residents to ultimately pay for and live in it. We show that changes to policy design or framing which make different groups salient lead voters to rely on their attitudes toward these groups when judging these policies—often in ways contrary to what the literature assumes is in their self-interest. We argue that housing politics may be particularly susceptible to being influenced by such group attitudes because housing policy features a large number of potentially relevant groups with whom voters are familiar from their experiences in other contexts (e.g., wealthy people, local government politicians, unions, and Wall Street investors), but is a relatively new issue in state and national (rather than local) politics, where the policies at stake may still be unfamiliar to many voters. Moreover, housing policy generally lacks partisan cues, as it currently divides the parties internally. Finally, it also implicates voters’ self-interest in ways that may be hard for laypeople to understand: Elmendorf, Nall, and Oklobdzija (Reference Elmendorf, Nall and Oklobdzija2025) find that people’s beliefs about the economic effects of new housing are uncertain and unstable, conditions which Citrin and Green (Reference Citrin, Green and Long1990) suggest should lead the impacts of beliefs about self-interest to have minimal effects on policy attitudes. Perhaps as a result, Elmendorf, Nall, and Oklobdzija (Reference Elmendorf, Nall and Oklobdzija2024b) find minimal differences in support for development policies between homeowners and renters.
We present a variety of empirical data consistent with this theory. First, we present a number of experiments varying the design or framing of policies related to zoning, permit streamlining, demolition controls, environmental reviews, and other policies with crucial implications for housing development. We find that affect toward the developers and investors who build housing, the government actors who approve it, and new housing’s residents powerfully predict anti-development preferences when affect toward these groups is experimentally made salient by those policies or framings. Crucially, we show these patterns arise both when merely changing policies’ framing and when changing their actual substance (Huber and Paris Reference Huber and Paris2013). Homeownership and NIMBYism often fail to predict patterns we find.
Second, to provide further evidence that affect toward groups has a causal effect on housing policy preferences, we show that manipulating affect toward developers has meaningful downstream effects on support for new development and permitting reforms. In particular, we partnered with a real-world real estate developer and a professional videographer to make short videos that sought to improve voters’ affect toward developers. For example, one video highlighted the developer’s personal weekend volunteerism for a dog rescue organization. We first verify that the videos have their intended effect and improve affect toward developers. We then show that, even when the videos avoid mentioning substantive housing policies, they increase voter support for developers building new apartments in the voter’s neighborhood, and in some cases support for nondiscretionary permitting for new development. To the best of our knowledge, this is the first experimental demonstration in the symbolic politics literature that manipulating affect toward a group can have downstream causal effects on policy preferences. By contrast, a negative video drawing on a common trope about developer corruption reduces support for these policies.
We conclude by discussing limitations of these findings and potential broader implications for policymakers and practitioners. As we elaborate, one implication of our findings is that, ironically, voter dislike of the very actors who could ameliorate the housing shortage further exacerbates it.
THEORETICAL ARGUMENT: SYMBOLIC HOUSING POLITICS
Symbolic politics theory arose in response to the failure of measures of self-interest to meaningfully predict presidential voting and attitudes toward policies such as busing for school desegregation. Early research in this area found that measures of affect toward relevant symbols and groups, such as racial groups or partisan labels, often better predicted issue preferences and vote choices (Sears et al. Reference Sears, Lau, Tyler and Allen1980; Sears, Hensler, and Speer Reference Sears, Hensler and Speer1979). As Sears (Reference Sears, Iyengar and McGuire1993, 120) summarizes the theory:
[Symbolic politics] theory holds that people acquire stable affective responses to particular symbols
$ \dots $
 Later in life, people respond to
$ \dots $
 political attitude objects consistent with these standing predispositions.
At a psychological level, symbolic politics theory’s predictions about how people judge policy issues can be considered a form of the attribute substitution heuristic (Kahneman and Frederick Reference Kahneman, Frederick, Gilovich, Griffin and Kahneman2002): when faced with a difficult policy question, people may form judgments by mentally substituting an easier question for it, such as “do I like the group this policy appears to benefit?” More generally, then, symbolic politics theory argues that when people form judgments about unfamiliar policy issues or candidates, they rely on their affect toward the groups or symbols that these stimuli make salient—what is known psychologically as a “transfer of affect” (Sears Reference Sears, Iyengar and McGuire1993, 120).
We argue that housing policies should be especially susceptible to this process. Relative to issues such as busing or presidential vote choice, housing policies are often especially novel, abstract, and/or complex. Housing development also involves a large number of groups, including investors to finance it, developers to propose it, government entities to approve it, and residents to ultimately pay for and live in it, offering voters many opportunities to use their affect toward groups to form judgments. Through political rhetoric and even through changes to policy design, elites may heighten the salience of liked or disliked symbols.
Notably, voters may have strong attitudes toward these symbols due to their experiences in contexts beyond housing policy—for example, people’s views toward symbols such as wealthy people, local government politicians, unions, specific U.S. Presidents, and Wall Street investors may often be informed by experiences that are unrelated to housing policy. However, we show below that their views toward all these symbols can be harnessed to change their evaluations of housing policies. This may create the potential for elites to influence public opinion by harnessing voters’ affect toward these groups. For example, a liberal voter who generally supports building new housing in their community but dislikes the wealthy might be dissuaded from supporting a rezoning by being reminded that the wealthy might live in the new apartments it allows. Or, a conservative voter who generally supports loosening local restrictions on housing development but dislikes the Democratic governor of their state might be persuaded to oppose a policy allowing the state to override local permitting by being reminded that this would put more power in the Democratic governor’s hands. Even views toward actors more directly related to housing policy, such as real estate developers, might be shaped through experiences unrelated to housing, such as negative portrayals in popular culture (see Appendix C of the Supplementary Material), creating opportunities for elites to turn supporters of various housing policies into opponents or vice versa.Footnote 3
In addition to presenting a range of plausibly relevant symbols, several features of housing politics may also lead voters to be especially likely to rely on symbolic political reasoning. First, housing policy is complex. For instance, suppose voters are faced with the question of whether new housing developments should be required to set aside units for low-income people at below-market rates. Voters may reflect on the simpler question of whether they like this policy’s putative beneficiaries (low-income people) or dislike those who appear to pay its costs (developers), rather than reason through the complexities of how such a policy would impact housing markets and, in turn, their own financial self-interest or the probability of new development in their neighborhood—even though so-called “inclusionary zoning” policies have dramatic impacts on new housing supply and prices (Rollet Reference Rollet2025; Phillips 2024).Footnote 4
Housing policies also lack clear partisan cues. The national parties and many state parties are internally divided on the issue, with state housing policies often passing through bipartisan coalitions supported and opposed by members of both parties. Local governments which make housing policy are also often nonpartisan. Without clear partisan cues, many voters should be susceptible to persuasion (Freeder, Lenz, and Turney Reference Freeder, Lenz and Turney2019).
There is also reason to expect self-interest to matter less when it comes to housing policies that apply generally than it does when voters consider specific proposed housing projects. Research finds that self-interest tends to influence policy attitudes more when the policy’s impacts on one’s self-interest are more visible, tangible, large, and certain (Citrin and Green Reference Citrin, Green and Long1990). These conditions may not even be met for specific proposed developments, such as a city council’s decision about whether to allow an apartment building next door—Elmendorf, Nall, and Oklobdzija (Reference Elmendorf, Nall and Oklobdzija2025) find that people have unstable beliefs about the effect of new “luxury” housing on nearby rents. But these conditions are especially unlikely to be met for consequential housing policies that apply broadly and are more complex, such as whether investors are allowed to redevelop single-family homes into duplexes.Footnote 5
Consistent with these expectations, across our studies, we show that this theoretical framework can help understand preferences on a broad range of housing policies under active debate in state legislatures and cities nationwide.
As we discuss in greater detail, the theory of symbolic politics has implications for both scholars and practitioners of housing politics. For practitioners, our findings offer novel insights for designing housing policies that could win popular support. For example, we show that policies are more popular when they make sympathetic groups salient—such as policies to upzone cities where housing is unaffordable for nurses and firefighters, well-liked groups. We elaborate on these ideas in the discussion. In addition, the central role that affect toward various groups appears to play in housing policy preferences suggests that advocates may want to invest in burnishing the reputations of groups, such as developers and investors.
For scholars, our findings contribute to two important literatures. First, our research contributes to the literature on housing politics and policy. Although symbolic politics theory is well-known in political science (e.g., Mendelberg Reference Mendelberg2018), it is not a common approach for understanding housing politics. The most related research is from Monkkonen and Manville (Reference Monkkonen and Manville2019), who test the effects of a message that informs participants that developers obtained a “special permit” for a project that will allow them to make more money by building it denser than the city’s zoning “normally allows.” They find that this message reduces support for the project, and speculate this is because people see it as immoral for developers to profit—a view which might be traced to dislike of developers. However, this research did not seek to isolate the effect of affect toward developers nor did it measure it.Footnote 6 Einstein, Glick, and Palmer (Reference Einstein, Glick and Palmer2023) also show that “distrust” of developers correlates with opposition to development, but note that they are unable to pin down causality. Finally, Hankinson and de Benedictis-Kessner (Reference Hankinson and de Benedictis-Kessner2024) find that people say they would refuse compensation in exchange for allowing new subsidized housing developments near their homes. The authors speculate that sympathy toward the poor, a “symbolic value,” may be responsible, but do not measure this. More generally, no research we are aware of has theorized nor empirically studied how affect toward a broader suite of symbols—such as wealthy people, local government politicians, unions, specific U.S. Presidents, and Wall Street investors—might be brought to bear on voters’ housing policy attitudes.Footnote 7 Finally, our research complements other recent work investigating sources of housing attitudes outside of NIMBYism and homeowners’ financial self-interest (Larsen and Nyholt Reference Larsen and Nyholt2024; Larsen and Nyrup Reference Larsen and Nyrup2025; Ternullo Reference Ternullo2024; Reference Ternullo2026).
Second, our research contributes to the literature on symbolic politics itself. Symbolic politics theory is well-known, but contemporary tests are rare. Some tests rely on panel data where a baseline measure of a symbolic attitude (e.g., affect toward Blacks) is shown to predict over-time changes in attitudes toward a stimulus which has changed in a relevant way (e.g., the race of the President) (e.g., Tesler Reference Tesler2012; Reference Tesler2015). These and related experimental tests have important advantages over prior tests, but remain subject to critique on the grounds that other attributes of the stimuli may have changed—or be perceived to change—along with the relevant symbols (e.g., Huber and Paris Reference Huber and Paris2013). Our research therefore adds to research on symbolic politics in two ways. First and most importantly, our experiment manipulating affect toward developers provides what is, to our knowledge, the first experimental test of the effect of manipulating affect toward a group on downstream policies which make this group salient. Second, our series of experiments manipulating the salience of various groups are also careful to minimally alter underlying policy substance. Although no one finding or experiment we present is definitive, they collectively suggest a powerful role for symbolic attitudes in housing politics, thereby providing novel evidence for symbolic politics theory more broadly.
The next section details the data we used for these tests.
DATA
Our data come from two national surveys: one
$ N=102,740 $
 survey conducted in May 2024 on the platform Lucid (Coppock and McClellan Reference Coppock and McClellan2019) and a second
$ N=16,732 $
 survey conducted in Fall 2025 on the platform Prolific (Peer et al. Reference Peer, Rothschild, Gordon, Evernden and Damer2022). On both surveys, all respondents were required to pass two attention checks, the second of which required watching a short video unrelated to housing and accurately reporting its contents. Figure A1 in the Supplementary Material shows that the Lucid respondents are broadly representative of the American population on a variety of political and demographic dimensions (American National Election Studies 2021; Schaffner, Ansolabehere, and Luks Reference Schaffner, Ansolabehere and Luks2021). As the Prolific survey was intended to test causal effects, we are primarily interested in the sample average treatment effect estimates. Both surveys also contained other questions for other projects. We describe the mechanics of each survey in more detail below.
We obtained informed consent from all participants. These studies were preregistered.Footnote 8 For replication data, see Broockman, Elmendorf, and Kalla (Reference Broockman, Elmendorf and Kalla2026).
SALIENCE MANIPULATION EXPERIMENTS
We first present a series of experiments testing our theory of symbolic housing politics by manipulating the salience of various groups. We structure our tests around three classes of groups that housing policies can make salient: developers and investors, government entities which make decisions about approving housing projects, and the residents of new housing. In each case, our argument predicts that policies or framings which make certain groups salient lead respondents to rely on their views toward those groups in order to form their views about the relevant housing policy.
In some cases, we hold constant policy content and merely change how a given policy is framed, while in others, we allow for minor differences in the policies themselves (Huber and Paris Reference Huber and Paris2013). We see both of these as relevant, as our findings suggest that policymakers may be able to meaningfully affect public support through minor changes in policy design which increase or reduce the salience of various liked or disliked groups.
Survey Design
At the beginning of the housing portion of the survey, we first randomized respondents to one of multiple vignette conditions. Before seeing their assigned vignette, respondents were all asked the same baseline questions about housing. These questions included a feeling thermometer battery, which asked respondents to rate how warmly or coolly they felt toward five people, groups, or ideas on a 0–100 scale (e.g., cities, developers, etc.). This is our measure of affect. The five groups displayed to each respondent varied depending on which experimental vignette that respondent was assigned. Feeling thermometers started at 50 by default, and so we recode missing values to 50. We show the means and standard deviations for each feeling thermometer question in Table A1 in the Supplementary Material.
Respondents next answered unrelated questions, such as about their party identification and ideology.
Respondents finally saw the experimental vignette to which they were randomly assigned. Because all respondents only saw one vignette, we give the sample sizes for each vignette separately, bearing in mind that the vignette-specific samples are random subsamples representative of the overall sample. Due to the large number of vignettes, we give question wordings for each vignette in the “Results” section just prior to presenting its results.
Results
Affect toward Developers and Investors
Constructing new housing requires investors to provide capital and developers to apply for permits and manage construction. We therefore first investigate the potential role of affect toward developers and investors in driving anti-development sentiment.
Real Estate Developers. We begin with a simple policy which was likely easy for people to understand and therefore where symbolic considerations might play a more limited role. In particular, we randomized
$ 8,411 $
 respondents into one of two versions of this question:
-
• “Would you support or oppose allowing new apartment buildings to be built in your neighborhood?”, or
-
• “Would you support or oppose allowing developers to build new apartment buildings in your neighborhood?”
(The italics did not appear to respondents.) Respondents answered on a 1–5 scale ranging from “Strongly oppose” to “Strongly support,” which we rescale to range from 0 to 1.
Because apartment buildings are only built by developers, these questions ask about the same policy, but the second version makes developers more salient. According to our theory, the second version of the question should therefore decrease support because it makes the often-disliked symbolFootnote 9 “developers” salient.
Figure 1a shows the results. Consistent with our predictions, mentioning “developers” reduced support for the policy by approximately 0.04 scale points overall (
$ p<0.001 $
 ).Footnote 10 Figure 1b shows that this is driven by the subset of the sample with negative affect toward real-estate developers (interaction
$ p<0.01 $
 ). See Table A5 in the Supplementary Material for full regression results.
Support for Allowing New Apartment Buildings in One’s Neighborhood, by Whether Developers Would Build Them

Figure 1. Long description
A two-panel figure labeled a and b.
Panel a, titled Main effect, is a point-range plot. The y-axis is Support for New Apartments on a 0 to 1 scale, ranging from 0.48 to 0.54. The x-axis has two categorical labels. The first, developers to build new apartment buildings, shows a point at approximately 0.495 with a vertical error bar. The second, new apartment buildings to be built, shows a higher point at approximately 0.538 with a vertical error bar.
Panel b, titled Interaction, is a line graph. The y-axis is Support for New Apartments on a 0 to 1 scale, ranging from 0.3 to 0.7. The x-axis is Real estate developers feeling thermometer, ranging from 0 to 100. Two lines with shaded confidence intervals are shown. A red line, representing the survey language developers to build new apartment buildings, starts at approximately 0.33 at x equals 0 and rises steeply to approximately 0.68 at x equals 100. A teal line, representing the survey language new apartment buildings to be built, starts higher at approximately 0.41 at x equals 0 and rises with a shallower slope to approximately 0.70 at x equals 100. The lines intersect near the x equals 80 mark. A dense rug plot of data points sits along the bottom of the x-axis.
The remainder of our tests in this section of the article follows the same format as these tests: we show that associating policies with liked or disliked groups changes support, and that these differences are most driven by respondents who had previously registered like or dislike for those groups.
We emphasize that in this first set of experiments we did not randomize voters’ affect toward relevant groups. However, we show both that these patterns arise across a wide variety of manipulations, and, later in the article, that manipulating affect toward the group (developers) does affect policy support.
By-Right Permits: For “Developers” or “Homebuilders”?
We next consider a more complex policy, which might lead people to rely on symbolic considerations to a greater extent. Much of the housing politics literature focuses on discretionary approvals of particular housing projects (e.g., Trounstine Reference Trounstine2023). However, such discretionary approvals are not always part of the housing permitting process. Under by-right permitting regimes, housing must be approved and granted permits if it follows applicable laws and regulations. By-right permitting is a powerful pro-development policy: it removes neighborhood groups’ ability to block code-compliant housing projects and dramatically reduces permitting timelines (O’Neill et al. Reference O’Neill, Adury, Biber, Tan, Tepper and Wang2023).
We asked
$ 12,714 $
 respondents whether permits for apartment buildings should be by-right:
In order to build new housing in a city, groups such as [SUBMITTING GROUP] have to submit their proposed development to the city for review.
Recently there has been debate about whether cities should be required to approve a proposed housing development if it follows clear and specific rules the government made in advance. Today in many places, [REVIEWING GROUP] can often reject proposed housing developments, even if the proposal meets all the requirements that were made in advance.
Which of the following two statements come closer to your views—even if neither is exactly right:
-
• “ $ [ $
 SUBMITTING GROUP
$ ] $
should be able to build apartments that comply with the clear and specific rules the government made in advance.”
-
• “ $ [ $
REVIEWING GROUP
$ ] $
should always be able to reject a proposed apartment development.” -
• Don’t know.


We code responses as 1 (support of by-right permitting), 0.5 (for don’t know), and 0 (opposition to by-right permitting).
We randomized whether the submitting group was “small local homebuilders” or “big real estate developers.” (We also randomized which government officials would be responsible for discretionary reviews; we return to these results later in the article.)
Figure 2a shows that by-right permitting for “small local homebuilders” is approximately 25 percentage points more popular than it is for “big real estate developers” (
$ p<0.001 $
 ). Furthermore, Figure 2b shows that this effect is driven by people who dislike big real estate developers; at the end of the scale, those who dislike them the most are approximately 37 percentage points more supportive of streamlined permitting for “small local homebuilders” than “big real estate developers” (interaction
$ p<0.001 $
 ). See Table A6 in the Supplementary Material for full regression results.
By-Right Permitting by Group Applying for Permit

Figure 2. Long description
Panel a, titled Main effect, is a point-and-whisker plot. The y-axis is Support for By-Right Permitting on a 0 to 1 scale, ranging from 0.5 to 0.7. The x-axis lists two groups. Big real estate developers has a mean support point at approximately 0.45. Small local homebuilders has a significantly higher mean support point at approximately 0.69. Both points include vertical error bars.
Panel b, titled Interaction, is a line graph. The y-axis is Support for By-Right Permitting on a 0 to 1 scale, ranging from 0.2 to 0.7. The x-axis is Big real estate developers feeling thermometer, ranging from 0 to 100. A legend at the bottom identifies two submitting groups. The red line for Big real estate developers shows a strong linear increase, starting at approximately 0.3 support at 0 on the thermometer and rising to approximately 0.7 support at 100. The teal line for Small local homebuilders shows a slight concave curve, maintaining a high level of support between 0.65 and 0.7 across the entire thermometer range. Both lines are surrounded by grey shaded confidence intervals. A dense rug plot of black data points sits along the bottom of the x-axis.
This manipulation, like several others we study, does not merely change how by-right permitting is framed; there is also a difference in the policy substance (Huber and Paris Reference Huber and Paris2013). This introduces the potential alternative explanation that respondents were reacting to the substance of the policy based on their logically or experientially (rather than affectively)-drivenFootnote 11 beliefs about the behavior of different kinds of developers—for example, a belief that big real estate developers might build more expensive apartments or larger buildings than small local homebuilders. We thus replicated this result using a controlled details design (Dafoe, Zhang, and Caughey Reference Dafoe, Zhang and Caughey2018), providing additional information about the policy that should reduce the scope for respondents to make these kinds of inferences. In our replication, we compared a “No Policy Detail” condition which closely replicated Figure 2b’s result with a “Detailed” condition that specified the policy would only apply to buildings of a specific size, at a specific affordability level, and subject to specific design, parking, construction time, and noise rules. If the effect in Figure 2b were driven by respondents making inferences about these dimensions, limiting respondents’ scope to make these inferences should reduce the effect size. However, Figure 3 shows that the effect of the “big real estate developers” manipulation was essentially identical (only 14% smaller) when providing these extensive details. While not definitive, this result suggests that respondent inferences separate from affect-based reasoning are unlikely to completely explain this effect. Appendix B of the Supplementary Material provides a more extended theoretical discussion and further information and results, including that respondents in the “big real estate developers” condition often explained their choices by making reference to negative feelings they had toward developers. (We also provide further evidence on the causal effects of affect later in the article, where we manipulate affect.)
Follow-Up Study: Providing Details about By-Right Permitting Policy

Figure 3. Long description
A multi-panel figure with two side-by-side line graphs.
Shared Axes:
- The y-axis is labeled Support for By-Right Permitting (0 to 1 scale) with increments of 0.25.
- The x-axis is labeled Big real estate developers feeling thermometer with values from 0 to 100 in increments of 25.
- A legend at the bottom identifies the Submitting Group: a red line for Small local homebuilders and a teal line for Big real estate developers. Shaded gray areas represent confidence intervals.
Left Panel (No Policy Detail):
- The red line for small local homebuilders starts at approximately 0.65 and shows a slight linear increase to about 0.75.
- The teal line for big real estate developers starts much lower at approximately 0.20 and shows a steep linear increase, crossing the 0.50 mark at x equals 50 and ending near 0.70.
- A dense cluster of black data points sits along the baseline at y equals 0.20.
Right Panel (Detailed):
- The red line for small local homebuilders starts at approximately 0.60 and increases linearly to about 0.80.
- The teal line for big real estate developers starts at approximately 0.22 and shows a steep linear increase, ending at approximately 0.80, nearly converging with the red line at the x equals 100 mark.
- Similar to the first panel, a dense cluster of black data points is located at the bottom of the plot.
Even if voters react to these policies by relying on their affect toward the groups they make salient rather than the policy’s substance, the policy’s substance may matter tremendously for policy outcomes. For example, when by-right permitting reforms face opposition due to anti-developer sentiment, “half loaf” reforms that specifically apply to small local builders may encounter less resistance. But such a concession would have real costs—for example, D’Amico et al. (Reference D’Amico, Glaeser, Gyourko, Kerr and Ponzetto2024) find that fragmentation of the homebuilding industry has reduced investment in R&D, potentially reducing construction productivity and increasing housing costs.
Wall Street Investors Demolishing Homes. Investors also play an important role in facilitating multifamily housing development. Sometimes owners of existing properties invest their own capital to demolish existing structures and build larger multifamily developments in their place. In other cases, external investors bankroll this process. However, “Wall Street investors” may be a negative symbol for some voters, perhaps especially following the 2008 financial crisis.Footnote 12 Indeed, Elmendorf, Nall, and Oklobdzija (Reference Elmendorf, Nall and Oklobdzija2024b) find overwhelming support for restrictions on “Wall Street investors” buying homes. Cities and states nationwide have thus been considering bans on “Wall Street investors” purchasing or redeveloping housing as a way to reduce prices, even though the impact of such policies is unclear (e.g., Garriga, Gete, and Tsouderou Reference Garriga, Gete and Tsouderou2023).Footnote 13
To illuminate the potential of “Wall Street investors” as a symbol to drive anti-development sentiment, we asked
$ 12,956 $
 respondents the following question about developer buyouts:
The next question asks whether you think a [INVESTOR] should be allowed to tear down old apartments and build new housing, in specific circumstances.
A [INVESTOR] wants to tear down a small, old apartment building and build a new, larger apartment building on the same site. The apartments in the old building are rent controlled.
The [INVESTOR] offers the tenants a sum of money if they agree to move out.
If you had to choose, which of the following two statements comes closer to your views—even if neither is exactly right:
-
• “The [INVESTOR] should not be allowed to demolish the old building for new housing unless every tenant accepts the landlord’s offer. No tenant should have to move against their will.”
-
• “The [INVESTOR] should be allowed to demolish the old building for new housing if more than two-thirds (67%) vote to accept the landlord’s offer. A small minority shouldn’t be able to block new housing that people need.”
-
• Don’t know.
We code responses as 1 (support for allowing demolitions with tenant agreement), 0.5 (for don’t know), and 0 (opposition to demolition without unanimous agreement).
While the response options always mentioned the landlord, the vignette and response options sometimes also mentioned a “Wall Street investor”: the [INVESTOR] was randomized to take the value “landlord” or “Wall Street investor.”
Figure 4a shows that respondents were 13 percentage points more supportive of the pro-development policy when it applied to landlords rather than Wall Street investors (
$ p<0.001 $
 ). Figure 4b shows that this is driven by those with relatively negative views of Wall Street investors (interaction
$ p<0.01 $
 ). See Table A7 in the Supplementary Material for full regression results.Footnote 14
Demolition Permits by Group Investing in Redevelopment

Figure 4. Long description
Panel a, titled Main effect, is a point plot. The Y-axis is Support for Demolition on a 0 to 1 scale, ranging from 0.35 to 0.50. The X-axis lists two groups. The Landlord group has a support point at approximately 0.50 with a vertical error bar. The Wall Street investor group has a significantly lower support point at approximately 0.36 with a vertical error bar.
Panel b, titled Interaction, is a line graph. The Y-axis is Support for Demolition on a 0 to 1 scale, ranging from 0.2 to 0.6. The X-axis is Wall Street investors feeling thermometer, ranging from 0 to 100. Two colored lines with shaded confidence intervals represent the groups.
* The Landlord group, shown as a red line, starts at 0.38 support at the 0 mark, rises steadily to a peak of 0.59 at the 75 mark, and then slightly declines to 0.55 at the 100 mark.
* The Wall Street investor group, shown as a teal line, starts much lower at 0.20 support at the 0 mark and shows a consistent linear increase, reaching its highest point of 0.59 at the 100 mark, where it intersects with the Landlord group's confidence interval.
A dense rug plot of black data points sits along the bottom of the X-axis.
In summary, our first set of experiments shows that voters’ attitudes toward those who construct new housing can meaningfully affect their views toward housing policies which make those groups salient.
Attitudes toward Government Actors Responsible for Permitting
In our next set of experiments, we consider how affect toward government actors responsible for permitting housing can shape support for housing policy. Housing projects can require approvals from all sorts of government actors: city staff, local politicians, environmental officials, state review boards, courts, and even federal bureaucrats (when using federal funds). Policy can determine which actors have this authority, such as by mandating environmental reviews (Elmendorf and Duncheon Reference Elmendorf and Duncheon2022), shifting authority from city councils to city staff (O’Neill and Wang Reference O’Neill and Wang2023), or making certain local determinations appealable to a state board (Krefetz Reference Krefetz2001). Voters’ evaluations of the various government actors to whom approval authority can be given vary dramatically. Our experiments show that support for housing policy which confers permitting discretion on a government actor is highly conditional on affect toward the actor.
By-Right Permitting. We first revisit our earlier vignette regarding by-right permitting. In that vignette, we also randomized which group of government officials would be responsible for reviewing and approving housing permits if they were not by-right (“
$ [ $
 REVIEWING GROUP
$ ] $
 ” in the vignette): either “local government expert staff,” “local government environmental professionals,” or “local government politicians.” All three of these groups are responsible for reviewing permits in some contexts.
Figures 5a–5c show how support for by-right permitting varied by whether the alternative was review by each of the respective potential reviewing officials. Affect toward those officials is shown on the
$ x $
 -axis. In each case, support for by-right permitting is lower among those who like the reviewing group and higher among those who dislike the reviewing group (blue lines). The one exception is Figure 5c, where the pattern is insignificant, and the interaction is essentially flat; this may be because the omitted category (red line) is the average for respondents assigned to see the other groups (
$ p $
 -values for interactions
$ p<0.001 $
 ,
$ p<0.10 $
 , and
$ p=0.89 $
 , respectively) and affect toward expert staff and the other groups are correlated at approximately
$ r=0.7 $
 . See Table A8 in the Supplementary Material for full regression results.
Support for By-Right Permitting by Counterfactual Group Performing Discretionary Reviews

Figure 5. Long description
A three-panel set of line graphs. All panels share a Y-axis titled Support for By-Right Permitting on a 0 to 1 scale and an X-axis representing a feeling thermometer from 0 to 100. Each graph includes a rug plot at the bottom indicating data density.
Panel a, Local government environmental professionals. The X-axis is the feeling thermometer for this group. A red line representing All other groups remains flat at approximately 0.58. A teal line representing Local government environmental professionals shows a downward trend, starting at 0.63 and decreasing to 0.52 as the thermometer score increases.
Panel b, Local government politicians. The X-axis is the feeling thermometer for politicians. The red line for All other groups shows a slight U-shaped curve, dipping at 75 before rising. The teal line for Local government politicians shows a steady decline from 0.63 to 0.55.
Panel c, Local government staff. The X-axis is the feeling thermometer for expert staff. Both the red line for All other groups and the teal line for Local government expert staff show parallel downward trends. The red line starts at 0.59 and ends at 0.56, while the teal line starts at 0.58 and ends at 0.55.
In all panels, shaded gray areas represent confidence intervals, which generally widen at the higher end of the X-axis scale.
Third-Party Review. Some cities increase development costs by conducting slow reviews of housing permit applications (O’Neill et al. Reference O’Neill, Adury, Biber, Tan, Tepper and Wang2023). Several states have recently addressed this problem by allowing developers to use a third-party reviewer if cities do not issue permits quickly enough.Footnote 15 To test whether affect toward these third-parties shapes support for the policy, we asked
$ 12,931 $
 respondents:
In order to build new housing in a city, a developer has to submit their proposed development to the city for review.
Recently there has been debate about whether cities should be required to complete their review and either accept or reject the proposed development within a certain amount of time. Today in many cities, city officials can often take as much time as they want before completing their review.
Which of the following two statements come closer to your views—even if neither is exactly right:
-
• “If a city takes longer than 90 days to review a housing project, [GROUP] should be able to complete the review instead.”
-
• “Cities should always be able to take as much time as they want before completing the review.”
-
• Don’t know.
We again rescale the outcome to 0/0.5/1, with 1 corresponding with support for third-party permitting reviews.
We randomized which of several groups could be responsible for the reviews, including “a licensed engineer,” “a unionized engineer,” “a federal government housing agency,” and “a Biden administration housing official.”Footnote 16
Figure 6a shows that those who disapprove of Joe Biden’s performance in officeFootnote 17 are far less supportive of third-party review when it would be conducted by a “Biden administration” official rather than a “federal government housing agency” (
$ p<0.001 $
 )—even though federal government housing agencies were part of the Biden administration at the time of the survey’s administration, and notwithstanding that most voters’ disapproval of Biden likely has little to do with his housing policies.Footnote 18 This experiment is thus one of several that is less vulnerable to the critique that the effects are driven by respondents making inferences about the scenario unrelated to their affect toward the primed symbols. The two symbols we used are arguably identical.
Support for Third-Party Permit Review, by Officials Responsible for the Review

Figure 6. Long description
A two-panel figure labeled a and b.
Panel a is a dot plot titled Biden administration versus federal government housing official. The y-axis is Support for Group Doing Review on a 0 to 1 scale. The x-axis is Biden Approval with five categories: Strongly Disapprove, Somewhat Disapprove, Neither, Somewhat Approve, and Strongly Approve. Two groups are compared: Biden housing official (red dots) and Federal government housing agency (teal dots). Teal dots show consistently higher support, remaining stable around 0.65 to 0.70 across all approval levels. Red dots show a sharp linear increase in support, starting at approximately 0.41 for Strongly Disapprove and rising to 0.66 for Strongly Approve. Vertical error bars represent confidence intervals for each data point.
Panel b is a line graph titled Licensed engineer versus Unionized engineer. The y-axis is Support for Group Doing Review on a 0 to 1 scale. The x-axis is Unionized engineers feeling thermometer ranging from 0 to 100. A horizontal red line representing Licensed engineer shows constant support at approximately 0.71 with a narrow grey confidence band. A teal curve representing Unionized engineer shows a positive correlation, starting at 0.60 at the 0 mark and rising to approximately 0.75 at the 100 mark. A wide grey shaded area indicates the confidence interval for the teal curve, which narrows as the x-axis value increases. A dense black scatter of points is clustered along the bottom of the plot area.
Figure 6b shows a similar relationship with views toward unionized engineers (likely a proxy for views toward unions, since respondents likely lack specific beliefs about the competency of different classes of engineers separate from their feelings toward unions):Footnote 19 the difference in the effects of this manipulation at the top and bottom end of the scale is approximately 14 percentage points (as visible in Figure 6b, which uses a nonparametric smoother; the linear-interaction coefficient in Table A10 in the Supplementary Material similarly implies a positive top-minus-bottom gap, interaction
$ p<0.01 $
 ).
Environmental Review. In some states, environmental reviews provide politicians the opportunity to block new developments, even when their denials are motivated by non-environmental factors (Elmendorf and Duncheon Reference Elmendorf and Duncheon2022). For instance, under political pressure from neighborhood groups, San Francisco politicians famously blocked an apartment building next to a subway station through a review of the project conducted under the California Environmental Quality Act—even though neighborhood opposition to the project was not environmental.Footnote 20
One possibility for reducing neighborhood groups’ ability to pressure politicians to block development through environmental reviews is to shift responsibility for environmental reviews from elected officials to other government actors, such as environmental experts or courts, who would be more insulated from such pressure. To explore whether support for this policy would vary according to affect toward the reviewing officials, we asked
$ 12,832 $
 respondents:
Some states require cities to do an environmental study before the city decides whether to approve or deny a proposed housing development. Recently there has been a debate about whether elected city officials or someone else should determine whether the environmental study was done correctly.
Which of the following two statements come closer to your views—even if neither is exactly right:
-
• “Elected city officials should have the final say over whether an environmental study was done correctly.”
-
• “[OFFICIALS] should have the final say over whether an environmental study was done correctly.”
-
• Don’t know.
We randomized whether the officials responsible for the reviews were environmental experts, a city environmental agency, state environmental agencies, or courts.
Figure 7 shows the average support for giving each group the final say over environmental reviews instead of elected officials (on a 0/0.5/1 scale). The
$ x $
 -axis labels show the average thermometer ratings for each set of actors. There is a strong aggregate relationship between the public’s like and dislike toward each set of actors and the public’s support for giving them authority over environmental reviews instead of elected officials.Footnote 21 This ordering bears little resemblance to the ordering of which actors would likely provide the most high-quality reviews or be most susceptible to neighborhood pressure.Footnote 22 See Table A11 in the Supplementary Material for full regression results.
Environmental Review: Main Effects

Figure 7. Long description
The Y-axis is labeled Group should have the final say over environmental review 0-1 scale, with visible increments at 0.6 and 0.7. The X-axis lists four groups from left to right.
* Environmental experts Therm Mean = 57 has the highest value, positioned well above 0.7.
* City enviro. agency Therm Mean = 52 is the second highest, positioned slightly above 0.7.
* State enviro. agency Therm Mean = 52 is the third highest, positioned just below 0.7.
* Courts Therm Mean = 46 is the lowest, positioned significantly below 0.6.
Each data point is represented by a black dot with vertical error bars extending above and below the point, indicating a downward trend in support from left to right.
In summary, this set of experiments found that affect toward government agencies and officials responsible for permitting can powerfully condition views toward permitting reforms—and in ways that seemingly have little to do with the implications of these policies for development outcomes.
Residents as Symbols
In our final set of experiments, we consider how the potential residents of new housing can act as symbols which affect support for housing policies.
Tying Upzoning Triggers to Sympathetic Groups. Some state policies tie local land use rules to measures of local housing affordability or production. For example, a California law requires cities to allow large apartment buildings near college campuses if the developer reserves some of the units for lower-income students (AB 893, 2025).
Such policies provide an opportunity to tie metrics or thresholds to the experiences of groups toward whom voters have sympathetic views. To illustrate this, we asked
$ 4,485 $
 respondents the following question:
Do you agree or disagree with the following statement?
“Cities where the typical home is too expensive for [GROUP] should have to allow 5-story apartment buildings to be built along major streets and in commercial areas.”
We randomized whether the GROUP was set to “workers earning $125,000 a year,” “nurses and firefighters,” or “police officers.”
Figure 8a shows that explicitly tying broad-based upzoning to whether a sympathetic group (such as nurses and firefighters) rather than a less sympathetic group (for some respondents, police) can afford housing may affect support for the policy by raising the salience of this group.Footnote 23
Support for Upzoning, by Group

Figure 8. Long description
Panel a, titled Main effects, is a point-and-whisker plot. The y-axis represents Support for Upzoning on a 0 to 1 scale, ranging from 0.50 to 0.56. The x-axis lists three groups. From left to right: Nurses and firefighters show the highest support at approximately 0.554. Police officers show the lowest support at approximately 0.516. Workers earning $125,000 a year show support at approximately 0.550. All points include vertical error bars representing confidence intervals.
Panel b, titled Interaction: Police, is a line graph with shaded confidence ribbons. The y-axis is the same 0 to 1 scale for support. The x-axis is a Police officers feeling thermometer ranging from 0 to 100. A teal line representing Workers earning $125,000 a year shows a steady linear decrease in support as the thermometer score increases, starting near 0.57 and ending near 0.53. An orange line representing Police officers shows a slight curve, peaking around a thermometer score of 60 at approximately 0.53 before declining. A rug plot at the bottom of the x-axis indicates the density of data points, with concentrations at 0, 50, and 100.
In particular, sentiment toward the police is more mixed (therm mean
$ =67 $
 ) than sentiment toward nurses (therm mean
$ =84 $
 ) or firefighters (therm mean
$ =85 $
 ), and so tying broad-based upzoning to whether police officers can afford housing decreases support relative to income-based targeting (
$ p<0.05 $
 ) or targeting based on affordability for nurses and firefighters (
$ p<0.05 $
 ). Figure 8b shows that this may be driven by voters who dislike police, although the interaction on the difference in feeling thermometers is not statistically significant (interaction
$ p=0.21 $
 ).Footnote 24 See Table A12 in the Supplementary Material for full regression results.
Luxury Housing. Anti-development activists sometimes criticize new construction on the grounds that it is “luxury housing.” This criticism may be effective in part because it highlights the fact that wealthy people may directly benefit from the new construction, which would undermine support because wealthy people are often disliked.Footnote 25 To test this, we asked
$ 12,726 $
 respondents the following:
Do you agree or disagree with the following statement?
“Local governments should have to allow [PROJECT TYPE] to be built [PROJECT LOCATION].”
There were five response options ranging from Strongly disagree to Strongly agree, which we recoded to 0–1.
We first focus on two values of the [PROJECT TYPE] randomization: “5-story apartment buildings” and “5-story luxury apartment buildings.”Footnote 26
Figure 9 shows that affect toward people who make over $250,000 per year is powerfully associated with the effect of this manipulation: among people who feel positively toward this group, there is no effect of this manipulation; but among those with the most negative views toward this group, it reduces support by around 0.18 scale points (interaction
$ p<0.001 $
 ). See Table A13 in the Supplementary Material for full regression results. This effect is especially ironic because economic research finds that people actually prefer to live near luxury housing, as revealed by the increased prices they are willing to pay to live near it (e.g., Liang et al. Reference Liang, Lee, Lin, Yu and Yeh2020). But in the political realm, negative affect toward the wealthy appears to be an impediment to the construction of such housing.
Upzoning for Luxury Apartments

Figure 9. Long description
The X axis is labeled People who make over $250,000 per year feeling thermometer, ranging from 0 to 100. The Y axis is labeled Support for Upzoning (0-1 scale), ranging from 0.2 to 0.5. A rug plot of black data points sits along the 0.2 line of the Y axis.
Two trend lines with shaded confidence intervals are shown:
* 5-story apartment buildings (red line): Starts at approximately 0.46 support at the 0 mark, rises slightly to a peak near 0.49 at the 25 mark, dips to 0.44 at the 50 mark, and ends at 0.48 at the 100 mark. The trend is relatively stable with a slight wave.
* 5-story luxury apartment buildings (teal line): Shows a strong linear increase. It starts at approximately 0.27 support at the 0 mark and rises steadily across the graph to end at approximately 0.52 at the 100 mark.
The teal line crosses above the red line at approximately the 80 mark on the X axis. A legend at the bottom identifies the Project Type by color.
In summary, our last set of experiments finds that affect toward residents of new housing can powerfully affect views toward housing policy when it makes those residents salient.
Given the history of racialized exclusion in American housing policy, this logic may also extend to the racial background of new residents—especially views toward African-Americans, a case which helped inspire symbolic politics theory outside the context of housing (Sears, Hensler, and Speer Reference Sears, Hensler and Speer1979). Appendix D of the Supplementary Material reports a re-analysis of data from a recent paper consistent with this possibility.
EVIDENCE FOR THE MECHANISM: MANIPULATING AFFECT TOWARD DEVELOPERS
As a further test of our theory of symbolic housing politics, we next examine whether manipulating affect toward a group has downstream consequences for housing policy attitudes. In particular, in the second survey (Prolific Fall 2025 survey described above), we assigned respondents to one of several videos about a real estate developer, all but one of which were intended to improve their affect toward developers in general.Footnote 27 Our argument predicts that respondents whose affect toward developers has been exogenously increased will, in turn, have more supportive views toward policies that allow developers to build housing.
This test is important because it provides a methodologically distinct and arguably more persuasive approach to demonstrating the effects of affect toward various groups on housing policy opinions. Our previous experiments manipulated whether the survey made affect toward a group salient. As noted previously, an alternative explanation for those results is that these manipulations instead led respondents to make substantive inferences about the policy’s effects for reasons unrelated to their affect toward the primed groups (Huber and Paris Reference Huber and Paris2013). For example, respondents might dislike big real estate developers because they think developers will build larger or uglier buildings and react negatively to the developer prime for this same substantive set of reasons. Our previous studies sought to account for this by largely priming groups that we expected respondents would like or dislike for reasons unrelated to housing policy, and even about whom respondents would be able to make few housing policy-related inferences separate from their negative affect. For example, respondents who disapproved of Joe Biden reacted much more negatively to third-party permit review by a “Biden housing official” than a “federal government housing agency,” a result we think is unlikely to be explained by this specific subgroup making different inferences than other subgroups about the policy for reasons unrelated to their negative affect toward Joe Biden. Nevertheless, this still remains possible. Our video experiment manipulating affect toward developers helps sidestep these concerns (provided that the treatment does not also convey information relevant to the policy, i.e., satisfies the exclusion restriction). As far as we know, this article is the first in the symbolic politics literature to experimentally manipulate affect rather than exclusively relying on heterogeneous treatment effects or observational associations.
Survey Design
As described previously, we manipulated affect toward developers and traced the downstream implications in a survey conducted on Prolific in Fall 2025 (
$ N=16,732 $
 ). Respondents first provided consent and completed attention checks.
Respondents were then randomized to watch one of six videos: one of five treatment videos about real estate developers, described below, or a control video about an unrelated issue. After watching their assigned video, respondents either first answered our two primary outcome questions about housing policy support (support for developers building new apartment buildings in their neighborhood and support for streamlined, nondiscretionary permitting processes), or they first completed a feeling thermometer battery.Footnote 28 The feeling thermometer asked respondents to rate how warmly or coolly they felt toward several groups and objects on a 0–100 scale, including real estate developers. Feeling thermometers started at 50 by default, and so we recode any missing values to 50.
Respondents finally answered a series of questions probing their beliefs about real estate developers (e.g., whether developers are kind, corrupt, break the law, help workers retire, or face discrimination). These questions measure potential mechanisms through which the videos might affect housing policy attitudes.
Treatments
We worked with a professional videographer and a real-world real estate developer to shoot and create the videos. Table 1 summarizes the five treatment videos, and Appendix E of the Supplementary Material provides the full scripts. The videos included four pro-developer videos (focusing on developers’ personal backgrounds, the development process, sympathetic investors, and hostile neighbors they face) and one anti-developer video (describing fraud by a developer). These videos were pretested and found to successfully manipulate affect toward developers in a pilot.
Treatment Videos

Table 1. Long description
The table consists of two columns: Treatment and Summary.
* Row 1 (Header): Treatment and Summary.
* Row 2: Pro-developer: Personal background. Summary: Developer tells story of career arc and volunteer activities like mentoring and work with rescue dogs.
* Row 3: Pro-developer: Sympathetic investors. Summary: Developer explains that pension funds and life insurance companies invest in her projects and that if the project is successful, the winners are retired teachers, firefighters, nurses, and other workers.
* Row 4: Pro-developer: Hostile neighbors. Summary: Developer recounts being yelled at and threatened during and after a public meeting on a project.
* Row 5: Pro-developer: Explains development process. Summary: Developer explains mechanics of development process, from acquiring land to obtaining approvals to delivering the finished product.
* Row 6: Anti-developer: Fraud. Summary: Television news story about a developer charged with wirefraud and tax fraud. Footage shows courthouse and, briefly, a condo building.
Note: See Appendix E of the Supplementary Material for full video scripts.
A key assumption of this design is that the videos do not affect development policy preferences for reasons other than their effects on affect toward developers (i.e., violations of the exclusion restriction). We took two steps to help rule out this alternative explanation. First, the “Personal Background” video says essentially nothing about housing development at all and focuses on the developer’s personal private life, such as her work with rescue dogs. This makes it unlikely that this video could affect housing policy attitudes for any other reasons. For the same reason, the remaining three videos were also scripted and shot to minimize referencing policy considerations or images of housing projects, although as we discuss below they do touch on aspects of the policy process that could have influenced one of our dependent variables. Second, we used not one but four different pro-developer videos. Just as alternative explanations seem less likely for our results in the first section of the article because we find consistent results across so many different experiments, finding consistent results across multiple conceptually distinct approaches to manipulating affect toward developers also can bolster our confidence regarding the role of affect toward developers in our results.
We also included a news clip about a developer charged with fraud to test the effects of priming respondents with common anti-developer stereotypes. Concerns about corruption are a potential source of anti-developer sentiment, and so we were interested in whether priming these concerns would reduce support for development. We note, though, that this video does not provide as clean a test of the affect mechanism, as it mentions plausibly policy-relevant reasons to restrain developers.
Results
Figure 10 shows the results. To facilitate interpretation, we rescale each outcome to range from 0 to 1. The first panel shows that all four pro-developer videos successfully increased affect toward developers as measured by the feeling thermometer, with an average effect of around 11 feeling thermometer degrees (0.11 scale points when rescaled from 0 to 1). Relative to the standard deviation of the developer feeling thermometer in this dataset of 22 degrees, this is a meaningful effect size (
$ d\approx 0.5 $
 standard deviations). Interestingly, the anti-developer video did not decrease affect toward developers, perhaps because it primed common anti-developer stereotypes that respondents were already aware of. These results are significant on their own, as they suggest that depictions of developers in media—even depictions that have little to do with housing (such as our Personal Background video)—can powerfully influence people’s views toward developers. In Appendix C of the Supplementary Material, we show that negative depictions of developers are reasonably common in movies; our results in this section suggest that such depictions could contribute to people’s negative views toward developers.
Main Effects of Video Treatments
Note: 95% confidence intervals surround point estimates. Estimates show estimated effects of each treatment on the dependent variable shown at the top of each panel. See Table A14 in the Supplementary Material for full regression results.

Figure 10. Long description
A multi-panel dot plot with 95 percent confidence intervals. The y-axis lists five treatments from top to bottom: Pro-Developer Personal Background, Pro-Developer Sympathetic Investors, Pro-Developer Hostile Neighbors, Pro-Developer Explains Development Process, and Anti-Developer Fraud. The x-axis represents the Treatment Effect Estimate on a 0 to 1 scale, ranging from minus 0.05 to 0.10, with a dashed vertical line at 0.00 indicating no effect.
Panel 1: Real Estate Developer Feeling Thermometer. All four Pro-Developer treatments show positive effects between 0.09 and 0.13. The Anti-Developer Fraud treatment shows a negligible effect near 0.00.
Panel 2: Support for Developer-Built New Apartment Buildings in Your Neighborhood. All Pro-Developer treatments show positive effects between 0.02 and 0.05. The Anti-Developer Fraud treatment shows a negative effect at approximately minus 0.03.
Panel 3: Support for Non-Discretionary Permitting for Developers. The Personal Background and Explains Development Process treatments show small positive effects. Sympathetic Investors is near 0.00. Hostile Neighbors and Anti-Developer Fraud show negative effects between minus 0.03 and minus 0.05.
More importantly, Figure 10’s second panel shows the downstream effects of each video on support for “allowing developers to build new apartment buildings in your neighborhood.” Despite relying on quite distinct approaches to improve affect toward developers, all four pro-developer videos increased support for allowing developers to build new apartment buildings in the respondent’s neighborhood. The typical effect size was around 0.03 scale points.Footnote 29 This effect size is consistent with what would be expected were the observational relationship between affect toward developers and support for this policy entirely causal.Footnote 30 As expected, we also found that the video priming anti-developer stereotypes reduced support for the policy.
The third panel shows the effects on supporting nondiscretionary permitting for developers. The results in this case are mostly supportive, although more mixed. The video that purely focuses on the developer’s personal background had the expected effect of increasing support, and our best guess is that the video that explained the development process did so as well, although this result is not significant. The one unexpected result is that “Hostile Neighbors” video actually decreased support for nondiscretionary permitting, perhaps because the video implied that it is normal for developers to need to persuade the local community to support a proposed housing project. The “Sympathetic Investors” video had an estimated null effect, although the standard errors are large enough that we cannot distinguish its effects from the other videos. The anti-developer video had the anticipated negative effects.
Figure 11 shows estimated effects on potential mechanisms. Interestingly, all four pro-developer videos led respondents to see developers as less corrupt and less likely to break the law, even though the videos scarcely touched on this topic. Likewise, the pro-developer videos also all led respondents to see developers as “kind people who want to help others.” The relatively uniform results across these potential mechanisms is broadly consistent with our favored interpretation that the videos broadly increased affect toward developers (and, as a consequence, endorsement of various positive statements about developers), rather than primarily informing respondents about policy-relevant aspects of the development process or typical developer behavior. For example, the fact that the video which explains the development process has similar effects on perceptions of corruption and law-following as videos which make no mention of this process are consistent with all the pro-developer videos affecting such perceptions largely through affect. Such results bolster our confidence in the exclusion restriction assumption necessary for interpreting the effects of the videos as resulting from their manipulation of affect, although we cannot prove this assumption definitively.Footnote 31 These results are also consistent with beliefs about the behavior of various actors in housing politics (e.g., developers) being at least partially downstream of affect toward those symbols.
Effects of Video Treatments on Potential Mechanisms
Note: 95% confidence intervals surround point estimates. Estimates show estimated effects of each treatment on the dependent variable shown at the top of each panel. See Table A14 in the Supplementary Material for full regression results.

Figure 11. Long description
The multi-panel plot consists of five panels arranged in two rows. The Y-axis for all panels lists five treatments: Pro-Developer: Personal Background, Pro-Developer: Sympathetic Investors, Pro-Developer: Hostile Neighbors, Pro-Developer: Explains Development Process, and Anti-Developer: Fraud. The X-axis represents the Treatment Effect Estimate on a 0 to 1 scale, ranging from minus 0.10 to 0.15, with a dashed vertical line at 0.00 indicating no effect. Data points are shown as black circles (No pre-registered primary hypothesis) or red triangles (Yes pre-registered primary hypothesis) with horizontal error bars representing 95 percent confidence intervals.
* Top-Left Panel (Real estate developers are corrupt): All Pro-Developer treatments show negative effects between minus 0.10 and minus 0.05. The Anti-Developer: Fraud treatment (red triangle) is near 0.00.
* Top-Middle Panel (Real estate developers are kind people who want to help others): Pro-Developer: Personal Background (red triangle) shows a strong positive effect near 0.13. Other Pro-Developer treatments show positive effects between 0.05 and 0.10. Anti-Developer: Fraud is near 0.00.
* Top-Right Panel (Real estate developers face too much discrimination): Pro-Developer: Hostile Neighbors (red triangle) shows the strongest positive effect at approximately 0.13. Other Pro-Developer treatments are positive between 0.04 and 0.06. Anti-Developer: Fraud is slightly negative.
* Bottom-Left Panel (Real estate developers often break the law): All Pro-Developer treatments show negative effects between minus 0.10 and minus 0.07. Anti-Developer: Fraud (red triangle) shows a positive effect near 0.03.
* Bottom-Middle Panel (Real estate development helps firefighters/nurses have a secure retirement): Pro-Developer: Sympathetic Investors (red triangle) shows a strong positive effect near 0.13. Other Pro-Developer treatments show smaller positive effects between 0.02 and 0.04. Anti-Developer: Fraud is near 0.00.
In summary, the results in this section provide further evidence for our theoretical account of symbolic housing politics.
COMPARING SYMBOLIC POLITICS TO ALTERNATIVE THEORIES
Homeowner self-interest and NIMBYism theories, while clearly having some merit, struggle to explain some of the patterns in our data. Table 2 shows the differences between homeowners and renters on the policies we examined in our salience manipulations.
Means of Outcomes from Salience Manipulation Experiments, by Homeowner Status

Table 2. Long description
The table contains seven rows of data across four columns.
1. Support for new apartments in neighborhood: Homeowners 0.43, Non-homeowners 0.59, Difference minus 0.15.
2. Support for streamlining permits: Homeowners 0.54, Non-homeowners 0.60, Difference minus 0.05.
3. Support for allowing apartment demolitions for redevelopment: Homeowners 0.50, Non-homeowners 0.36, Difference 0.14.
4. Support for third-party reviewers: Homeowners 0.66, Non-homeowners 0.71, Difference minus 0.05.
5. Support for non-political environmental review: Homeowners 0.67, Non-homeowners 0.69, Difference minus 0.02.
6. Support for targeted upzoning: Homeowners 0.54, Non-homeowners 0.55, Difference minus 0.01.
7. Support for upzoning: Homeowners 0.46, Non-homeowners 0.52, Difference minus 0.06.
Note: Every row refers to the outcome used in one of the salience manipulation experiments. The first two columns show the mean of the outcome among homeowners and non-homeowners, respectively. The last column computes the difference.
First, consistent with predictions from homeowner self-interest theories, we find that homeowners are generally less supportive of new development policies than non-homeowners. For example, non-homeowners are six scale points more supportive of upzoning than homeowners. Second, however, many of these differences between homeowners and non-homeowners are relatively small. For example, homeowners were only 5 percentage points less likely to support third-party permit reviews than non-homeowners. By contrast, we reported earlier that those who strongly disapproved of Joe Biden were over 20 percentage points less likely to favor allowing federal third-party permit review when the approver was described as a “Biden housing official” instead of a “federal government housing agency.” Third, NIMBYism, while plausible as an account of local resistance to specific proposed developments, offers less insight into how voters think about broadly applicable policies whose effects on any given neighborhood are hard for ordinary people to predict. These broadly applicable policies are increasingly the only housing policies that matter in the growing number of states that have curtailed local discretionary review of housing development. We note that one cannot draw causal conclusions about the effects of homeownership from these descriptive differences because homeowners and renters may differ in other ways that influence support for housing construction—for example, renters may be more likely to be people who have a taste for density and chose to live in a dense area where more of the housing stock is rental stock (e.g., Broockman, Elmendorf, and Kalla Reference Broockman, Elmendorf and KallaForthcoming).
DISCUSSION
The United States faces an acute housing shortage, which contributes to the rising cost of living that frustrates so many voters. The roots of this shortage lie in government policies which make it difficult to build new housing (Glaeser and Gyourko Reference Glaeser and Gyourko2018). The negative impacts of this shortage on economic mobility, racial segregation, and housing costs have inspired a burgeoning literature on why so many voters oppose new development. This literature largely stresses two explanations for anti-development sentiment: homeowners’ economic self-interest and NIMBYism. This article offers an additional, complementary explanation for anti-development sentiment: symbolic politics. In short, our theory is that voters often do not judge housing policies by weighing the costs and benefits to them personally or the impacts the policy would have on their neighborhoods, but rather by relying on their affect toward the groups these policies make salient. People’s views toward many of these groups—such as Wall Street investors, specific U.S. Presidents, or one’s local government representatives—may trace their origins in large part to issues beyond housing. Even attitudes toward real estate developers could be influenced by popular media rather than the substance of housing policy (see Appendix C of the Supplementary Material). But when elites design policies or deploy rhetoric that makes such groups salient, it influences how voters view those housing policies.
We demonstrated this theory through a variety of experimental tests. A recurring pattern is that affect toward groups involved in the housing development process—such as the developers and investors who propose and finance new housing, the government actors who approve it, and the new residents who live in it—can powerfully affect attitudes toward housing policy when those policies make these symbols salient.
While it is difficult to directly compare the importance of affect and substance to informing voters’ housing policy attitudes, the effects of affect toward symbols appeared meaningful and not epiphenomenal to housing policy substance in our studies. First, our experiment manipulating affect toward developers through videos found that a substance-free video about a developer’s personal background increased support for allowing them to build apartments in one’s neighborhood. Notably, this effect size was consistent with what would be expected were the observational relationship between affect toward developers and support for this policy entirely causal, suggesting that affect toward developers is not a mere proxy for substantive policy preferences. Moreover, this experiment found that respondents’ substantive beliefs were in part a consequence of their affect, as even the “Personal Background” video changed beliefs about developer behavior more generally (e.g., that they follow the law; see Figure 11). Second, as elaborated in Appendix B of the Supplementary Material, providing a great deal of substance about a streamlining policy barely reduced respondents’ reliance on their affect toward developers when judging the policy, or how often they mentioned their views toward developers in open-ended responses when describing their own reasoning process. These results suggest that policymakers may not be able to mitigate the effects of voters’ feelings toward participants in the housing-development process by putting tight substantive bounds on the types of housing that would be allowed under a proposed reform. Even in a controlled experiment with a captive audience, where the details of a policy can be communicated to voters much more easily than in the real world, providing policy details barely attenuated the treatment effect of “big real estate developers” (vs. “small local homebuilders”) on support for nondiscretionary permitting. See Appendix B of the Supplementary Material for additional discussion. While these results are merely suggestive, they point toward the potentially surprising power of symbolic affect relative to substantive considerations in some of our studies.
Yet both affect and substantive concerns are not necessarily fixed in the real world. First, our video experiment results suggest that affect toward participants in the development process is not fixed—for example, political entrepreneurs may be able to improve voters’ feelings about developers and support for “pro-developer” policies without substantively changing what developers build or how they build it. A substance-free video about a developer’s personal background, a video about the nuts and bolts of the development process, and a video about sympathetic housing investors all similarly increased warmth toward developers and support for allowing them to build apartments in one’s neighborhood. Substance can also matter to voters, of course, and their views on substance may likewise not be fixed. For example, other evidence shows that helping voters understand how supply and demand works in housing markets can shift their housing policy preferences (Elmendorf, Nall, and Oklobdzija Reference Elmendorf, Nall and Oklobdzija2024a).
Our research has several important limitations. First, with respect to external validity, it is possible that competitive elections or referenda campaigns may blunt the impact of certain symbolic predispositions as opposing campaigns each seek to associate their side with sympathetic symbols and the opposite side with disliked symbols (Druckman Reference Druckman2004). For example, a competitive campaign environment might eventually tie almost any pro-development policy to (on average) disliked symbols like “developers” and “investors,” even if the policy originally primed different symbolic associations. Self-interest or NIMBYism might also come to matter more in such a context if the implications of these policies for voters’ self-interest or neighborhoods were better explained to them. We would welcome further research investigating these questions. However, it is also worth bearing in mind that housing plays only a minor role in many election campaigns, and that voters’ reaction to policies when they have little information about them is also relevant for understanding politicians’ incentives, as well as referenda results.
Second, in our salience manipulation experiments, it is possible that the unmeasured dispositions that correlate with the feeling thermometer ratings, in conjunction with inferences respondents made from our manipulations (Huber and Paris Reference Huber and Paris2013), may be responsible for some of the effects we found. We sought to address this concern in two ways. First, we conducted a broad range of tests which rely on a wide variety of symbolic predispositions which themselves are not highly correlated. While we find it reassuring that our theory found support in a large range of tests, we note that this is a limitation of our findings. Second, our experiment manipulating affect toward developers also helps address this concern and represents the first demonstration in the symbolic politics literature we are aware of that manipulating affect toward a symbol has downstream policy consequences. This experiment, too, has caveats; the treatments could have affected policy support through beliefs or attitudes that we did not measure, particularly the treatments beyond the “Personal Background” treatment. However, as we discuss, we find the clear results of the “Personal Background” treatment reassuring.
These limitations notwithstanding, our findings have several broader implications. First, our findings suggest a potentially wide latitude for political elites to strategically design and frame both pro- and anti-development policies in a manner that affects public support—what Sears (Reference Sears, Iyengar and McGuire1993, 145) called “controlling the public agenda
$ \dots $
 in order to control the symbolic meaning of an attitude object.” Sears also warned that “manipulation should be easier on issues
$ \dots $
 that lack consensual or manifest symbolism.” Voters appear to currently have a limited understanding of housing policy (Elmendorf, Nall, and Oklobdzija Reference Elmendorf, Nall and Oklobdzija2025), suggesting elites should currently enjoy a broad latitude for controlling the symbolic meaning of their policies. However, when housing policies become more salient, the symbolic meaning of these policies may become more difficult to alter. It is also possible that, insofar as groups such as “investors” and “developers” are inevitably associated with pro-development policies, the future success of the “YIMBY” movement may depend on seemingly unrelated policies which burnish these symbols in the public’s imagination (e.g., reducing corruption in permitting with respect to developers).
Second, the ability of housing policies to be framed—for now—around a wide variety of symbols may account for the fact that legislative coalitions supporting or opposing housing policies are often bipartisan within states or involve different parties in support or opposition across states.Footnote 32 For example, in Montana, advocates framed single-family zoning as “California zoning”Footnote 33 and successfully won Republican support for repealing it in broad swaths of the state. In California, however, similar reforms are framed as repealing laws with “racist roots.”Footnote 34 Our article is not the first to note that advocates use frames to build support for policies; what we wish to point out is that, precisely because housing policies are so novel, complex, and lacking in partisan cues for voters—and because housing policy is so rich with potential symbols—elites may enjoy unusual success in deploying such symbols in this domain.
Finally, our results resonate with other findings that many voters lack internally consistent, firm views on many housing policies (e.g., Elmendorf, Nall, and Oklobdzija Reference Elmendorf, Nall and Oklobdzija2024b; Reference Elmendorf, Nall and Oklobdzija2025). This is no indictment of voters, nor is it any surprise (Bartels Reference Bartels, MacKuen and Rabinowitz2003): voters have little incentive to form such views, and making housing policy is not typically their responsibility. However, state and local laws often encourage government officials to seek detailed community input about potential changes to housing policies, premised on the notion that voters have firm views on housing policy that officials could learn and take into account (Been and Lemar Reference Been and Lemar2023). Our findings suggest caution about policies that venerate public opinion about housing in this way: it is unclear that many voters have meaningful views to express, and how questions are presented to voters may radically alter the input they provide. For example, are voters’ views about allowing new apartment buildings more “genuine” before or after they’ve been reminded that developers build them? Or before or after they’ve been reminded that nurses and firefighters might live there?
Our findings also suggest several potential directions for future research. Most importantly, an earlier generation of research on symbolic politics found that self-interest can be more consequential for decisions about whether to take action in opposition to a policy, such as attending a protest (Green and Cowden Reference Green and Cowden1992). This could explain how meaningful levels of public support for pro-development policy (Horowitz and Kansal Reference Horowitz and Kansal2023) coexist with sometimes-overwhelming opposition to specific developments from neighbors (Einstein, Glick, and Palmer Reference Einstein, Glick and Palmer2019). This does not mean that voters’ policy attitudes are politically irrelevant: how voters react to information about politicians’ positions on housing issues or how they vote in referenda is also important for political outcomes. However, understanding when pro-development attitudes translate into action—which they sometimes do (Sahn Reference Sahn2025)—and when anti-development activism will overwhelm them is a clear priority for future research. Additional research could also further investigate the sources of symbolic attitudes, as well as whether symbolic politics explains attitudes on other policy domains, such as trade, where the role of self-interest is frequently debated (e.g., Mansfield and Mutz Reference Mansfield and Mutz2009; Rho and Tomz Reference Rho and Tomz2017). Finally, while our results are consistent with affect salience being a mechanism for the effects of the primes we studied, further research could investigate the mechanism for this mechanism (Bullock, Green, and Ha Reference Bullock, Green and Ha2010). For example, to what extent do people use affect as a heuristic, consistent with Sears’s (Reference Sears, Iyengar and McGuire1993) expectations, or to what extent are the effects of affect mediated by other cognitive processes such as post-hoc generation of beliefs, motivated reasoning, etc.?Footnote 35
We close by reflecting on the unfortunate nature of the patterns we uncovered. Were government policies that restrict housing development relaxed or repealed, a large number of Americans would meaningfully benefit (Glaeser and Gyourko Reference Glaeser and Gyourko2018). Why, then, do so many of these policies persist? Explanations that center greedy homeowners or selfish neighbors suggest there are clear villains on whom to pin blame for America’s housing crisis. Our results suggest a more unfortunate possibility—that some of the same voters who would benefit from addressing the housing crisis inadvertently perpetuate it (Elmendorf, Nall, and Oklobdzija Reference Elmendorf, Nall and Oklobdzija2025). They do so in part, we argue, because they oppose policies that they see as benefiting or empowering groups they dislike, be it developers, investors, certain politicians, or the wealthy. But these and other actors are key players in addressing the housing crisis, and policies that allow them to build housing would often benefit voters more generally, too. Ironically, then, voter dislike of the very actors who could ameliorate the housing shortage they suffer from may exacerbate it.
SUPPLEMENTARY MATERIAL
To view supplementary material for this article, please visit https://doi.org/10.1017/S0003055426102019.
DATA AVAILABILITY STATEMENT
Research documentation and data that support the findings of this study are openly available at the American Political Science Review Dataverse: https://doi.org/10.7910/DVN/WARHEN.
ACKNOWLEDGEMENTS
This research was deemed exempt by the University of California, Berkeley Committee for the Protection of Human Subjects and the Yale University Human Subjects Committee. We thank Danielle Hogan for excellent research assistance and David Burgis and Megan Lutz for their work on the videos. We thank Stephanie Ternullo, Stan Oklobdzija, Shane Phillips, Rafaela Dancygier, Michael Manville, Michael Hankinson, Martin Vinaes Larsen, Laura Stoker, Noah Kazis, Katie Einstein, Justin de Benedictis-Kessner, Jessica Trounstine, Jack Citrin, Hanno Hilbig, Greg Huber, Gabriel Lenz, Evan Mast, Eric Schickler, Eric Biber, Don Green, David Schleicher, Anna Weissman, Alexander Sahn, and seminar participants at the Copenhagen Politics of Housing Policy Workshop, the Association for Public Policy Analysis and Management, and UC Berkeley for helpful comments. All remaining errors are our own.
FUNDING STATEMENT
This research was funded by Arnold Ventures (Grant No. 24-11837).
CONFLICT OF INTEREST
The authors declare no ethical issues or conflicts of interest in this research.
ETHICAL STANDARDS
The human-subjects research in this article was reviewed and deemed exempt by the University of California, Berkeley Committee for the Protection of Human Subjects (Protocol No. 2022-11-15840) and the Yale University Human Subjects Committee (Protocol No. 2000036140). The authors affirm that this article adheres to the principles concerning research with human participants laid out in APSA’s Principles and Guidance on Human Subject Research (2020).


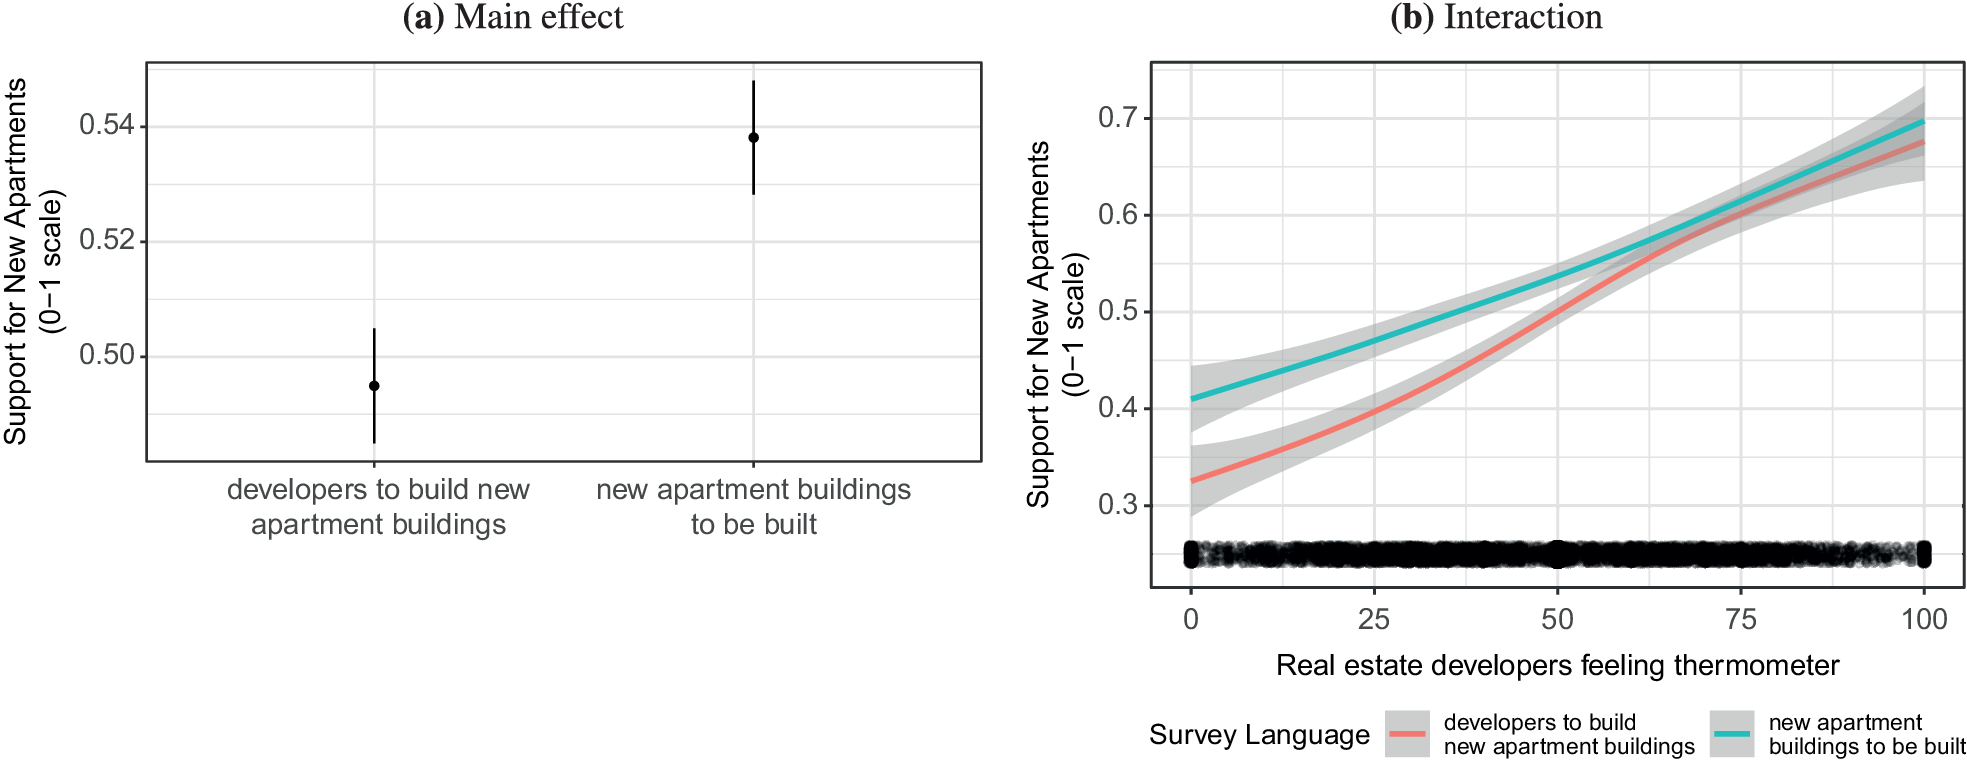
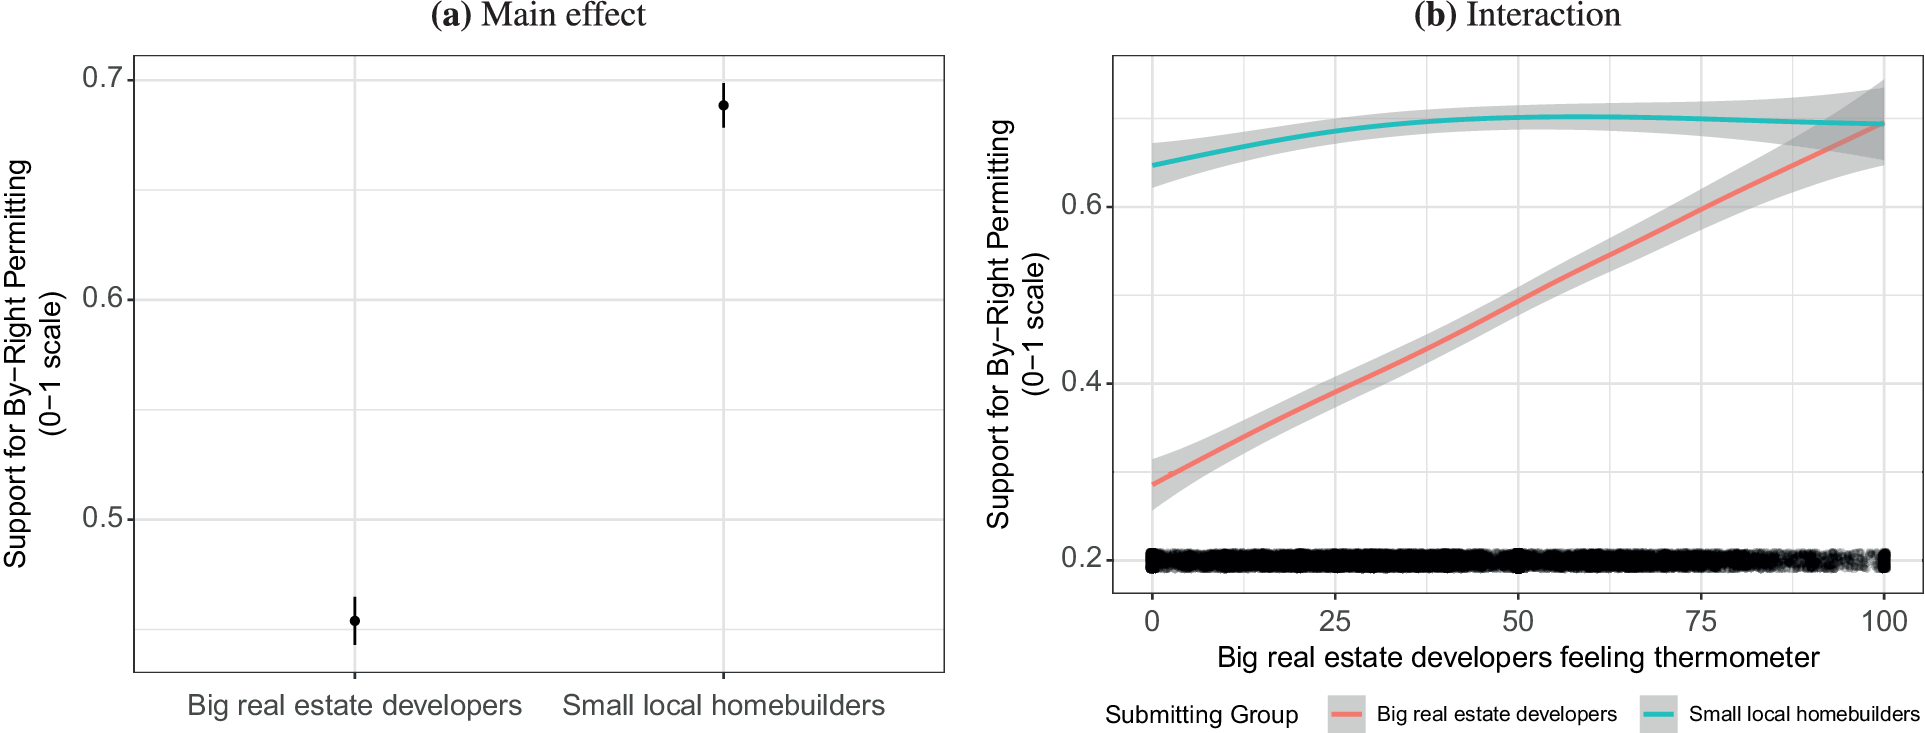
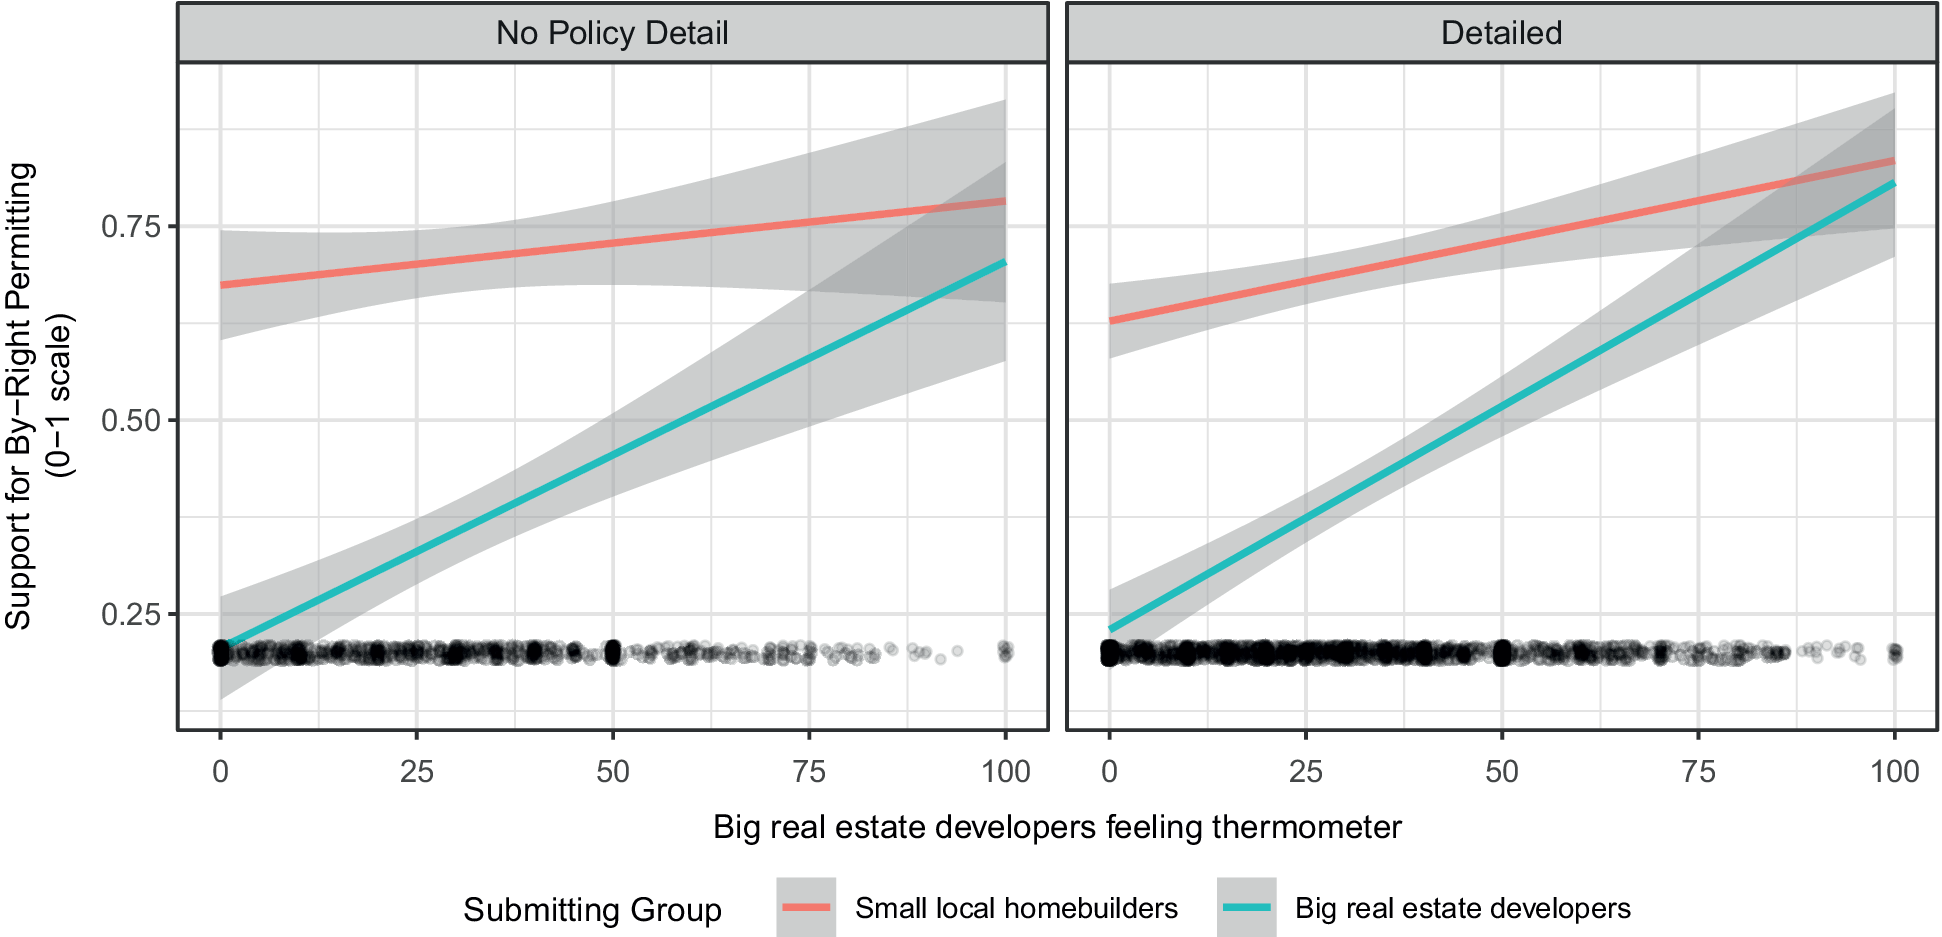
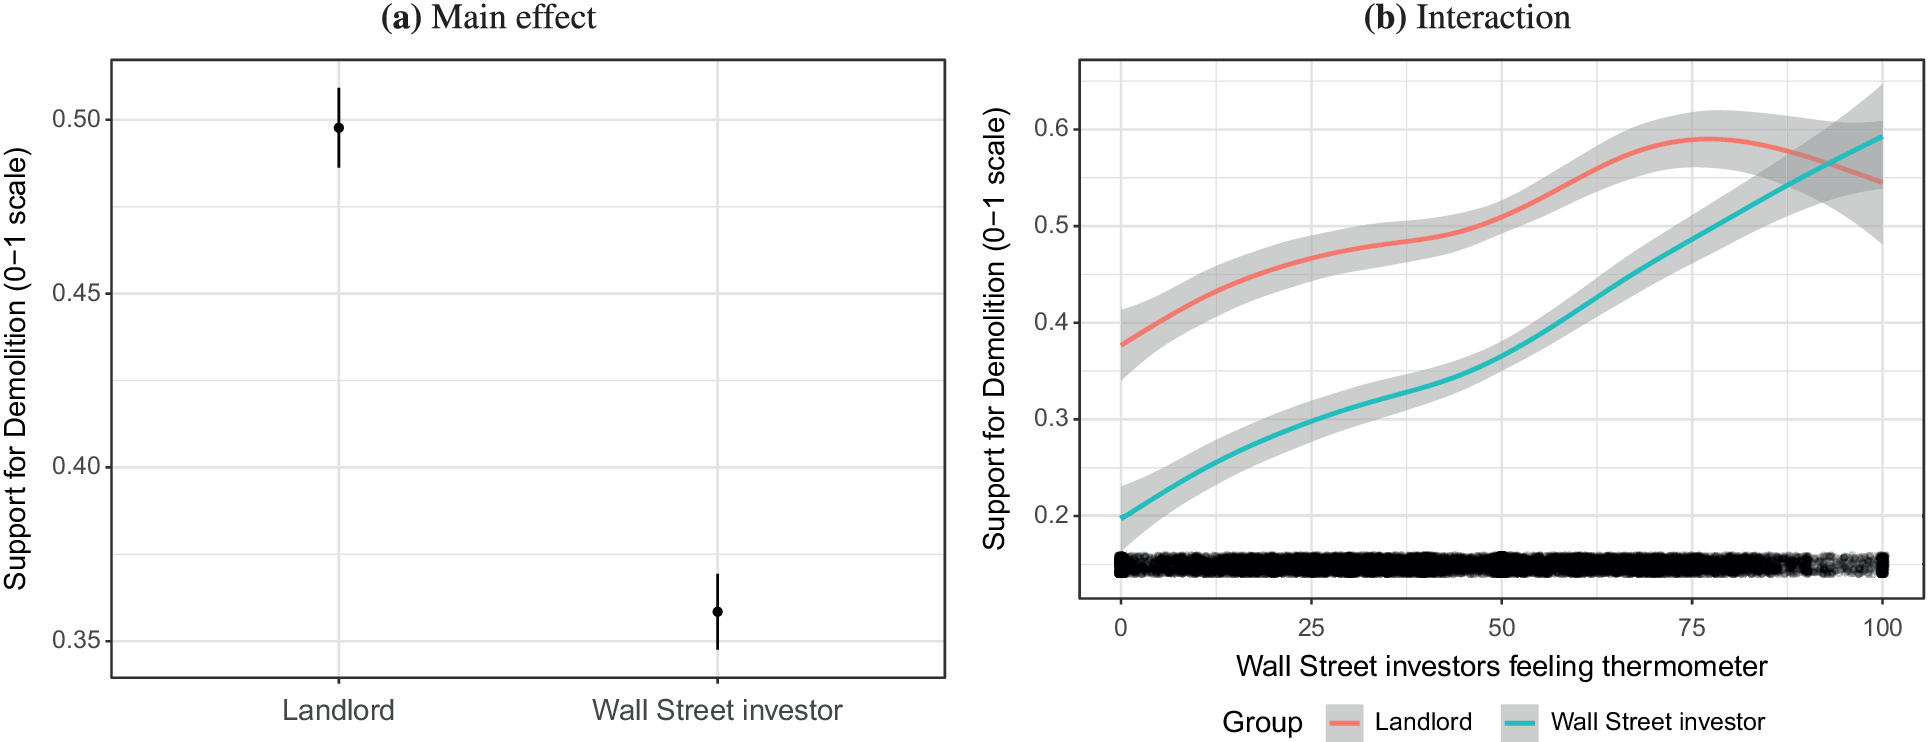

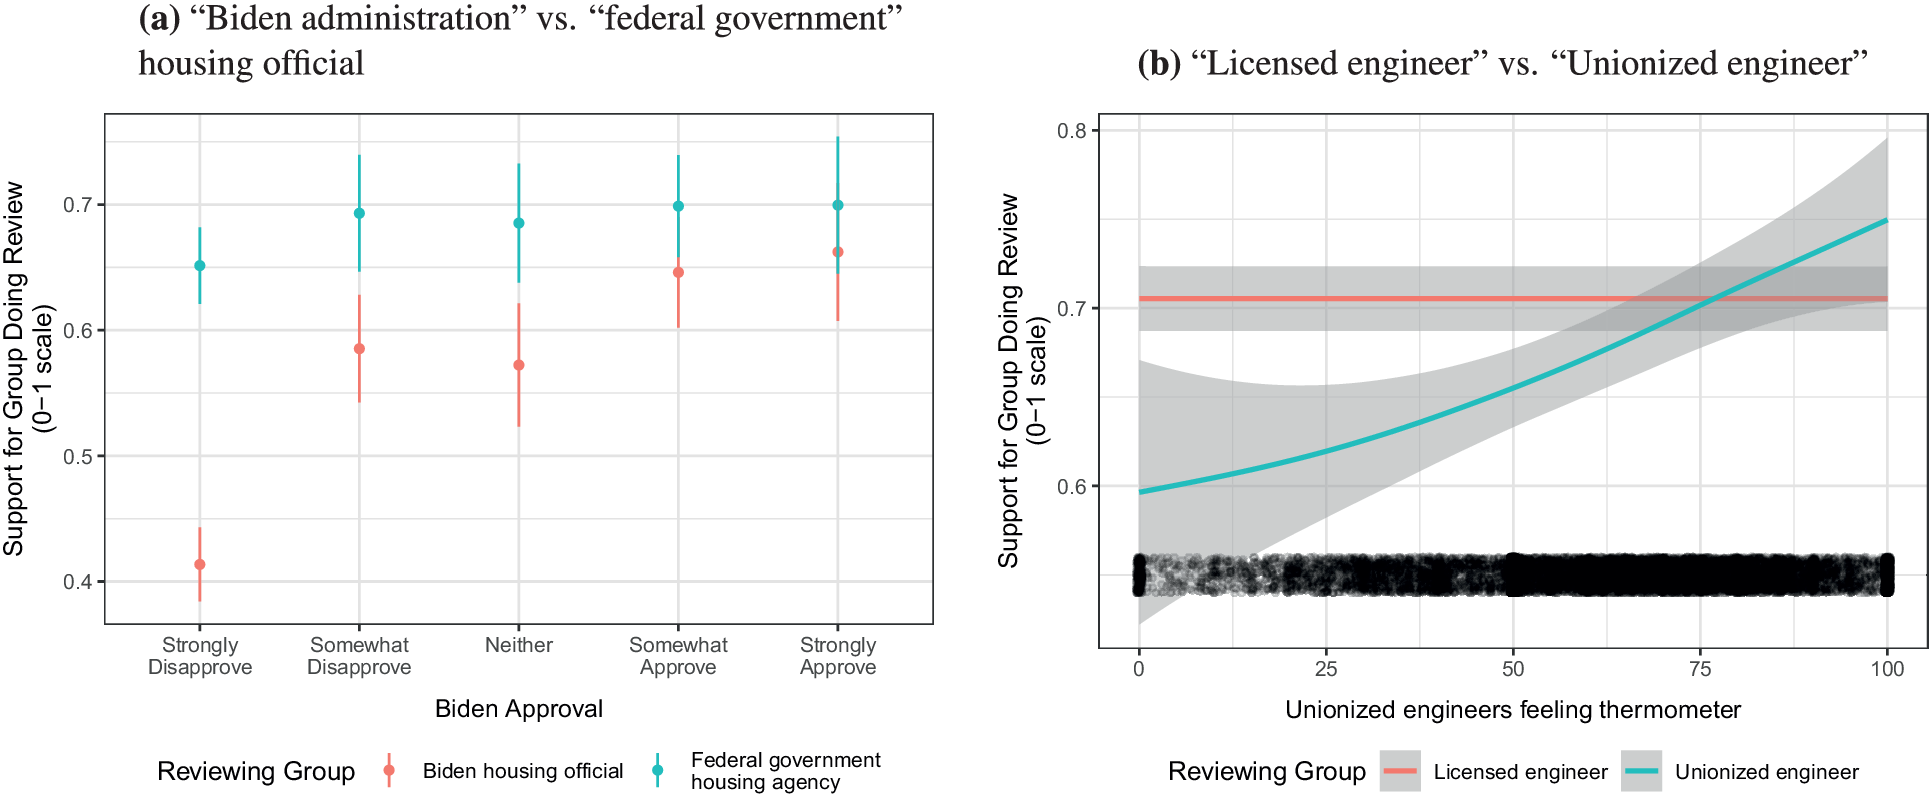
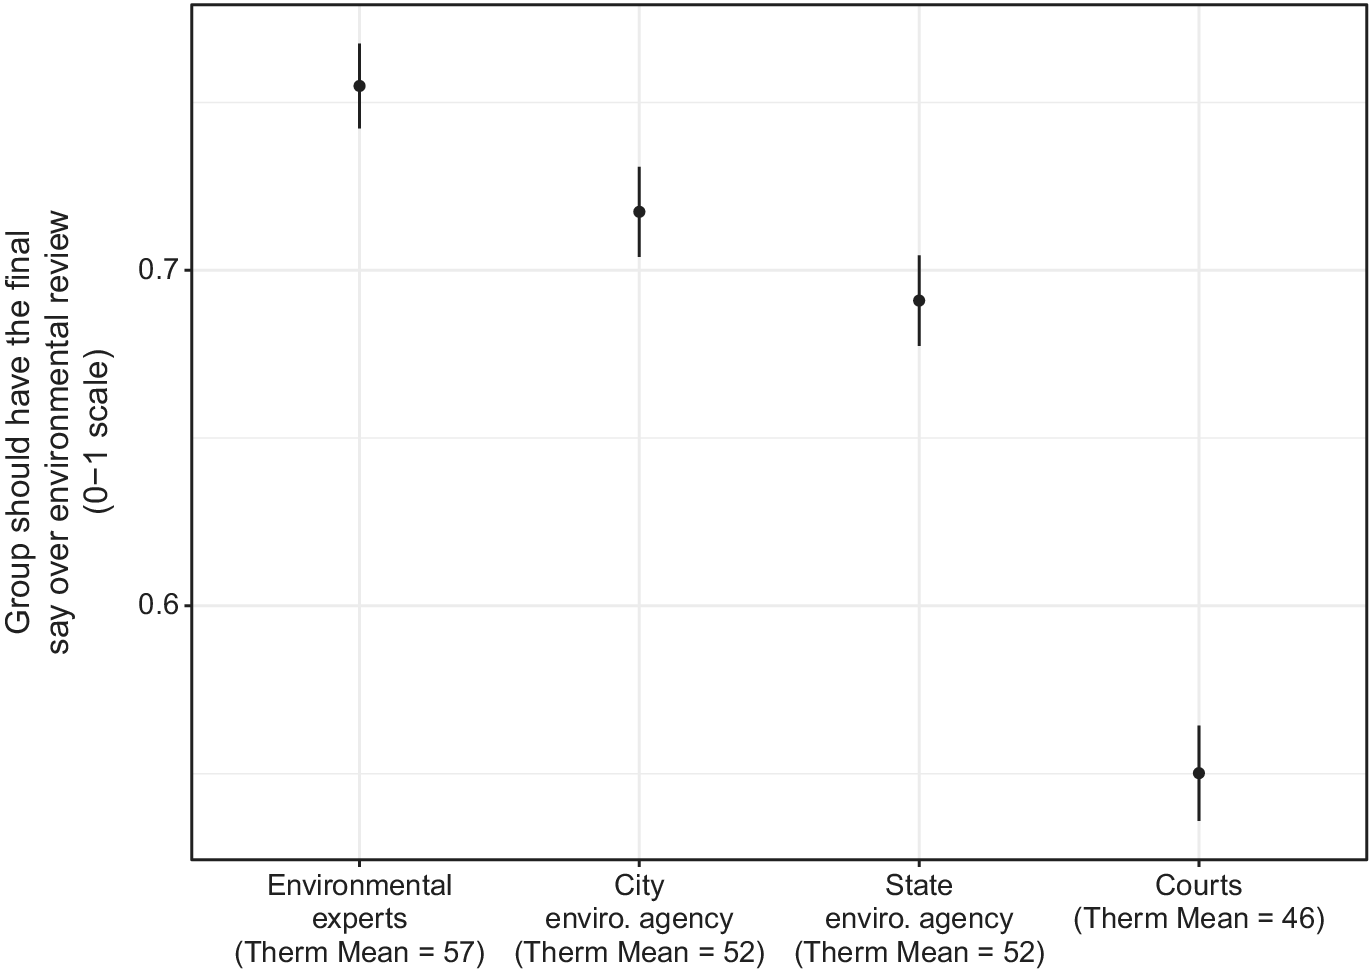
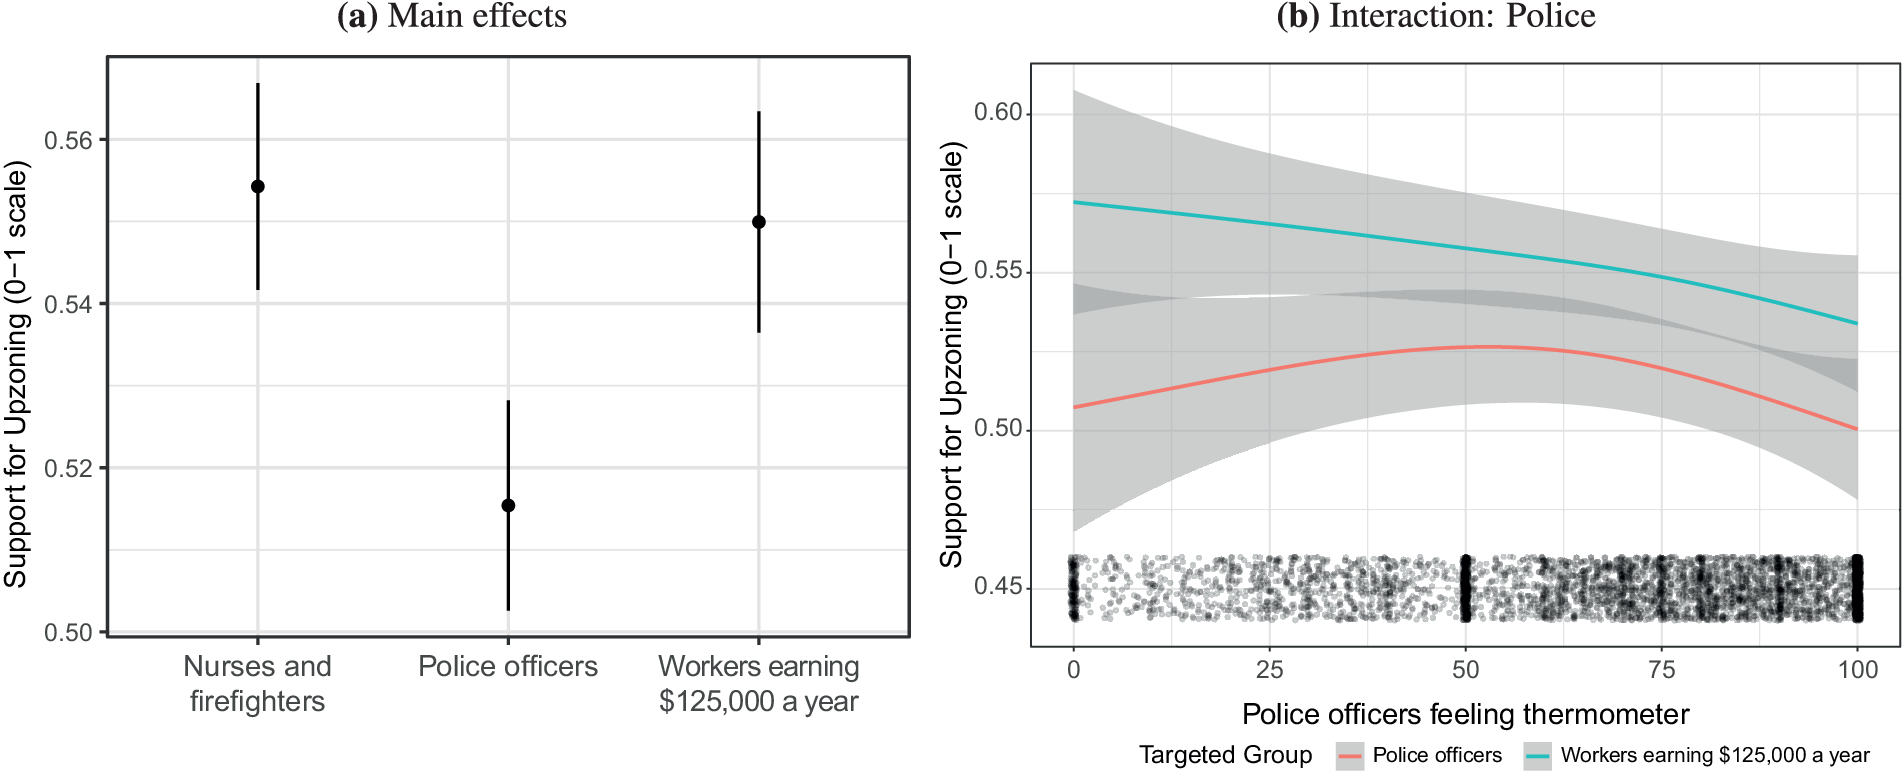
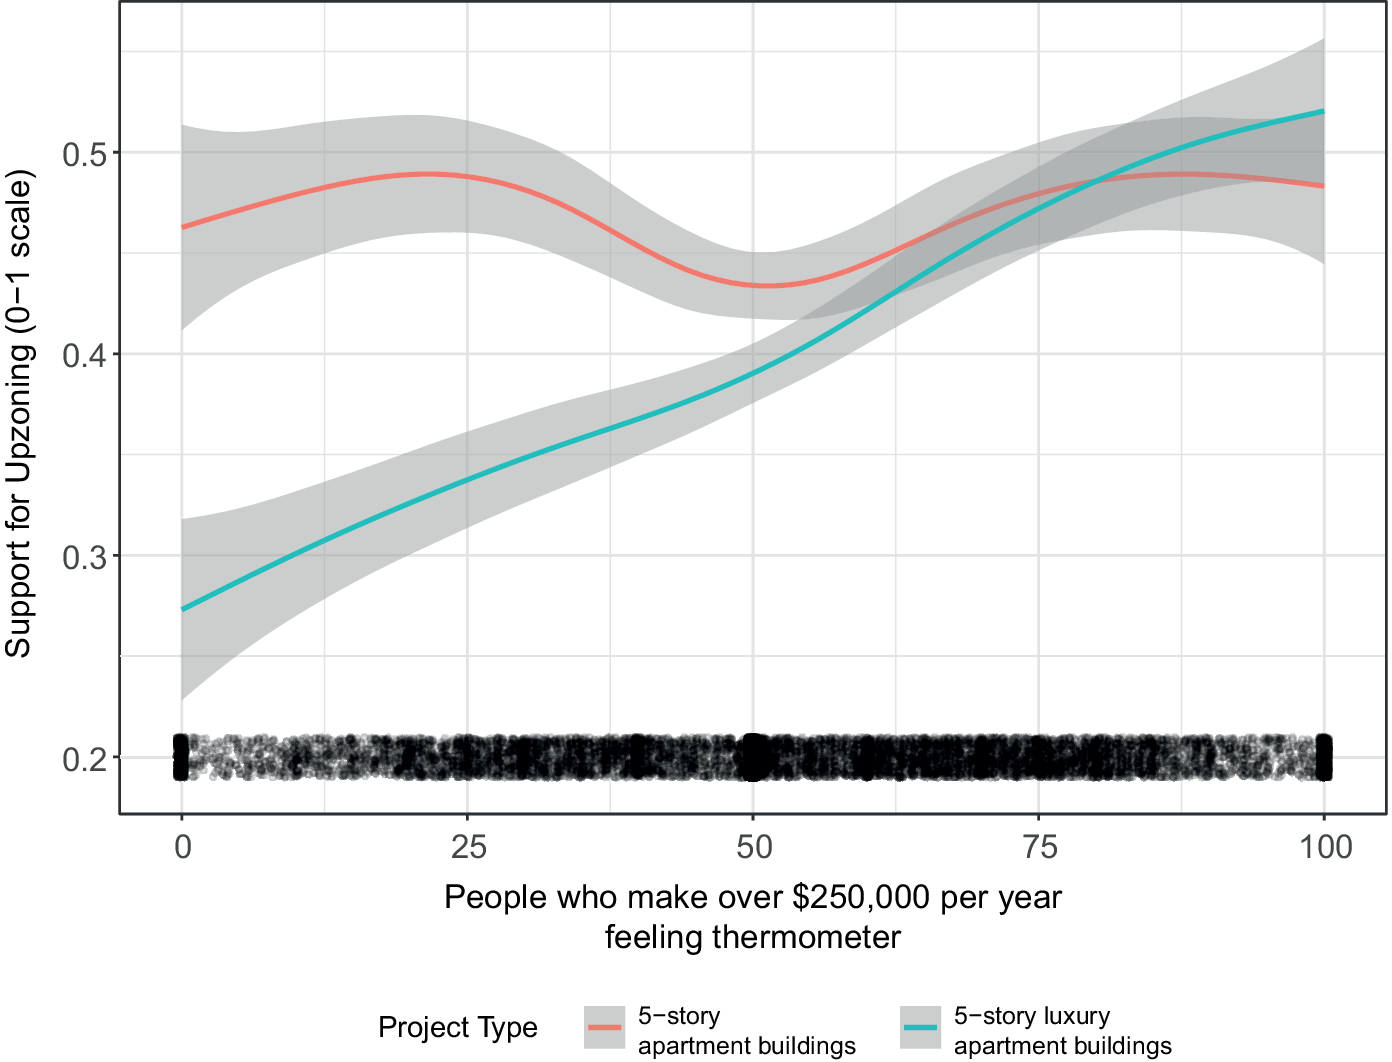

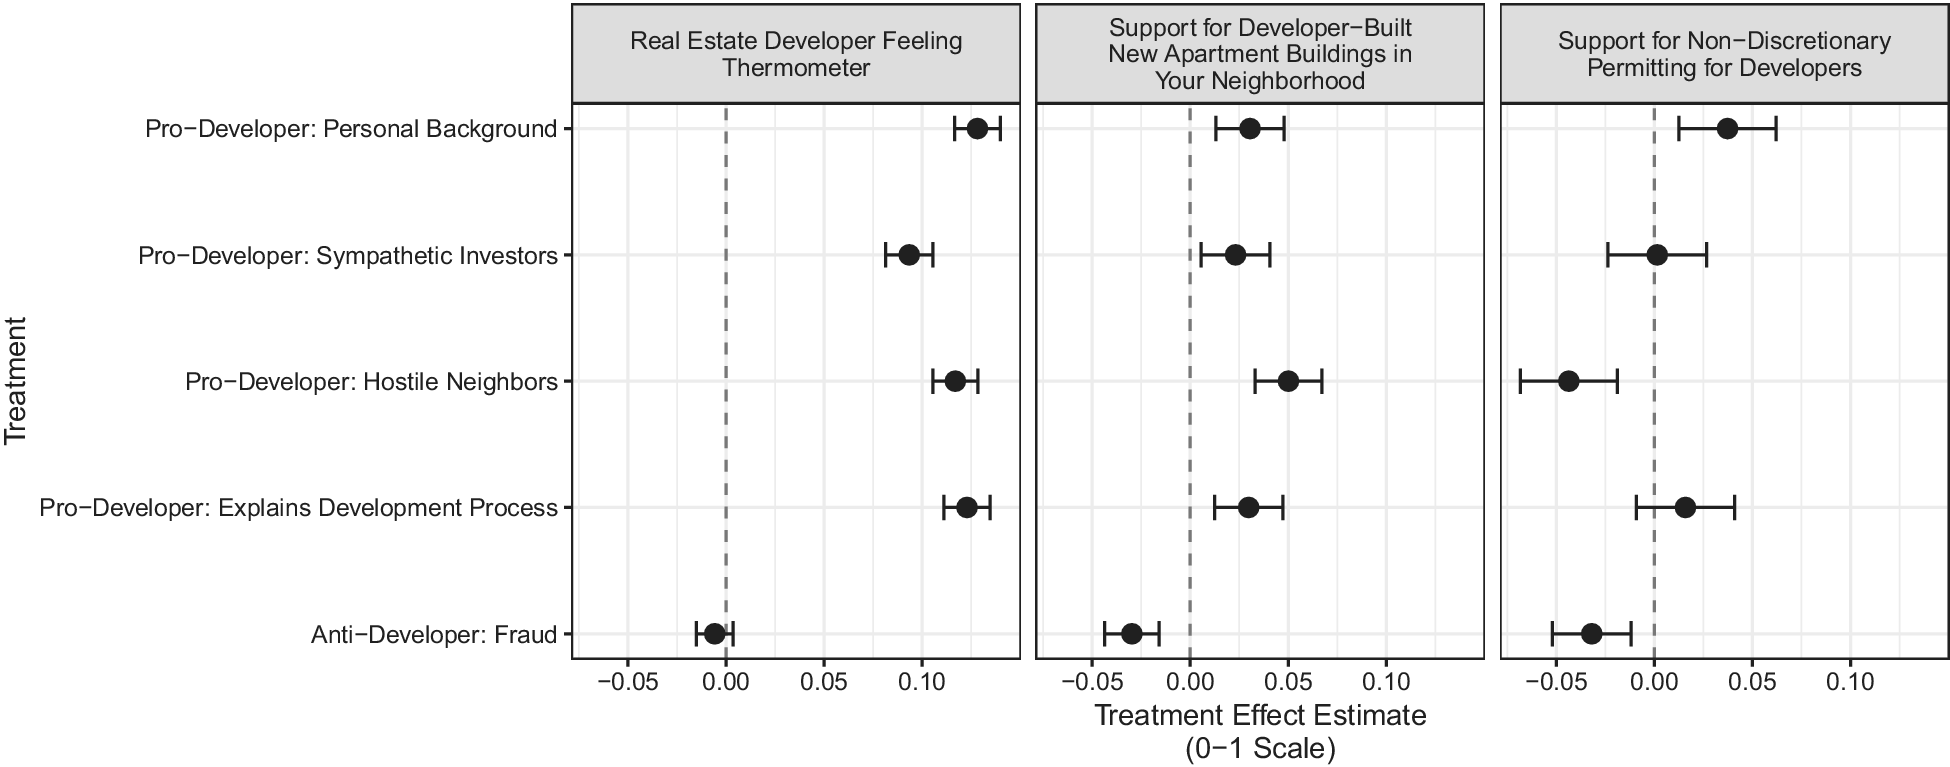
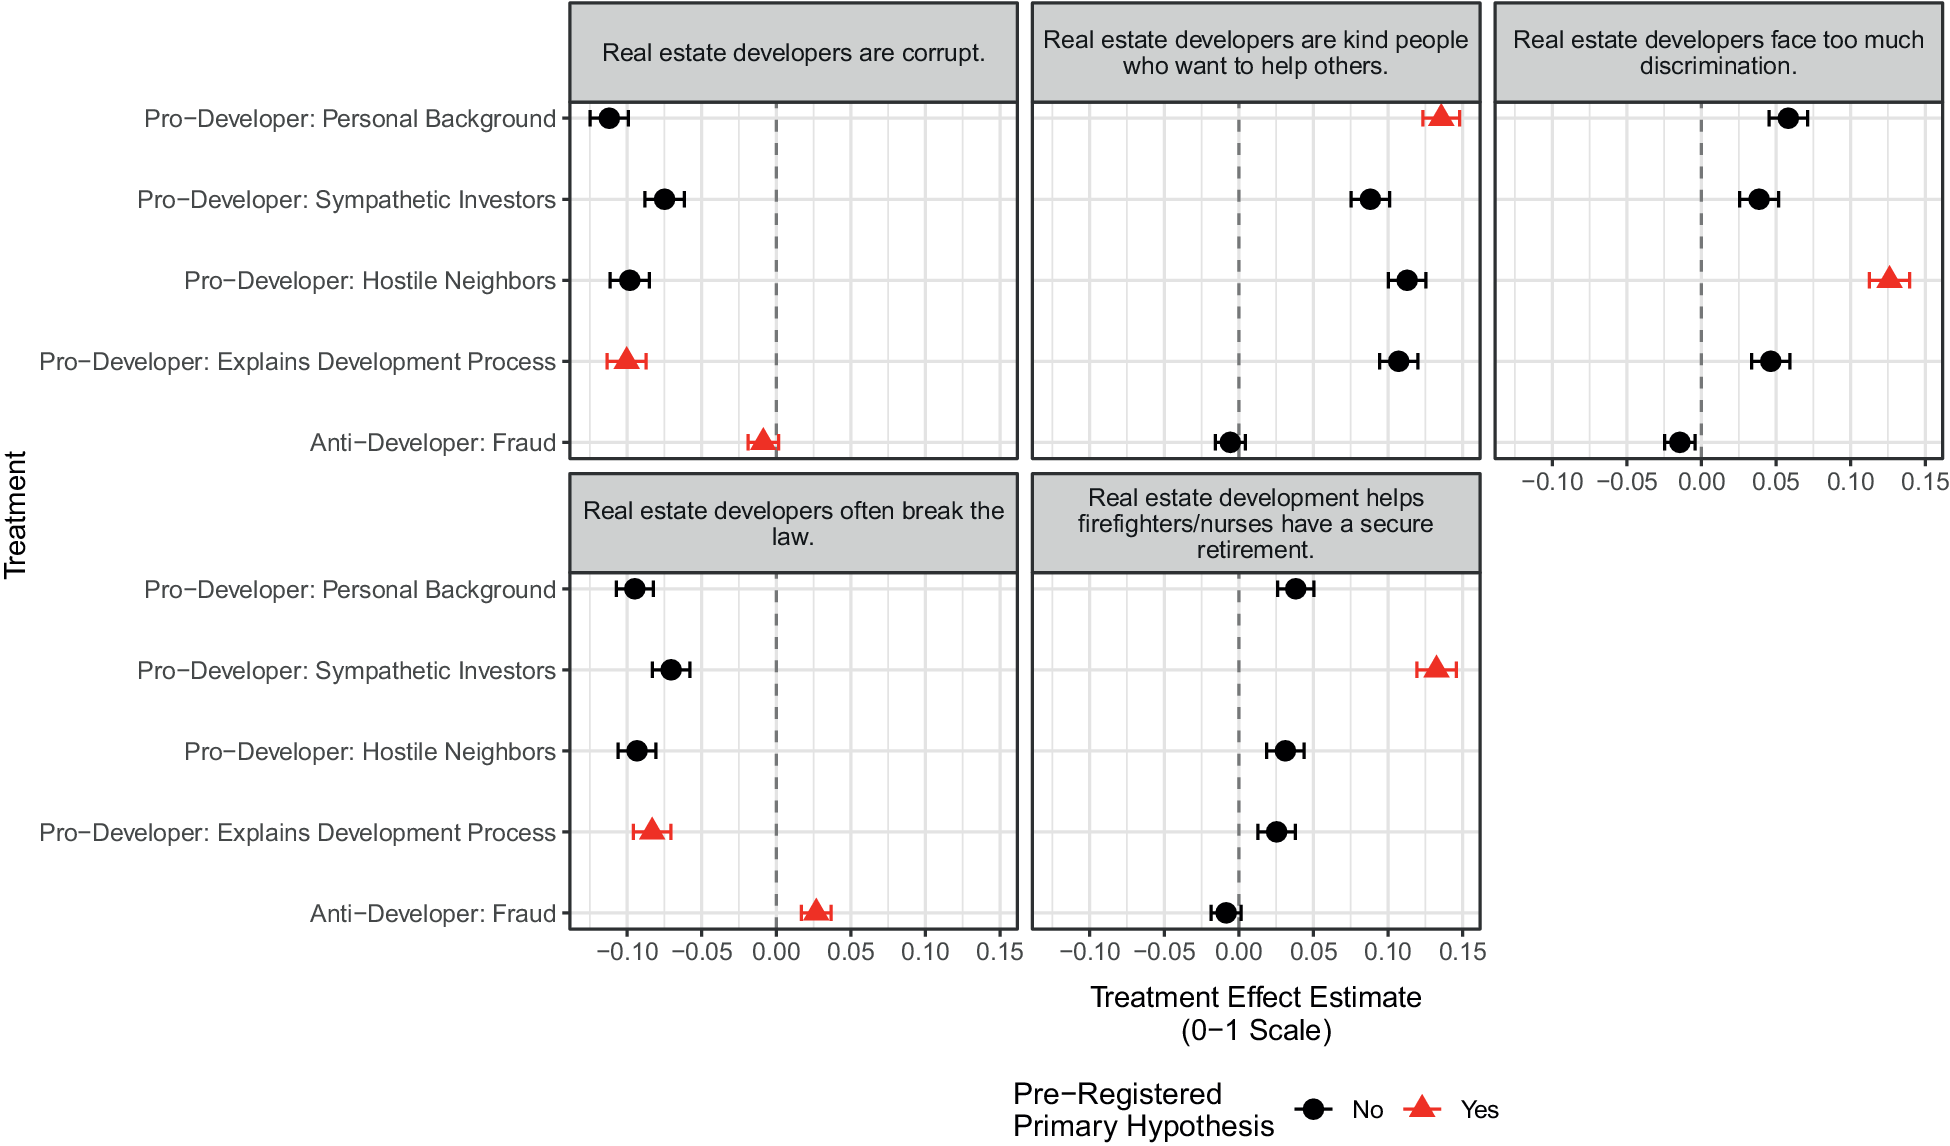
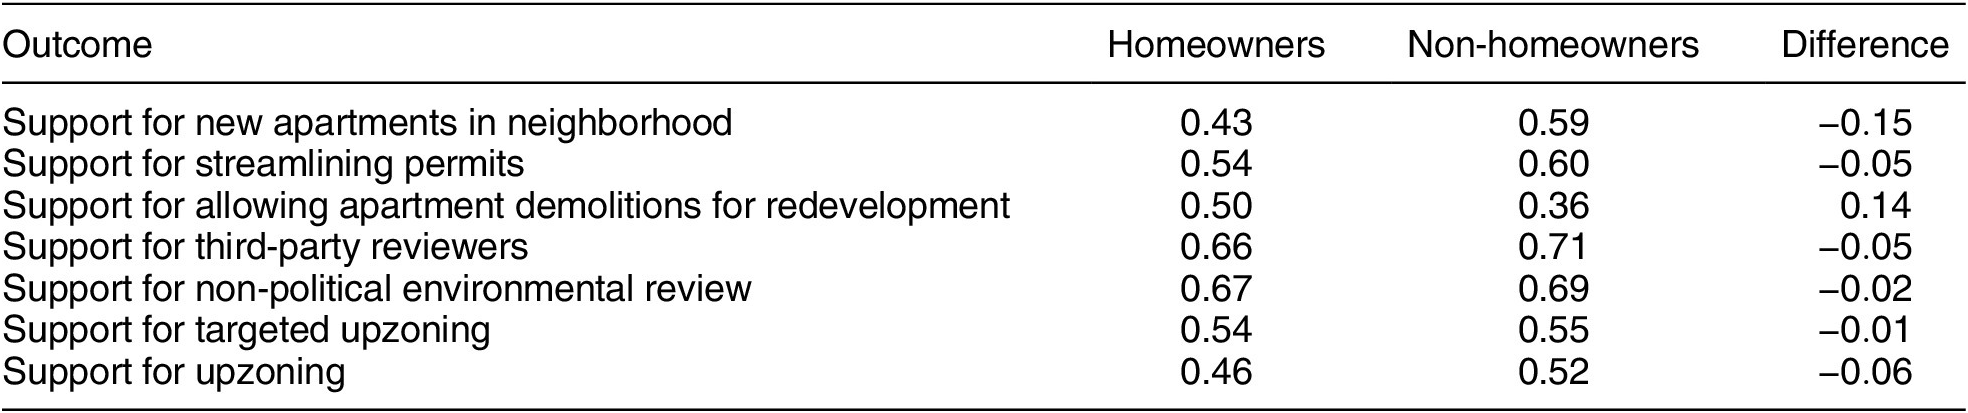


 Open access


Comments
No Comments have been published for this article.