Obesity is an important and increasingly prevalent public health problem in children and adolescents worldwide. Several studies have shown that obese children present with cardiometabolic risk factors such as high blood pressure, dyslipidaemia, and liver steatosis.Reference Giannini, de Giorgis and Scarinci 1 , Reference Sert, Pirgon, Aypar, Yilmaz and Odabas 2 Obesity in childhood and adolescence has been associated with adverse changes in cardiac geometry, including increased left ventricular mass and left atrial dimension.Reference Li, Li, Ulusoy, Chen, Srinivasan and Berenson 3 , Reference Marcovecchio, Gravina and Gallina 4 Abnormal left ventricular mass and geometry are well-established risk factors for cardiovascular events.Reference Bluemke, Kronmal and Lima 5 Increased left ventricular mass, hypertension, insulin resistance, and secondary hyperinsulinaemia and dyslipidaemia are recognised cardiovascular complications of obesity.Reference Daniels 6 In children with hypertension, excess body weight has been associated with left atrial size, independently of blood pressure,Reference Daniels, Witt, Glascock, Khoury and Kimball 7 suggesting a potential role of other obesity-related mechanisms including hyperinsulinaemia/insulin resistance.Reference Mangner, Scheuermann and Winzer 8 This predisposition to the development of subclinical cardiovascular alterations early in life is believed to increase cardiovascular morbidity and mortality in adulthood.Reference Cote, Harris, Panagiotopoulos, Sandor and Devlin 9
P-wave dispersion is a new and simple electrocardiographic marker that has been reported to be associated with inhomogeneous and discontinuous propagation of sinus impulses.Reference Dilaveris, Gialafos and Sideris 10 , Reference Dilaveris, Gialafos and Andrikopoulos 11 P-wave duration and P-wave dispersion are the most important non-invasive electrocardiogram markers that have been introduced to assess atrial arrhythmia risk in patients.Reference Dilaveris, Gialafos and Andrikopoulos 11 Previously, P-wave dispersion has been studied in hypertension, anorexia nervosa, asthma, acute rheumatic fever, mitral valve prolapse, and diabetes mellitus in childhood.Reference Chávez, González and LlanesMdel 12 – Reference Köken, Demir, Sen, Kundak, Oztekin and Alpay 17
Several studies have demonstrated that P-wave dispersion values are higher in obese adults.Reference Seyfeli, Duru, Kuvandik, Kaya and Yalcin 18 – Reference Kosar, Aksoy, Ari, Keskin and Sahin 20 At present, the extent of P-wave dispersion in obese adolescents has not been studied. In the present study, we aimed to evaluate P-wave dispersion in obese adolescents and investigate the relationship between P-wave dispersion, cardiovascular risk factors, and echocardiographic variables.
Materials and methods
Study population
In all, 150 obese adolescents (89 girls and 61 boys, mean age: 13.9±1.5 years, age range 12–17 years) were recruited from a subset of obese adolescents admitted to our Paediatric Endocrinology Unit between February, 2013 and July, 2013. Controls (26 girls and 24 boys, mean age: 14±1.3 years, age range 12–17) were selected from non-obese healthy adolescents.
Anthropometric measurements were performed in all patients. Height and weight were measured with an empty bladder in post-absorptive conditions. Height was measured to the nearest 0.5 cm using a standard height board, and weight was determined to the nearest 0.1 kg using a standard physician’s beam scale, with the subject dressed only in light underwear without shoes. Body mass index was calculated as weight (in kilograms) divided by height (in metres) squared. Patients with a body mass index ⩾95th percentile according to reference curves for Turkish adolescents were considered as obese.Reference Ozturk, Mazicioglu and Hatipoglu 21 Waist circumference was measured midway between the lowest rib and the top of the iliac crest at the end of gentle expiration. Hip circumference was measured over the great trochanters. Circumferences were measured over the naked skin and noted to the nearest 0.1 cm. Waist/hip ratio was calculated as the ratio of waist and hip circumference measurements.Reference Li, Ford, Mokdad and Cook 22 Pubertal development stage was assessed by a single paediatric endocrinologist using Tanner criteria. Staging for sexual maturation was >2 in all patients (Tanner stages II–IV). After resting for at least 5 minutes, systolic and diastolic blood pressures were measured in a sitting position, using a mercury-gravity manometer and a cuff appropriate for body size.
Patients were excluded if they had any systemic disease including type I or type II diabetes mellitus, if they were taking medications, or had a condition known to affect insulin action or insulin secretion – for example, glucocorticoid therapy, hypothyroidism, and Cushing’s disease. None of the patients had an accompanying disease, and none were taking drugs known to influence heart rhythm or electrocardiogram results. None of the patients had electrolyte abnormalities. The study protocols were approved by our hospital’s Ethics Committee. Signed informed consent forms were obtained from the parents of the adolescents.
Laboratory analyses
Fasting blood samples (at 8:00 am) were obtained to measure serum glucose concentrations, insulin levels, and other parameters in the morning by venepuncture after an overnight fast (at least 12 hours). Glucose level was determined by the hexokinase method. Serum concentrations of total cholesterol, high-density lipoprotein cholesterol, and triglycerides were measured by routine enzymatic methods using an Abbott diagnostics C16000 chemistry analyser (Abbott Diagnostics, Lake Forest, Illinois, United States of America). The value of low-density lipoprotein cholesterol was calculated using Friedwald’s equation. Serum insulin levels were measured by Immulite immunoassay (Siemens Healthcare Diagnostics, Camberley, United Kingdom).
Insulin resistance was estimated using the homoeostasis model assessment for insulin resistance: fasting insulin concentration (μU/ml)×fasting glucose concentration (mmol/L)/22.5.Reference Matthews, Hosker, Rudenski, Naylor, Treacher and Turner 23
Electrocardiogram analysis
A 12-lead electrocardiogram with a paper speed of 50 mm/second and 1 mV/cm standardisation was obtained on admission (Nihon Kohden electrocardiogram, Cardiofax GEM, Model 9022K, Tokyo, Japan). Measurements of P-wave duration were performed manually by two investigators blinded to the clinical status of the patients and controls. For greater accuracy, all measurements were performed with callipers and magnifying lenses. All the measurements were repeated twice and average values were recorded. The onset of the P-wave was defined as the junction between the isoelectric line and the beginning of the P-wave deflection, and the offset of the P-wave was defined as the junction between the end of the P-wave deflection and the isoelectric line. Heart rate and maximum and minimum P-wave durations were measured from the 12-lead surface electrocardiogram. P-wave dispersion was calculated as the difference between maximum and minimum P-wave duration.Reference Chávez, González and LlanesMdel 12 An acceptable electrocardiogram was defined by the ability to measure P-wave duration in at least eight of the 12 electrocardiographic leads that were recording simultaneously. All the patients and controls were in normal sinus rhythm during the examination. The intra-observer and inter-observer variations for all measurements were <5%, and therefore insignificant.
Transthoracic echocardiographic examination
All echocardiographic and Doppler assessments were performed by a single, expert paediatric cardiologist, who was blinded to the clinical and laboratory results of the study group. The ProSound Alpha 7 echocardiography equipment (Aloka, Hitachi-Aloka Medical, Tokyo, Japan) with a 3 MHz phased-array transducer was used for each subject. Echocardiographic evaluation from the parasternal long-axis view included left ventricular end-diastolic and end-systolic diameters, septum and left ventricular posterior wall thicknesses in diastole and systole, and left ventricular ejection fraction and fractional shortening. Teichholz’s M-mode formula was used to calculate left ventricular ejection fraction and fractional shortening. All data were obtained according to the recommendations of the American Society of Echocardiography.Reference Sahn, De Maria, Kisslo and Weyman 24
Left atrial dimension was measured from the parasternal long-axis window in M-mode echocardiography. Left ventricular mass was calculated using the following formula: 0.8{1.04[(left ventricular end-diastolic diameter+left ventricular posterior wall thickness+interventricular septal thickness)3−left ventricular end-diastolic diameter3]}+0.6 and indexed for height2.7.Reference de Simone, Daniels and Devereux 25 Transmittal flow patterns were obtained by pulsed wave-Doppler echocardiography from an apical four-chamber view. Peak early (E) and late (A) diastolic velocities and E/A ratios were measured.
Statistical analysis
Mean and standard deviations were used as descriptive statistics. Differences in the means of variables were tested using both parametric and non-parametric statistical analyses depending on the distribution of the variables. Correlation was analysed using Pearson’s correlation coefficient (r). Stepwise multivariate linear regression analysis was then used to determine parameters that independently explained a significant (p<0.05) fraction of the variance of the dependent variables. A value of p<0.05 was used to indicate statistical significance. Statistical analyses were performed with SPSS for Windows, version 15 (SPSS, Chicago, Illinois, United States of America).
Results
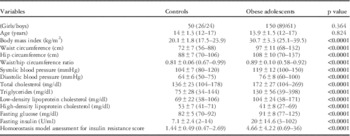
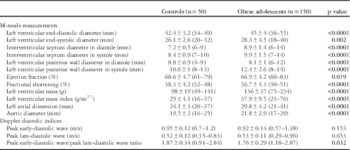
The characteristics of the patients and healthy controls are displayed in Table 1. Both groups were similar with respect to age and sex. The obese group had significantly higher body mass index (30.7±3.3 kg/m2 versus 20.1±1.8 kg/m2, p<0.0001) as well as waist and hip circumferences than the control group. The obese group also had significantly higher total cholesterol, triglycerides, low-density lipoprotein cholesterol, fasting glucose and insulin levels (20±14.6 U/ml versus 7.1±2.4 U/ml, p<0.0001), and homoeostasis model assessment for insulin resistance score (4.66±4.22 versus 1.44±0.49, p<0.0001) and lower high-density lipoprotein cholesterol levels than the control group. Echocardiographic findings of the patients and controls are summarised in Table 2. The obese group had significantly higher left atrial dimension and aortic diameter than the control group. Left ventricular M-mode measurements were significantly higher in the obese group when compared with controls. Measured by echocardiography, left ventricular ejection and shortening fractions were significantly lower in the obese group than the control group. The obese group had significantly lower mitral E-wave and higher mitral A-wave measurements, and consequently lower mitral E/A ratios, compared with controls. The obese group had significantly higher left ventricular mass and left ventricular mass index when compared with control group.
Clinical features of controls and obese adolescents.

Values are expressed as mean±SD with range given in parentheses
Significant p values are shown in bold
Echocardiographic findings of controls and obese adolescents.

Values are expressed as mean±SD with range given in parentheses
Significant p values are shown in bold
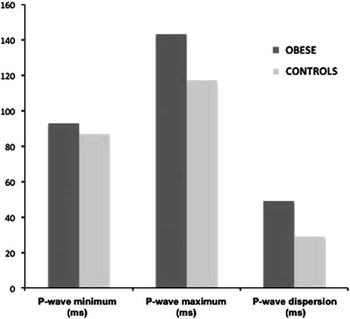
Maximum P-wave durations and P-wave dispersion values were considerably increased in the obese group when compared with the controls (143±19 ms versus 117±20 ms and 49±15 ms versus 29±9 ms, p<0.0001 for both, respectively) (Table 3) (Fig 1).
P-wave measurements in controls and the obese group.

Electrocardiographic findings of controls and obese adolescents.

Significant p values are shown in bold
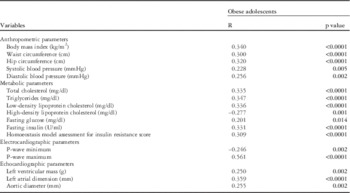
In the obese group, P-wave dispersion was positively correlated with body mass index, waist and hip circumferences, systolic and diastolic blood pressures, total cholesterol, low-density lipoprotein cholesterol, triglycerides, glucose and insulin levels, homoeostasis model assessment for insulin resistance score, left ventricular mass, left atrial dimension, and aortic diameter and was negatively correlated with high-density lipoprotein cholesterol (Table 4).
Pearson’s correlations between P-wave dispersion and other parameters in obese adolescents.

Significant p values are shown in bold
To evaluate variables that independently influenced P-wave dispersion, a multiple regression analysis model was performed in the obese group. Model covariates included body mass index, waist and hip circumferences, systolic and diastolic blood pressures, homoeostasis model assessment for insulin resistance, left ventricular mass, and mitral E/A ratio. After covariate adjustment, variables independently associated with P-wave dispersion included left atrial dimension (β: 0.252, p=0.008) and homoeostasis model assessment for insulin resistance score (β: 0.205; p=0.009).
Discussion
In the present study, maximum P-wave duration and P-wave dispersion were detected to be significantly higher in obese adolescents compared with controls. Furthermore, left atrial dimension and homoeostasis model assessment for insulin resistance score were found to be independent parameters associated with increased P-wave dispersion in obese adolescents.
It is recognised that increased P-wave duration and P-wave dispersion are associated with atrial conduction prolongation, left atrial enlargement, and left atrial hypertension. In addition, the autonomic tone, which induces changes in the velocity of impulse propagation, affects P intervals;Reference Dilaveris, Gialafos and Sideris 10 however, little information exists concerning P-wave duration and P-wave dispersion in obese subjects. Seyfeli et alReference Seyfeli, Duru, Kuvandik, Kaya and Yalcin 18 showed that obesity caused a significant increase in P-wave values, and obese women may be subjected to increased risk of atrial arrhythmias. Liu et alReference Liu, Fu, Korantzopoulos, Zhang, Wang and Li 26 demonstrated that maximum P-wave duration and P-wave dispersion were significantly higher in Chinese obese subjects compared with controls. Our study demonstrated that P-wave dispersion values in obese adolescents are higher than those of controls, which is consistent with the findings of previous studies in adults.Reference Russo, Ammendola, De Crescenzo, Docimo, Santangelo and Calabrò 19 , Reference Liu, Fu, Korantzopoulos, Zhang, Wang and Li 26
Obesity leads to global biatrial endocardial re-modelling, characterised by left atrial enlargement, conduction abnormalities, fractionated electrograms, and interstitial atrial fibrosis.Reference Mahajan, Lau and Brooks 27 It is well known that adult patients with obesity have a higher prevalence of hypertension, which may lead to left ventricular hypertrophy and left atrial enlargement that may play a role in an alteration of P-wave measurements. In addition, the autonomic control of the heart is abnormal in obese subjects due to a prevalence of sympathetic over parasympathetic limb of the autonomic balance. Therefore, the autonomic imbalance observed in obese subjects may affect intra-atrial and inter-atrial conduction times, and leave them predisposed to developing atrial arrhythmias.Reference Mahajan, Lau and Brooks 27 The diastolic dysfunction in obese subjects leads to an increase in left atrial pressure and tension in atrial tissue. In the present study, the obese group had a larger left atrial dimension, which is suggestive of early adverse cardiac modelling. In addition, we found that the E/A ratio was lower in the obese group, indicating diastolic dysfunction in obese patients. We demonstrated that P-wave dispersion had a significant correlation with left ventricular mass and left atrial dimension. These results suggest that subclinical left ventricular diastolic dysfunction and left atrial alterations in obese adolescents may contribute to the prolongation of P-wave.
In obese children, insulin resistance is also a key link between excess body weight and the associated risk of cardiovascular events. This metabolic abnormality is not only a risk factor for future development of type 2 diabetes but it is also associated with the presence of other cardiometabolic risk factors such as increased blood pressure, dyslipidaemia, and liver steatosis.Reference Chiarelli and Marcovecchio 28
In previous studies, left ventricular diastolic dysfunction and left ventricular re-modelling in obese adolescents have been shown to be linked with insulin resistance.Reference Sert, Aypar and Pirgon 29 Increased P-wave dispersion may be prolonged because of atrial tissue damage as a result of insulin resistance in the obese group. Peterson et alReference Peterson, Herrero and Schechtman 30 showed that insulin resistance produces metabolic and proliferative alterations in cardiomyocytes and the interstitium, leading to functional disturbances. Insulin resistance stimulates myocyte growth and interstitial fibrosis, leading to sodium retention and a subsequent blood volume increase. It also activates the sympathetic nervous system, exerting deleterious effects on cardiac performance and altering myocardial metabolism, including progressive increases in fatty acid turnover.Reference Lee and Lip 31 , Reference DiBello, Santini and DiCori 32 A recent study showed a positive correlation between insulin resistance and left atrial dimension in obese children. In this study, Marcovecchio et alReference Bluemke, Kronmal and Lima 5 concluded that the homoeostasis model assessment for insulin resistance score was independently associated with left atrial diameter, area, and volume.
Consequently, insulin resistance may lead to an increased P-wave dispersion by stimulating interstitial fibrosis, worsening diastolic function, and increasing atrial size. In the present study, we found that the homoeostasis model assessment for insulin resistance values were higher in the obese group, and these increased levels in the obese group were linked with P-wave dispersion. Furthermore, the obese group had higher left ventricular mass and larger left atrial dimension, which are suggestive of early adverse cardiac modelling. We demonstrated that insulin resistance is linked with P-wave dispersion. In addition, there were positive correlations between P-wave dispersion and cardiovascular risk factors and echocardiographic variables in obese adolescents. Our study demonstrated that the homoeostasis model assessment for insulin resistance was an independent predictor of P-wave dispersion in the obese group. Another recent study has also shown that insulin resistance in obese adults is associated with an increased P-wave dispersion.Reference Wang, Zhang and Xhen 33 In our study, inclusion of all metabolic and echocardiographic variables in a multivariate regression analysis showed that left atrial dimension and homoeostasis model assessment for insulin resistance score were independent parameters associated with increased P-wave dispersion in obese adolescents. We demonstrated that the presence of insulin resistance may have an additional increasing impact on P-wave dispersion in obese adolescents, which is equivalent to the results of previous publications.Reference Wang, Zhang and Xhen 33 , Reference Yasar, Bilen, Bilge, Ipek, Ipek and Kirbas 34
Nevertheless, the present study has some limitations. It is a cross-sectional study, and there was no long-term follow-up about whether these factors increase the risk of atrial arrhythmia in obese adolescents. Some further limitations include the fact that the subjects could not be observed prospectively for atrial arrhythmic events, and a 24-hour electrocardiographic examination was not performed to study the presence of atrial arrhythmia in our study population. In addition, we did not use the automatic algorithms for P-wave reconstruction.
Conclusions
It was found that obese adolescents had higher P-wave dispersion values compared with controls. The present study revealed that insulin resistance has a significant, independent impact on P-wave dispersion in obese adolescents; however, long-term follow-up prospective studies are necessary to clarify the potential clinical use of P-wave dispersion in obese adolescents.
Acknowledgements
None.
Financial Support
This research received no specific grant from any funding agency, commercial, or not-for-profit sectors.
Conflicts of Interest
None.
Ethical Standards
This study was approved by the local ethics committee of our institution, and parents of the participants provided their written informed consent.