





Introduction
Despite the extensive information available on their macroscale distribution, the mechanisms governing the distribution of Antarctic krill (Euphausia superba) and Antarctic fish, particularly the nototheniid Pleuragramma antarcticum and myctophids (Kock Reference Kock1992), are poorly understood. Thus, the relationship between their distribution and environmental factors in the Southern Ocean can only be described in very general terms (Nast et al. Reference Nast, Kock, Sahrhage, Stein, Tiedtke and Sahrhage1988). Information on krill and fish abundance and distribution is of particular importance for the understanding and management of the Antarctic ecosystem. The diet of top predators may therefore provide information on the status and trends of these populations and distribution patterns of their prey. Moreover, once the food preferences and foraging strategies of predators are understood, systematic information on predator species will become a very important tool for gauging ecosystem functioning.
The Antarctic fur seal (AFS; Arctocephalus gazella) is widely distributed in the Southern Ocean (see Boyd Reference Boyd, Perrin, Würsig and Thewissen2009, Forcada et al. Reference Forcada, Hoffman, Gimenez, Staniland, Bucktrout and Woodet2023) and is a top predator that preys heavily on krill and fish (see Green et al. Reference Green, Williams and Burton1991, Reid Reference Reid1995, Casaux et al. Reference Casaux, Baroni and Carlini1998a, Reference Casaux, Baroni, Arrighetti, Ramón and Carlini2003, Klages & Bester Reference Klages and Bester1998, Polito & Goebel Reference Polito and Goebel2010, etc.). Yet marked differences exist between seasons and localities in the diet of A. gazella. Casaux et al. (Reference Casaux, Baroni, Arrighetti, Ramón and Carlini2003) suggested that the long-term concurrent study of the diet of AFSs from different localities could help us to describe the patterns of distribution/abundance of their prey. Thus, we present information on the diet of non-breeding male AFSls (the main demographic group at the study area) obtained at four localities in the South Shetland Islands from the 1995 to the 2004 summer seasons.
Materials and methods
A total of 1254 scats of non-breeding male AFSs was collected from the 1995/1996 (hereafter 1995) to the 2004 summer season (usually from December to March each season) at Potter Peninsula (153–665 seals present during the sampling periods), King George/25 de Mayo Island; Duthoit Point (40–261) and Harmony Point (44–222), both at Nelson Island; and Deception Island (no census information available), all belonging to the South Shetland Islands archipelago (Fig. 1 & see details in Tables I–IV). The samples from Potter Peninsula and Harmony Point were collected every 7 days from the first arrival of the AFSs to the area (RC, JN and ACa, unpublished information; up to 15 samples per visit), whereas those from Duthoit Point and Deception Island were collected during monthly and occasional visits to the sites, respectively. We only collected entire and fresh scats found along the paths used to count the number of AFSs.
Map showing the sampling sites at the South Shetland and South Orkney islands, South Georgia and the Antarctic Peninsula mentioned in the main text, as well as b. a detail of the sampling sites at the South Shetland Islands.

Figure 1.a. Long description
Panel a is a large-scale map of the Southern Ocean region between 54 degrees South and 70 degrees South latitude, and 35 degrees West and 75 degrees West longitude. In the Northeast corner is South Georgia. Moving Southwest, Laurie Island is marked at approximately 61 degrees South, 45 degrees West. Further West are the South Shetland Islands, including Nelson Island, King George or 25 de Mayo Island, and Deception Island. To the South of these islands lies the Antarctic Peninsula, with specific sites marked at Hope Bay and Cierva Point. A 500 kilometer scale bar is located in the bottom right.
Panel b provides a high-resolution detail of the South Shetland Islands between 61.5 degrees South and 63.5 degrees South. From West to East, the labeled sites include Deception Island, Harmony Point on Nelson Island, and several points on King George or 25 de Mayo Island including Duthoit Point and Potter Peninsula. A 100 kilometer scale bar is positioned in the bottom right corner. Both panels include a North arrow in the top right corner.
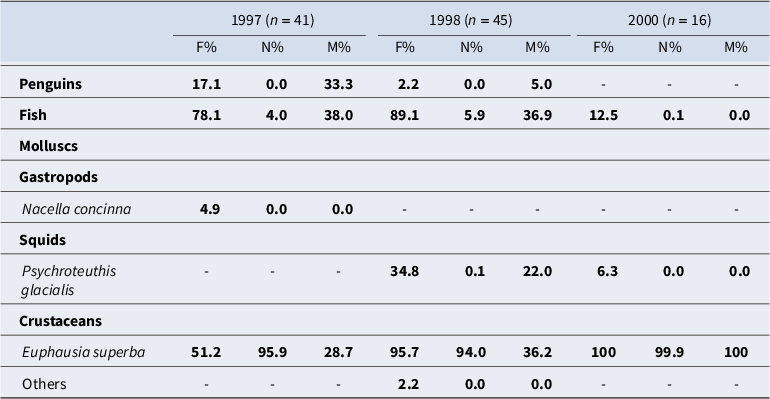
The composition of the diet of Antarctic fur seals as reflected by the analysis of scats collected at Duthoit Point, South Shetland Islands. Percentage frequencies of occurrence (F%), number (N%) and mass (M%) are given, and sampling sizes are indicated in parentheses. Unpublished information is indicated in bold.

Table I. Long description
The table presents diet composition using three metrics: percentage frequency of occurrence (F percent), number (N percent), and mass (M percent). The columns represent three sampling years: 1997 (n = 41), 1998 (n = 45), and 2000 (n = 16).
* Penguins: In 1997, F percent 17.1, N percent 0.0, M percent 33.3. In 1998, F percent 2.2, N percent 0.0, M percent 5.0. In 2000, no data recorded.
* Fish: In 1997, F percent 78.1, N percent 4.0, M percent 38.0. In 1998, F percent 89.1, N percent 5.9, M percent 36.9. In 2000, F percent 12.5, N percent 0.1, M percent 0.0.
* Molluscs (Gastropods - Nacella concinna): In 1997, F percent 4.9, N percent 0.0, M percent 0.0. No data for 1998 or 2000.
* Squids (Psychroteuthis glacialis): No data for 1997. In 1998, F percent 34.8, N percent 0.1, M percent 22.0. In 2000, F percent 6.3, N percent 0.0, M percent 0.0.
* Crustaceans (Euphausia superba): In 1997, F percent 51.2, N percent 95.9, M percent 28.7. In 1998, F percent 95.7, N percent 94.0, M percent 36.2. In 2000, F percent 100, N percent 99.9, M percent 100.
* Others: Only recorded in 1998 with F percent 2.2, N percent 0.0, M percent 0.0.
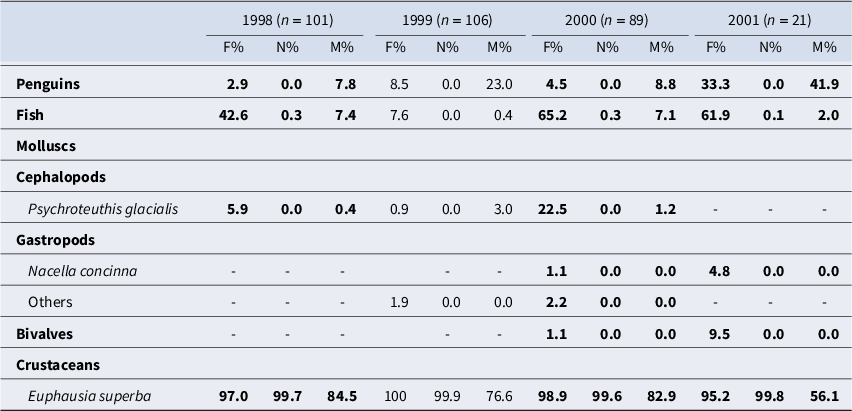
The composition of the diet of Antarctic fur seals as reflected by the analysis of scats collected at Potter Peninsula, South Shetland Islands. Percentage frequencies of occurrence (F%), number (N%) and mass (M%) are given, and sampling sizes are indicated in parentheses. Unpublished information is indicated in bold.

Table II. Long description
The table presents diet data across four years: 1998 (n = 101), 1999 (n = 106), 2000 (n = 89), and 2001 (n = 21). For each year, three metrics are provided: F percent (frequency of occurrence), N percent (number), and M percent (mass).
* Penguins: 1998 (2.9, 0.0, 7.8); 1999 (8.5, 0.0, 23.0); 2000 (4.5, 0.0, 8.8); 2001 (33.3, 0.0, 41.9).
* Fish: 1998 (42.6, 0.3, 7.4); 1999 (7.6, 0.0, 0.4); 2000 (65.2, 0.3, 7.1); 2001 (61.9, 0.1, 2.0).
* Molluscs - Cephalopods (Psychroteuthis glacialis): 1998 (5.9, 0.0, 0.4); 1999 (0.9, 0.0, 3.0); 2000 (22.5, 0.0, 1.2); 2001 (no data).
* Molluscs - Gastropods (Nacella concinna): 1998 (no data); 1999 (no data); 2000 (1.1, 0.0, 0.0); 2001 (4.8, 0.0, 0.0).
* Molluscs - Others: 1998 (no data); 1999 (1.9, 0.0, 0.0); 2000 (2.2, 0.0, 0.0); 2001 (no data).
* Bivalves: 1998 (no data); 1999 (no data); 2000 (1.1, 0.0, 0.0); 2001 (9.5, 0.0, 0.0).
* Crustaceans (Euphausia superba): 1998 (97.0, 99.7, 84.5); 1999 (100, 99.9, 76.6); 2000 (98.9, 99.6, 82.9); 2001 (95.2, 99.8, 56.1).
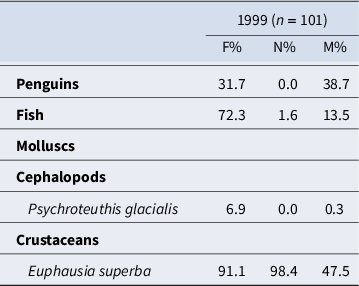
The composition of the diet of Antarctic fur seals as reflected by the analysis of scats collected at Deception Island, South Shetland Islands. Percentage frequencies of occurrence (F%), number (N%) and mass (M%) are given, and sampling sizes are indicated in parentheses.

Table III. Long description
The table presents dietary data from 101 scat samples collected in 1999. The data is organized into three metrics: F percent (Frequency of occurrence), N percent (Number), and M percent (Mass).
* Penguins: F percent 31.7, N percent 0.0, M percent 38.7.
* Fish: F percent 72.3, N percent 1.6, M percent 13.5.
* Molluscs and Cephalopods: This category includes Psychroteuthis glacialis with F percent 6.9, N percent 0.0, and M percent 0.3.
* Crustaceans: This category is dominated by Euphausia superba, which shows the highest frequency and numerical presence with F percent 91.1, N percent 98.4, and M percent 47.5.
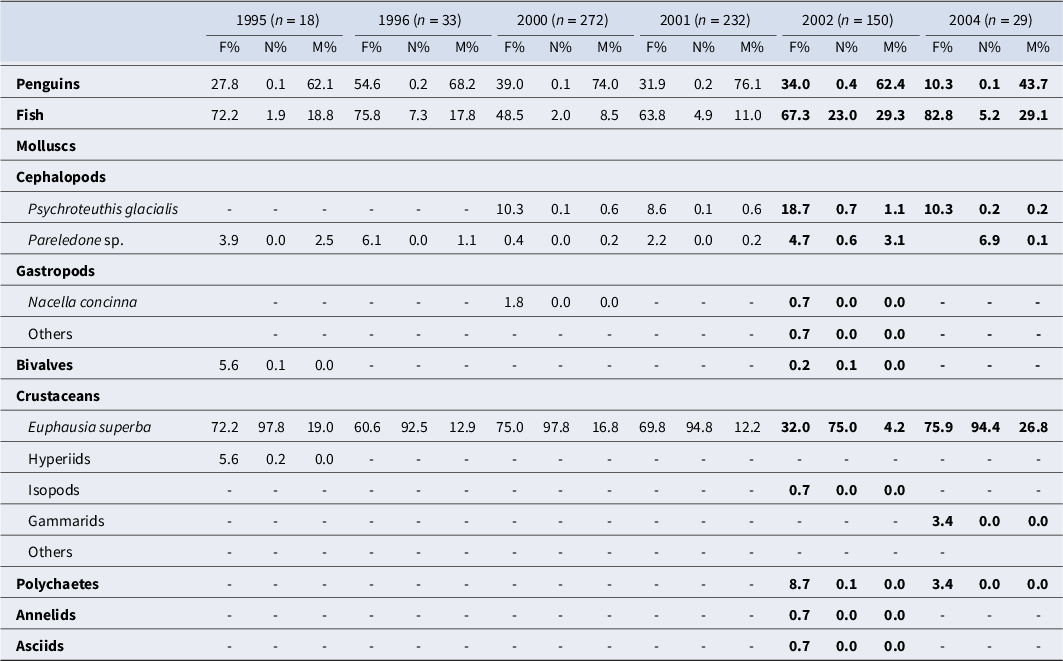
The composition of the diet of Antarctic fur seals as reflected by the analysis of scats collected at Harmony Point, South Shetland Islands. Percentage frequencies of occurrence (F%), number (N%) and mass (M%) are given, and sampling sizes are indicated in parentheses. Unpublished information is indicated in bold.

Table IV. Long description
The table presents diet composition across six columns representing the years 1995 (n = 18), 1996 (n = 33), 2000 (n = 272), 2001 (n = 232), 2002 (n = 150), and 2004 (n = 29). Each year is subdivided into three metrics: F percent (frequency of occurrence), N percent (number), and M percent (mass).
Key data points include:
* Penguins: Mass percentage (M percent) remains high across all years, ranging from 43.7 in 2004 to 76.1 in 2001.
* Fish: Frequency (F percent) is consistently high, peaking at 82.8 in 2004, while mass percentage (M percent) fluctuates between 8.5 and 29.3.
* Molluscs: Includes Cephalopods (Psychroteuthis glacialis and Pareledone species), Gastropods (Nacella concinna), and Bivalves. Psychroteuthis glacialis shows an increase in frequency to 18.7 in 2002.
* Crustaceans: Dominated by Euphausia superba (Antarctic krill), which shows very high numerical percentages (N percent) ranging from 75.0 to 97.8 across most years, though its mass percentage (M percent) is lower, peaking at 26.8 in 2004.
* Other categories: Minor occurrences of Polychaetes, Annelids, and Asciids are recorded primarily in 2002 and 2004.
The samples were individually washed through sieves (minimum mesh 0.54 mm), and the prey remains were sorted to the lowest taxonomic level possible. In order to estimate the approximate number of individual Antarctic krill present in each sample, we considered the number of eyes and telsons or the dry weight of the total number of the carapaces present in the sample according to the technique described by Casaux et al. (Reference Casaux, Baroni and Carlini1998a). The highest of three estimates was considered the minimum number of krill specimens present per sample. The mass of the individuals was estimated by comparison with entire specimens stranded ashore in the study.
Cephalopods were identified using reference material and the illustrations and descriptions in Clarke (Reference Clarke1980), Lipinski & Woyciechowski (Reference Lipinski and Woyciechowski1981) and Okutani & Clarke (Reference Okutani and Clarke1985). The number of individuals represented in the samples was estimated by the number of upper and lower beaks or eye lenses. The lower hood length of octopod beaks (tentatively identified as Pareledone sp.) was measured to the nearest 0.01 mm with vernier callipers, and the mass of the individuals was estimated using the length-mass relationship developed by Rodhouse et al. (Reference Rodhouse, Arnbom, Fedak, Yeatman and Murray1992). The squids were tentatively assigned to Psychroteuthis glacialis, and the mass of the individuals was estimated by considering the rostral length of the lower beak and applying the length-mass relationship described in Gröger et al. (Reference Gröger, Piatkowski and Heinemann2000). The number of gastropods and bivalves represented in the scats was estimated by considering the number of shells present in the samples, and the mass was estimated by comparison with entire specimens recovered from the study area.
Bones, otoliths and eye lenses indicated the presence of fish in the scat samples. The sagittal otoliths were identified to species level, where possible, using our reference collection and the illustrations and descriptions in Hecht (Reference Hecht1987) and Williams & McEldowney (Reference Williams and McEldowney1990). The otoliths belonging to specimens of each species were sorted into right and left; the higher count of right or left otoliths was considered to represent the number of fish of the corresponding species present in each scat sample. The otolith lengths were measured to the nearest 0.01 mm, and the fish body length and mass were estimated using the equations in Hecht (Reference Hecht1987), Williams & McEldowney (Reference Williams and McEldowney1990) and Casaux et al. (Reference Casaux, Soave and Coria1998b).
Given that penguins were represented almost exclusively by feathers, the number of individuals represented in the samples was not accurately estimated. Although this would probably result in an underestimation (Casaux et al. (Reference Casaux, Bellizia and Baroni2004) reported that an AFS was seen killing and eating three penguins consecutively at the South Shetland Islands), we arbitrarily assigned one individual per sample that contained penguin remains. The weight of penguins consumed per scat sample was assumed as the mean mass reported for Pygoscelis antarcticus fledging chicks (2910 g; Moreno et al. Reference Moreno, Viñuela and Belliure1998) minus the mean mass of carcasses of penguins killed by seals (mean = 956.25 g, standard deviation = 233.01 g, range = 550–1400 g, n = 16; Casaux et al. Reference Casaux, Bellizia and Baroni2004) found along the shore of Harmony Point (see Casaux et al. Reference Casaux, Bellizia and Baroni2004). For penguin species distributed at the sampling sites, see https://www.penguinmap.com/mapppd.
Polychaetes were mainly represented by mandibles, and isopods, hyperiids and gammarids were mainly represented by exoskeleton remains. Their masses were estimated by comparison with entire specimens collected in the study area.
The contribution of prey to the diet of seals is expressed as percentage frequency occurrence (F%; percentage of samples in which a prey is represented), percentage importance by number (N%; percentage of specimens of a determined prey species in relation to the total number of prey represented in the samples) and percentage importance by mass (M%; mass percentage of the specimens of a determined prey species in relation to the total mass of prey represented in the samples), and these were estimated following the procedures in Casaux et al. (Reference Casaux, Baroni, Arrighetti, Ramón and Carlini2003). As the estimates of the number and mass of prey species represented in scats usually give biased results (see Green & Burton Reference Green and Burton1987, Casaux et al. Reference Casaux, Baroni and Carlini1997, Bowen & Iverson Reference Bowen and Iverson2013, etc.), the estimated mass of the different dietary items does not necessarily represent their real contribution to the diet. However, these values were included because they provide information not reflected by the frequencies of occurrence of prey items.
Results
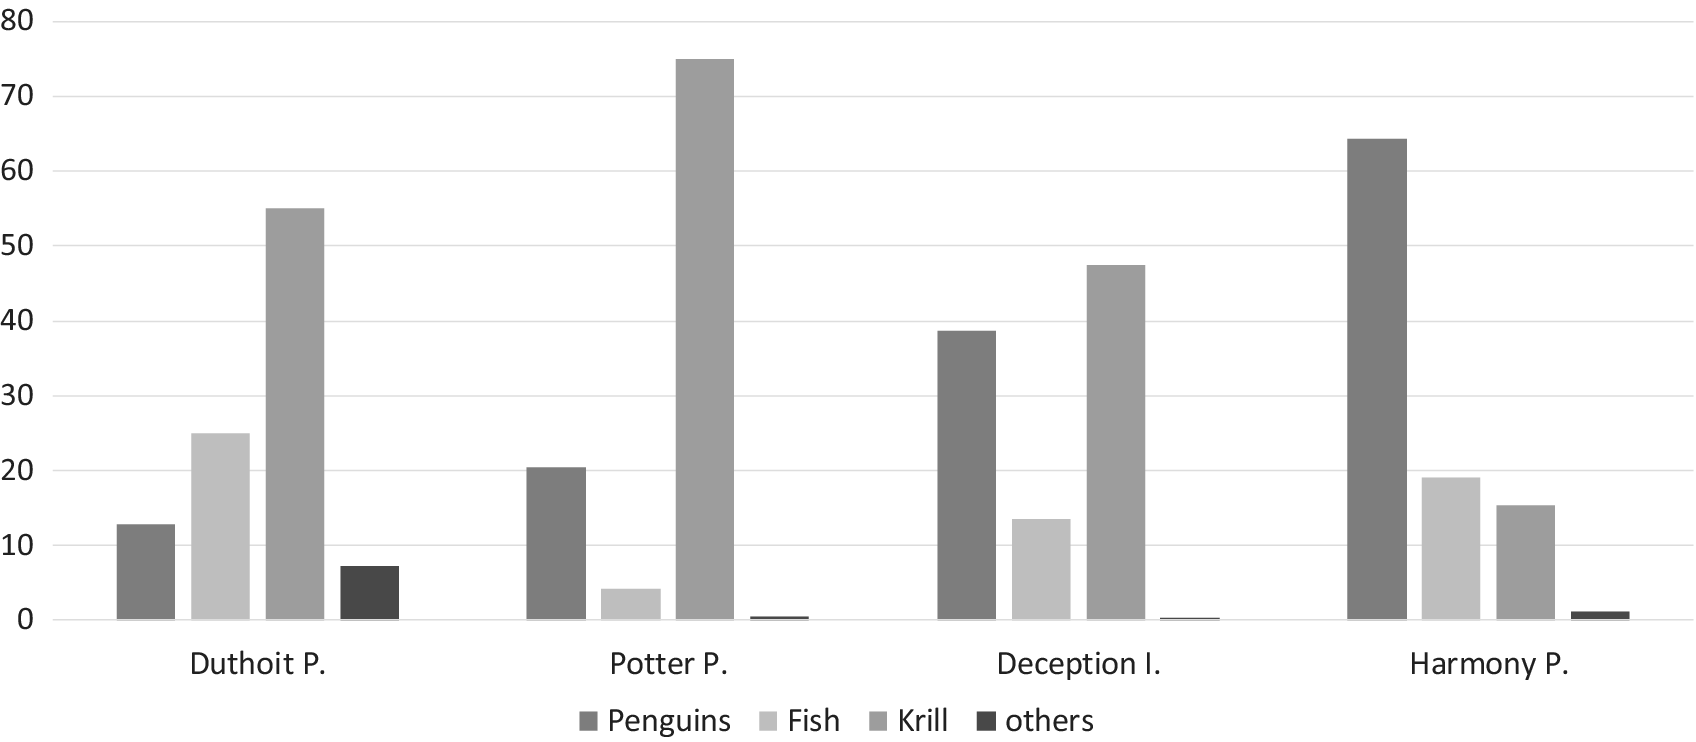
Overall, Antarctic krill, fish and penguins were the main prey at the four localities under study (Figs 1 & 2 & Tables I–IV), and there was consistency within each locality in the prey that contributed most to the diet of the AFSs. Whereas Antarctic krill was the prey that contributed most in mass to the diet of AFSs at Potter Peninsula and Deception Island, fish and penguins dominated by mass at Duthoit Point (except in 2000, when krill dominated) and Harmony Point, respectively. The remaining prey contributed little to the diet of the AFSs. The overall diet composition and the fish prey only (Tables I–VIII) indicated that AFSs at Harmony Point exhibited the widest prey spectrum.
Overall dietary composition observed in male Antarctic fur seals at four localities of the South Shetland Islands.

Figure 2. Long description
A bar chart with a vertical y-axis ranging from 0 to 80 and a horizontal x-axis listing four localities. A legend at the bottom identifies four categories: Penguins (dark gray), Fish (light gray), Krill (medium gray), and others (black).
* Duthoit P.: Krill is the dominant prey at approximately 55 percent, followed by Fish at 25 percent, Penguins at 13 percent, and others at 7 percent.
* Potter P.: Krill is the highest at 75 percent, followed by Penguins at 20 percent, Fish at 4 percent, and others at less than 1 percent.
* Deception I.: Krill leads at 48 percent, followed by Penguins at 39 percent, Fish at 13 percent, and others at less than 1 percent.
* Harmony P.: Penguins are the primary prey at 64 percent, followed by Fish at 19 percent, Krill at 15 percent, and others at 2 percent.
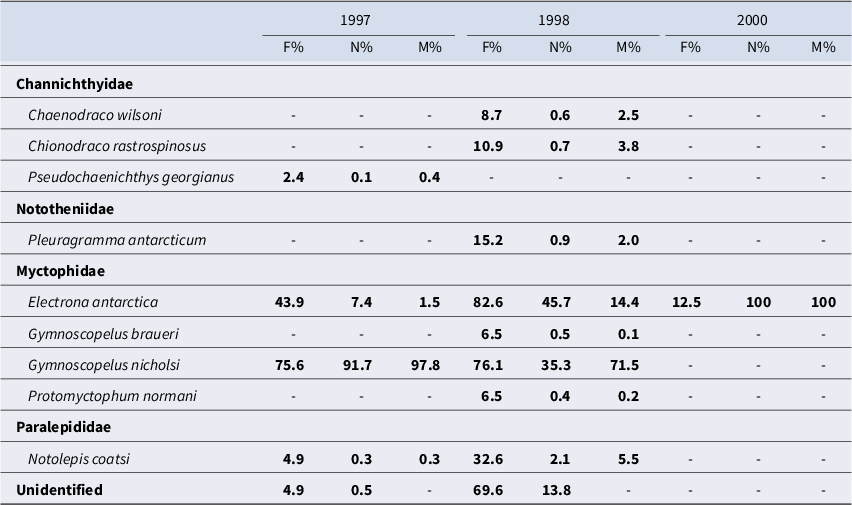
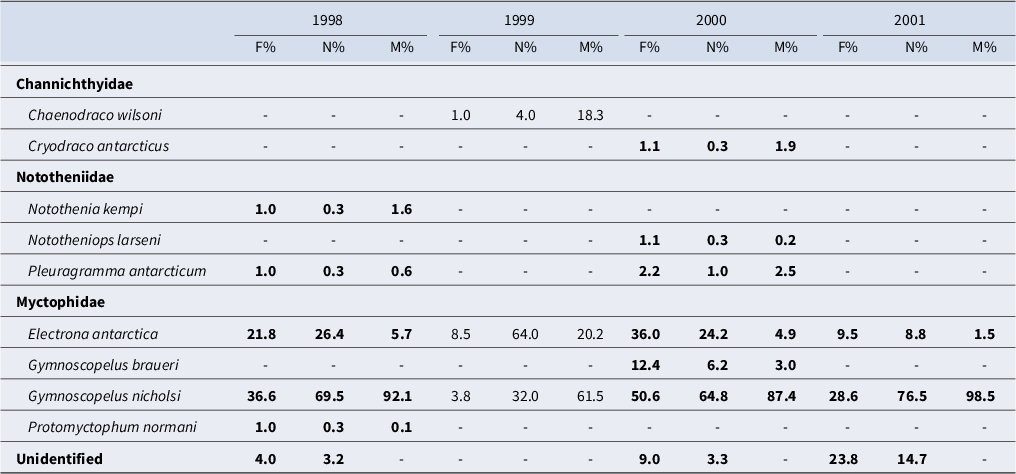
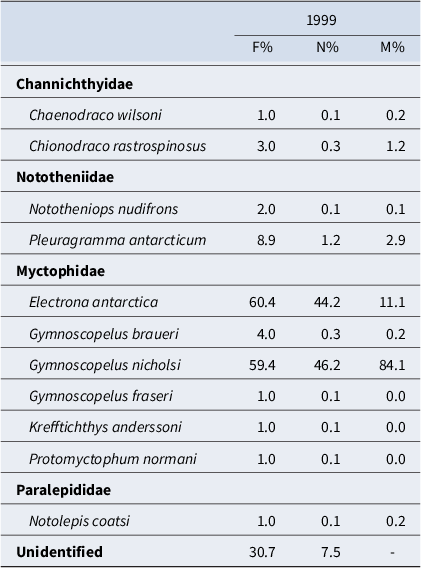
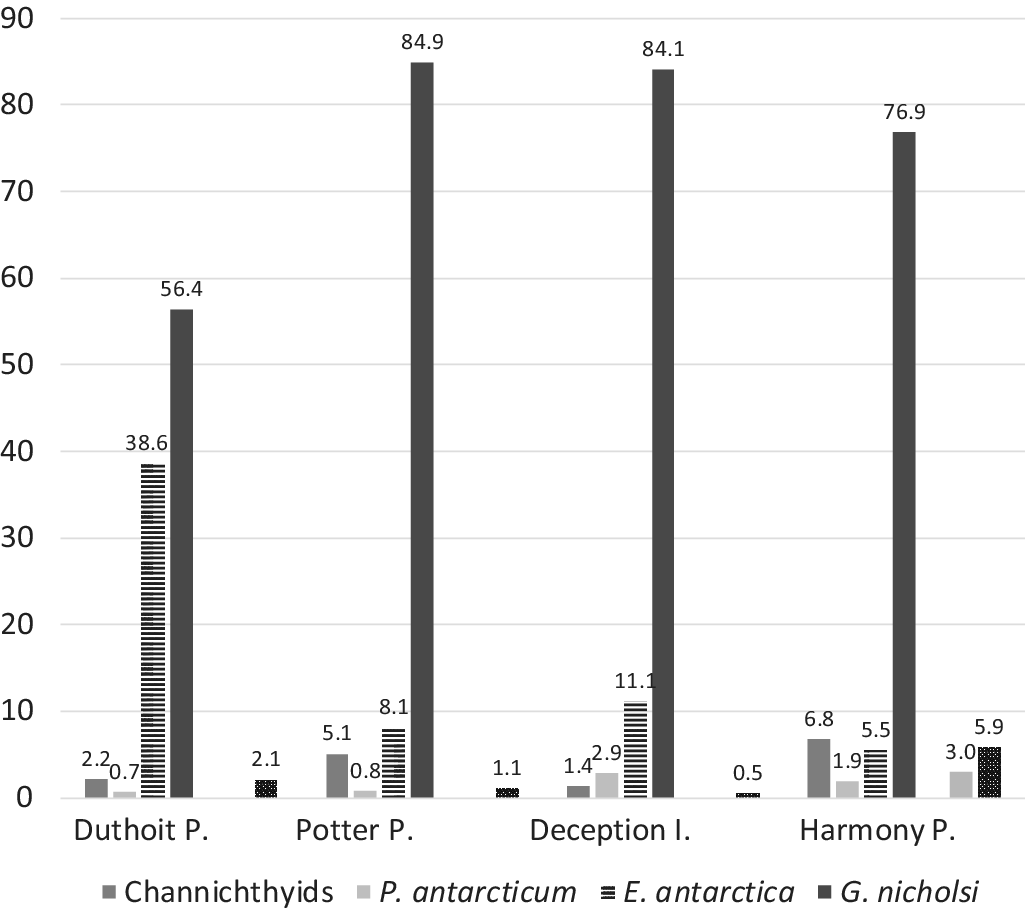
Seven fish families were represented in the diet of AFSs: Myctophidae, Nototheniidae, Channichthyidae, Harpagiferidae, Paralepididae, Bathydraconidae and Bathylagidae (Tables V–VIII). Myctophids, followed by nototheniids or channichthyids, were the fish that most contributed in mass to the diet of AFSs at all of the localities (Fig. 3). Among myctophids, G. nicholsi and E. antarctica were the main prey. Interestingly, P. antarcticum, a formerly important prey of AFSs (see later), and Gobionotothen gibberifrons and Notothenia rossii, both targeted species for the fisheries in the past (Kock Reference Kock1992), were absent or scarcely represented in the diet of the AFSs during the study period of 1995–2004.
Fish represented by the otoliths found in scats of Antarctic fur seals collected at Duthoit Point, South Shetland Islands. Percentage frequencies of occurrence (F%), number (N%) and mass (M%) are given. Unpublished information is indicated in bold.

Table V. Long description
The table lists fish species categorized by family, with data columns for percentage frequency of occurrence (F percent), number (N percent), and mass (M percent) for the years 1997, 1998, and 2000.
* Channichthyidae family:
- Chaenodraco wilsoni: Only recorded in 1998 (F 8.7, N 0.6, M 2.5).
- Chionodraco rastrospinosus: Only recorded in 1998 (F 10.9, N 0.7, M 3.8).
- Pseudochaenichthys georgianus: Only recorded in 1997 (F 2.4, N 0.1, M 0.4).
* Nototheniidae family:
- Pleuragramma antarcticum: Only recorded in 1998 (F 15.2, N 0.9, M 2.0).
* Myctophidae family:
- Electrona antarctica: Recorded in 1997 (F 43.9, N 7.4, M 1.5), 1998 (F 82.6, N 45.7, M 14.4), and 2000 (F 12.5, N 100, M 100).
- Gymnoscopelus braueri: Only recorded in 1998 (F 6.5, N 0.5, M 0.1).
- Gymnoscopelus nicholsi: Recorded in 1997 (F 75.6, N 91.7, M 97.8) and 1998 (F 76.1, N 35.3, M 71.5).
- Protomyctophum normani: Only recorded in 1998 (F 6.5, N 0.4, M 0.2).
* Paralepididae family:
- Notolepis coatsi: Recorded in 1997 (F 4.9, N 0.3, M 0.3) and 1998 (F 32.6, N 2.1, M 5.5).
* Unidentified fish: Recorded in 1997 (F 4.9, N 0.5) and 1998 (F 69.6, N 13.8).
Fish represented by the otoliths found in scats of Antarctic fur seals collected at Potter Peninsula, South Shetland Islands. Percentage frequencies of occurrence (F%), number (N%) and mass (M%) are given. Unpublished information is indicated in bold.

Table VI. Long description
The table presents data for four years (1998, 1999, 2000, 2001) with three metrics for each: F percent (frequency of occurrence), N percent (number), and M percent (mass).
Family Channichthyidae:
* Chaenodraco wilsoni: Only recorded in 1999 (F percent 1.0, N percent 4.0, M percent 18.3).
* Cryodraco antarcticus: Only recorded in 2000 (F percent 1.1, N percent 0.3, M percent 1.9).
Family Nototheniidae:
* Notothenia kempi: Only recorded in 1998 (F percent 1.0, N percent 0.3, M percent 1.6).
* Nototheniops larseni: Only recorded in 2000 (F percent 1.1, N percent 0.3, M percent 0.2).
* Pleuragramma antarcticum: Recorded in 1998 (F percent 1.0, N percent 0.3, M percent 0.6) and 2000 (F percent 2.2, N percent 1.0, M percent 2.5).
Family Myctophidae:
* Electrona antarctica: Present in all years. Highest N percent in 1999 (64.0) and highest F percent in 2000 (36.0).
* Gymnoscopelus braueri: Only recorded in 2000 (F percent 12.4, N percent 6.2, M percent 3.0).
* Gymnoscopelus nicholsi: Dominant species across all years. In 2001, it reached its highest mass percentage (M percent 98.5) and number percentage (N percent 76.5).
* Protomyctophum normani: Only recorded in 1998 (F percent 1.0, N percent 0.3, M percent 0.1).
Unidentified fish were also recorded in 1998, 2000, and 2001, with the highest frequency in 2001 (F percent 23.8).
Fish represented by the otoliths found in scats of Antarctic fur seals collected at Deception Island, South Shetland Islands. Percentage frequencies of occurrence (F%), number (N%) and mass (M%) are given.

Table VII. Long description
The table presents data for the year 1999 across three metrics: F percent (frequency of occurrence), N percent (number), and M percent (mass). The data is categorized by fish families and species:
* Channichthyidae family:
- Chaenodraco wilsoni: F percent 1.0, N percent 0.1, M percent 0.2.
- Chionodraco rastrospinosus: F percent 3.0, N percent 0.3, M percent 1.2.
* Nototheniidae family:
- Nototheniops nudifrons: F percent 2.0, N percent 0.1, M percent 0.1.
- Pleuragramma antarcticum: F percent 8.9, N percent 1.2, M percent 2.9.
* Myctophidae family:
- Electrona antarctica: F percent 60.4, N percent 44.2, M percent 11.1.
- Gymnoscopelus braueri: F percent 4.0, N percent 0.3, M percent 0.2.
- Gymnoscopelus nicholsi: F percent 59.4, N percent 46.2, M percent 84.1.
- Gymnoscopelus fraseri: F percent 1.0, N percent 0.1, M percent 0.0.
- Krefftichthys anderssoni: F percent 1.0, N percent 0.1, M percent 0.0.
- Protomyctophum normani: F percent 1.0, N percent 0.1, M percent 0.0.
* Paralepididae family:
- Notolepis coatsi: F percent 1.0, N percent 0.1, M percent 0.2.
* Unidentified: F percent 30.7, N percent 7.5, M percent is not recorded.
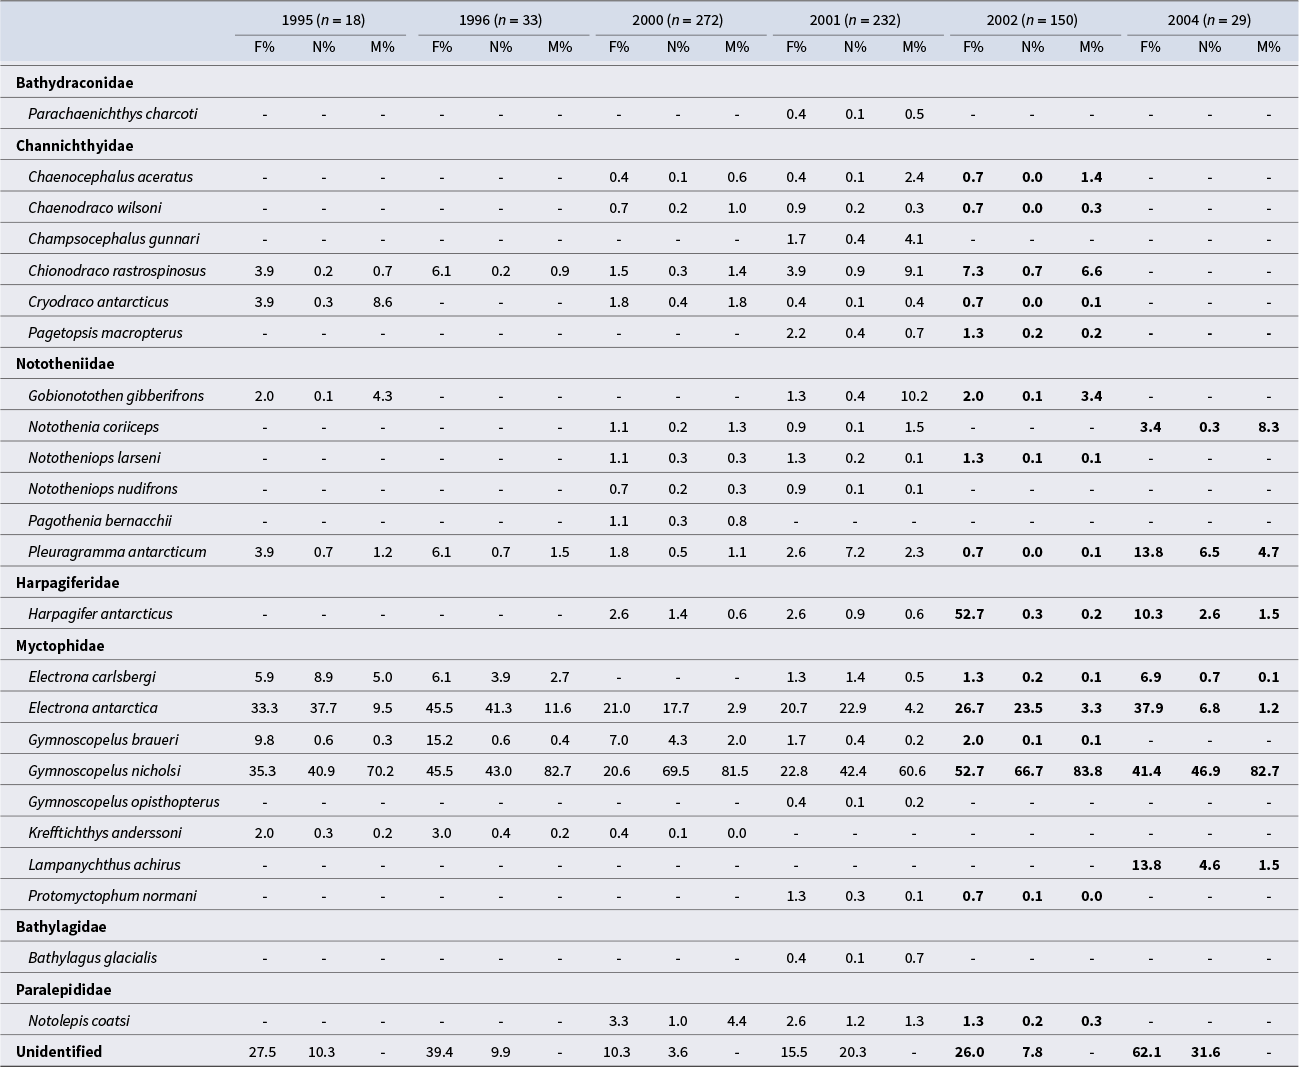
Fish represented by the otoliths found in scats of Antarctic fur seals collected at Harmony Point, South Shetland Islands. Percentage frequencies of occurrence (F%), number (N%) and mass (M%) are given, and sampling sizes are indicated in parentheses. Unpublished information is indicated in bold.

Table VIII. Long description
The table presents data for the years 1995 n = 18, 1996 n = 33, 2000 n = 272, 2001 n = 232, 2002 n = 150, and 2004 n = 29. For each year, three metrics are provided: F percent frequency of occurrence, N percent number, and M percent mass.
Key data points by fish family and species include:
* Bathydraconidae: Parachaenichthys charcoti appears only in 2001 with F 0.4, N 0.1, M 0.5.
* Channichthyidae: Includes six species. Chionodraco rastrospinosus is present in most years, peaking in 2002 with F 7.3, N 0.7, M 6.6.
* Nototheniidae: Includes six species. Pleuragramma antarcticum shows a significant presence in 2004 with F 13.8, N 6.5, M 4.7.
* Harpagiferidae: Harpagifer antarcticus shows a major spike in 2002 with F 52.7, N 0.3, M 0.2.
* Myctophidae: This family is highly represented. Gymnoscopelus nicholsi is a dominant species across all years, consistently showing high mass percentages, such as M 70.2 in 1995, M 82.7 in 1996, M 81.5 in 2000, M 60.6 in 2001, M 83.8 in 2002, and M 82.7 in 2004. Electrona antarctica also shows high frequency and number percentages, peaking in 1996 with F 45.5 and N 41.3.
* Bathylagidae: Bathylagus glacialis appears only in 2001 with F 0.4, N 0.1, M 0.7.
* Paralepididae: Notolepis coatsi is present from 2000 to 2002, peaking in 2000 with F 3.3, N 1.0, M 4.4.
* Unidentified: Unidentified remains were most frequent in 2004 with F 62.1 and N 31.6.
Overall fish contribution to the diet of male Antarctic fur seals at four localities of the South Shetland Islands.

Figure 3. Long description
The y-axis represents percentage from 0 to 90 in increments of 10. The x-axis lists four locations: Duthoit P., Potter P., Deception I., and Harmony P. A legend at the bottom identifies four categories: Channichthyids (solid grey), P. antarcticum (light grey), E. antarctica (horizontal stripes), and G. nicholsi (dark grey).
* At Duthoit P., Channichthyids are 2.2, P. antarcticum is 0.7, E. antarctica is 38.6, and G. nicholsi is 56.4.
* At Potter P., Channichthyids are 5.1, P. antarcticum is 0.8, E. antarctica is 8.1, and G. nicholsi is 84.9.
* At Deception I., Channichthyids are 1.4, P. antarcticum is 2.9, E. antarctica is 11.1, and G. nicholsi is 84.1.
* At Harmony P., Channichthyids are 6.8, P. antarcticum is 1.9, E. antarctica is 5.5, and G. nicholsi is 76.9.
Small isolated bars for Channichthyids at 2.1, 1.1, and 0.5, and for P. antarcticum at 3.0 and G. nicholsi at 5.9 appear between or next to the main clusters without explicit labels for the intermediate x-axis points.
Discussion
Within each locality AFSs exhibited a similar dietary pattern. Antarctic krill, followed by penguins, was largely the prey that most contributed by mass to the diet of AFSs at Potter Peninsula and Deception Island. Except in 2000, when krill was largely the main prey, fish dominated in the diet at Duthoit Point. In contrast, penguins, followed by fish or krill, dominated at Harmony Point. Although Potter Peninsula, Duthoit Point and Harmony Point are very close localities (see Fig. 1), the dietary composition varied among them, even in most of those seasons with concurrent information. This fact, and the consistency in the composition of the diet within each locality, suggests that food availability varies among the localities. It is also probable that food availability did not vary widely among localities, and that AFSs forage on different prey due to local conditions (i.e. interspecific competition for food resources; Casaux et al. Reference Casaux, Bertolin and Carlini2011). In this sense, it was reported that, to some extent, the diet composition of seals is also driven by interspecific food competition (Casaux et al. Reference Casaux, Bertolin and Carlini2011), and that AFSs opportunistically select feeding grounds and exploit locally and temporally abundant resources (Ichii et al. Reference Ichii, Bengtson, Hayashi, Miura, Takao and Boveng1997, Casaux et al. Reference Casaux, Bellizia and Baroni2004). Regarding the opportunistic foraging behaviour of AFSs, in our study the contribution of penguins to the diet seems to be in line with their abundance at the sampling sites (Potter Peninsula and Duthoit Point had 7900 and 2958 breeding pairs, respectively: MJ, personal observation; Harmony Point had 93 000 breeding pairs: Silva et al. (Reference Silva, Favero, Casaux and Baroni1998); no information is available for the area sampled at Deception Island). Moreover, in a regional study on the composition of the diet of AFSs that considered localities of the Antarctic Peninsula, the South Shetland and the South Orkney islands, Casaux et al. (Reference Casaux, Baroni, Arrighetti, Ramón and Carlini2003) also observed that AFSs foraged on penguins proportionately with the availability of these birds at the different localities.
AFSs at Harmony Point exhibited the widest prey spectrum. This might be explained by the higher number of samples from this locality and, perhaps, by the fact that this locality is exposed to waters of the Drake Passage and of the Bransfield Strait/Mar de la Flota, whereas the remaining localities are exposed only to waters of this strait.
In studies carried out Daneri & Carlini (Reference Daneri and Carlini1999), Daneri et al. (Reference Daneri, Carlini, Harrington, Balboni and Hernandez2008), Harrington et al. (Reference Harrington, Daneri, Carlini and Reygert2016) and Descalzo et al. (Reference Descalzo, Daneri, Negrete, Corbalán and Barrera-Oro2021) between 1992 and 2021 it was reported that at Potter Peninsula krill and fish were the most frequent prey of AFSs during summer. In our study krill was also the main prey at Potter Peninsula, but penguins followed in importance instead of fish, which scarcely contributed to the diet by mass. It is probable that the differences in the estimated contributions of penguins to the diet among studies are related, at least partially, to the fact that in some of those studies (e.g. Daneri & Carlini Reference Daneri and Carlini1999) penguins were not considered as prey, or that in the remaining studies (i.e. Daneri et al. Reference Daneri, Carlini, Harrington, Balboni and Hernandez2008, Harrington et al. Reference Harrington, Daneri, Carlini and Reygert2016, Descalzo et al. Reference Descalzo, Daneri, Negrete, Corbalán and Barrera-Oro2021) the contribution of non-fish prey to the diet by mass was not estimated. When we consider the frequencies of occurrence only, our results on the overall diet composition agree with previous findings. A similar situation arises when we compare our Duthoit Point data with information published in 2021 (Descalzo et al. Reference Descalzo, Daneri, Negrete, Corbalán and Barrera-Oro2021). In the studies cited earlier it was also reported that G. nicholsi was the main fish prey and that P. antarcticum was well represented in the samples. In our study G. nicholsi and E. antarctica were the most important fish prey and, differently, P. antarcticum was absent or scarcely represented in the samples. It is probable that at Potter Peninsula and Duthoit Point the availability of P. antarcticum varies widely across the seasons, but varying capabilities in otolith identification may also explain the differences among studies in the contribution of this fish to the diet. On the other hand, the relative importance of myctophids and P. antarcticum as prey at the South Shetland Islands in the late 1990s was also reflected in the diet of other fish-eating seabirds and seal species (see Casaux et al. Reference Casaux, Baroni and Carlini1998a). Moreover, Casaux et al. (Reference Casaux, Baroni, Arrighetti, Ramón and Carlini2003) suggested that the importance of myctophids and P. antarcticum to the diet of AFSs at the South Shetland Islands has increased and decreased throughout the 1990s, respectively. The absence of recent comparative studies on the abundance of these fish at the study area prevents further analysis on this point.
Previous concurrent information on the overall summer diet composition of AFSs obtained during January–March 2000 at Cierva Point and Hope Bay (Fig. 1), both in the Antarctic Peninsula, indicated that krill and then fish were largely the main prey, and that penguins contributed scarcely at all to the diet (Casaux et al. Reference Casaux, Baroni, Arrighetti, Ramón and Carlini2003). Krill, followed by penguins (4 seasons) or fish (3 seasons), was the most important prey in 7 of the 10 seasons considered by Casaux et al. (Reference Casaux, Juáres, Carlini and Corbalán2016) at Laurie Island, South Orkney Islands (Fig. 1), and when penguins (2 seasons) or fish (1 season) were the most important prey, that crustacean was always the second most important. Our information on the overall diet composition is in line with that reported previously for the Antarctic Peninsula and the South Orkney Islands, supporting the generalist and opportunistic foraging behaviour reported for AFSs (Casaux et al. Reference Casaux, Bellizia and Baroni2004). Regarding fish, P. antarcticum, followed by channichthyids, predominated in the summer diet of AFSs at Cierva Point (27.6% by mass) and at Hope Bay (86.6% by mass), both in the Antarctic Peninsula (Casaux et al. Reference Casaux, Baroni, Arrighetti, Ramón and Carlini2003). In contrast, myctophids (almost exclusively G. nicholsi) predominated in the diet of AFSs in 5 of the 10 seasons considered by Casaux et al. (Reference Casaux, Juáres, Carlini and Corbalán2016) at the South Orkney Islands, whereas nototheniids (mainly G. gibberifrons) did in three seasons and channichthyids (mainly Chaenocephalus aceratus and Chionodraco rastrospinosus) in two of those seasons, whereas P. antarcticum was absent or scarcely represented in the samples. Our results partially agree with those from the South Orkney Islands given that at both areas P. antarcticum was absent or scarcely represented in the samples and that myctophids, particularly G. nicholsi, were among the most important fish prey. In this sense, Casaux et al. (Reference Casaux, Baroni, Arrighetti, Ramón and Carlini2003) observed that the contributions of myctophids and P. antarcticum to the diet of AFSs increased and decreased, respectively, from the Antarctic Peninsula to the South Orkney Islands. On the other hand, our results differ from those from the South Orkney Islands in the fact that in this archipelago benthic-demersal fish species contributed significantly to the diet of AFSs. G. gibberifrons was the most important benthic-demersal fish prey at the South Orkney Islands, but, except for some seasons at Harmony Point, this fish was absent from our samples. G. gibberifrons was severely affected by the fishery activities carried out in the 1980s in both archipelagos, to the point that their populations were depleted (e.g. Kock Reference Kock1992, Barrera-Oro et al. Reference Barrera-Oro, Marschoff and Ainley2017, etc.). The comparison of our results with those from the South Orkney Islands suggests a recovery of this fish at this archipelago and provides evidence that at the South Shetland Islands their populations remains low, a pattern also reflected by the composition of the diet of South Georgia shags (Casaux & Ramón Reference Casaux and Ramón2002) and Antarctic shags (Casaux & Barrera-Oro Reference Casaux and Barrera-Oro2006). In line with our observations, Reid et al. (Reference Reid, Davis and Staniland2006) reported that information on the diet of AFSs suggests a lack of recovery after the fisheries of stocks of N. rossii at South Georgia and Champsocephalus gunnari at the South Orkney Islands.
The top predators or key species of an ecosystem are increasingly being used as monitoring vehicles for the marine environment. Montevecchi (Reference Montevecchi, Furness and Greenwood1993) proposed that behavioural and reproductive buffers are highly responsive to environmental contingencies and can often generate useful environmental information, including indications of the conditions of fish stocks. In this sense, Casaux et al. (Reference Casaux, Baroni, Arrighetti, Ramón and Carlini2003) suggested that coordinated long-term studies on the diet of the AFSs from different localities may help to give advice on the patterns of distribution/abundance of krill, P. antarcticum and myctophids, which is of particular importance for the administration of these current or potential resources and for the management of the Antarctic ecosystem. The fact that our results are consistent with previous information on the diet of the AFSs from the study area, and that the pattern of fish consumption observed at the South Shetland Islands during recent decades (see earlier) was also reflected by the analysis of the diets of other potential P. antarcticum-feeders such as Cape petrels (Daption capense), Weddell seals (Leptonychotes weddelli) and Antarctic terns (Sterna vittata; Casaux et al. Reference Casaux, Baroni and Carlini1997, Reference Casaux, Soave and Coria1998b, Reference Casaux, Baroni, Ramón, Favero and Silva2008), encourages the implementation of such kinds of monitoring programmes.
Acknowledgements
We thank the personnel of the Instituto Antártico Argentino who helped with sample collection.
Author contributions
RC, JN, ACo and ACa participated in sample collection. RC and ACo processed the samples. RC carried out the data analysis and prepared the first draft of the manuscript. AFR prepared the figures and tables. RC, JN, AFR and MJ commented on versions of the manuscript, gave final approval for publication and agreed to be held accountable for the work performed.
Data availability
The datasets used in the analyses reported here are available from the Instituto Antártico Argentino.
Financial support
The study was supported with funds assigned by the Instituto Antártico Argentino to the project PICTA 2010-13.
Competing interests
The authors declare none.
Ethical standards
All applicable international, national and/or institutional guidelines for the care and use of seals were followed. Our research was approved by the Oficina de Medioambiente of the Instituto Antártico Argentino.


 Open access

