




No CrossRef data available.
Article contents
The dynamics of Wuchereria bancrofti infection: a model-based analysis of longitudinal data from Pondicherry, India
Published online by Cambridge University Press: 06 May 2004
Abstract
This paper presents a model-based analysis of longitudinal data describing the impact of integrated vector management on the intensity of Wuchereria bancrofti infection in Pondicherry, India. The aims of this analysis were (1) to gain insight into the dynamics of infection, with emphasis on the possible role of immunity, and (2) to develop a model that can be used to predict the effects of control. Using the LYMFASIM computer simulation program, two models with different types of immunity (anti-L3 larvae or anti-adult worm fecundity) were compared with a model without immunity. Parameters were estimated by fitting the models to data from 5071 individuals with microfilaria-density measurement before and after cessation of a 5-year vector management programme. A good fit, in particular of the convex shape of the age-prevalence curve, required inclusion of anti-L3 or anti-fecundity immunity in the model. An individual's immune-responsiveness was found to halve in ~10 years after cessation of boosting. Explanation of the large variation in Mf-density required considerable variation between individuals in exposure and immune responsiveness. The mean life-span of the parasite was estimated at about 10 years. For the post-control period, the models predict a further decline in Mf prevalence, which agrees well with observations made 3 and 6 years after cessation of the integrated vector management programme.
Keywords
Information
- Type
- Research Article
- Information
- Copyright
- 2004 Cambridge University Press
INTRODUCTION
Despite availability of effective anti-parasitic treatment and other tools for control, lymphatic filariasis continues to be a major public health problem in tropical areas of Asia, Africa, the Western Pacific and parts of the Americas. More than one-third of the estimated 120 million infected people live in India (Michael, Bundy & Grenfell, 1996). There is increasing interest in applying strategies for transmission control based on mass-chemotherapy with annual single dose diethylcarbamazine (DEC), ivermectin, or a combination of either of these with albendazole (Ottesen et al. 1997; Ottesen, Ismail & Horton, 1999). Where feasible, vector control is recommended as an adjunct to chemotherapy based strategies (Ottesen & Ramachandran, 1995). Worldwide elimination of the disease as a public health problem is considered feasible (World Health Organization, 1997).
To evaluate the effects of control measures, to anticipate the effectiveness of population-based interventions and to aid decision-making about control strategies, the transmission dynamics of the parasite should be well understood. Epidemiological models have proven to be valuable tools in this respect (Anderson & May, 1985; Isham & Medley, 1996). Various deterministic models have been used to study the dynamics of infection and disease due to Wuchereria bancrofti (Hairston & Jachowski, 1968; Subramanian et al. 1989a; Vanamail et al. 1989; Rochet, 1990; Srividya et al. 1991; Day et al. 1991a; Das et al. 1994; Michael & Bundy, 1998; Michael et al. 2001a). In the present paper, we use the LYMFASIM (Plaisier et al. 1998) model, which is based on the stochastic microsimulation technique (Habbema et al. 1996).
LYMFASIM offers a framework for integrating current knowledge on the dynamics of transmission. By simulating the processes and mechanisms involved in parasite development and transmission, and taking individual variation in exposure to infection into account, the model allows prediction of trends in infection prevalence and intensity over time. However, a considerable number of parameters need to be quantified. For this purpose, we use data collected by the Vector Control Research Centre (VCRC) of the Indian Council of Medical Research, for the evaluation of integrated vector management in urban Pondicherry, India (Rajagopalan et al. 1989; Subramanian et al. 1989b; Das et al. 1992; Manoharan et al. 1997). The VCRC-database is unique in that it combines entomological and epidemiological observations and that it includes a very large sample of the population of Pondicherry (almost 25000 observations in 1981). Furthermore, the infection status of humans has been measured at 4 time points (1981, 1986, 1989, and 1992), which enables the study of longitudinal cohorts.
In this study, LYMFASIM is fitted to data for a cohort of individuals examined both in 1981 and 1986, i.e. before and after the integrated vector management programme in Pondicherry. The aim of the present analysis is 2-fold. The first objective is to provide more insight into the dynamics of lymphatic filariasis, and more specifically into the possible role of the host immune response in regulating infection. Different types of models – with and without immunity – are compared and parameters that are important for the dynamics of infection are quantified. The second objective of the study is to arrive at models that can be used to predict the effectiveness of vector control or mass treatment strategies for the control of W. bancrofti in Pondicherry, India. The resulting models are tested, by comparing model predictions 3 and 6 years after cessation of vector control with the actual observations.
MATERIALS AND METHODS
Description of LYMFASIM
LYMFASIM is a stochastic microsimulation model for the epidemiology of lymphatic filariasis in human populations (Habbema et al. 1996; Plaisier et al. 1998). The model simulates the life-histories of human individuals (birth, acquisition and loss of parasites, death) and individual parasites (maturation, mating, production of Mf, death). Together, the simulated persons constitute the population of an endemic village or area. A detailed description and mathematical formulation of the model has been given in an earlier publication (Plaisier et al. 1998). Here we restrict ourselves to a brief description of the model and the factors that are directly relevant to the effects of vector control. Of particular importance are the regulation of parasite density in both the vector and the human host.
Transmission and parasite dynamics
A graphical representation of the model is given in Fig. 1. In this figure, the monthly force-of-infection (foi) indicates the number of parasites that enter the human host in a month and the proportion that develops successfully into adult worms, sr. The force-of-infection varies between individuals and over time; its calculation is explained below.
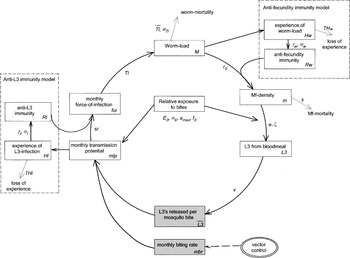
Fig. 1. Schematic representation of LYMFASIM. Immune-regulation is optional in LYMFASIM. The shaded boxes are entomological variables; these variables do not vary between individuals. The unshaded boxes are human variables; the index i indicates that the variable may differ between individuals. Along the arrows, the symbols of relevant parameters are shown.
In the case of a constant force-of-infection, the expected equilibrium worm-load (M, number of mature worms) in a person is found by multiplying the force-of-infection for this person times the average reproductive life-span (i.e. total life-span minus duration of immature stage) of an adult parasite. The total life-span of the worm is assumed to vary between parasites, and is described by a Weibull distribution with mean Tl and shape-parameter αTl. Estimates for the life-span of Onchocerca volvulus (the filarial nematode species causing human onchocerciasis), indicated less than exponential variation (αTl>1) and hence we have fixed the value of αTl to 2·0 (Plaisier et al. 1991). The duration Ti of the immature stage is considered to be 8 months (World Health Organization, 1992). The parasite life-span not only determines the equilibrium worm-load, but also the rate of worm-mortality and thereby the rate at which the worm-load declines in the case of interruption of transmission.
Female adult worms produce microfilariae (Mf), provided that the human host harbours at least one adult male parasite, assuming a totally polygamous system in W. bancrofti. The Mf production is equal to r0 per month per 20 μl blood per female parasite in the absence of an anti-fecundity immune response, but is reduced when the human hosts develop such a response (see below). The simulated true Mf-density, m, in a person is expressed in terms of the average number per 20 μl peripheral blood taken for diagnosis and is updated monthly using the number of Mf produced by each female worm per month. Mf-mortality is governed by a monthly survival fraction s=0·9 for the Mf (Plaisier et al. 1999). The variability (between blood samples within a host) in the actual (discrete) number of Mf counted in the smear is described by a negative binomial distribution with a mean equal to the true Mf-density in an individual and a parameter of dispersion km. Overdispersion will be smaller (km larger) when a larger volume of blood is examined (due to increased sensitivity). Due to intra-host and observer variability in Mf counts, false Mf-negative cases (count=0) can occur.
Based on experimental data, the relation between the Mf-density m in a human and the number of L3 that will develop in Culex quinquefasciatus mosquitoes, the principal vector of W. bancrofti in Pondicherry, feeding on such a person (L3 from bloodmeal) is described by the following hyperbolic function (Subramanian et al. 1998),

with parameter values in Table 1.

This relationship saturates at φ/ζ at high human Mf densities and has an initial slope of φ. Because of this saturation, the development of the parasite in the vector is one of the density regulation mechanisms in the transmission of the parasite.
The number of L3-stage larvae released per mosquito bite (L3) depends on this relationship between Mf-density in human and L3 developing in a mosquito, and also on a number of mosquito-related factors, such as the survival of the mosquitoes between the uptake of microfilariae and the development to the L3-stage under natural conditions, the fraction of mosquitoes that is potentially infectious (i.e. taking into account that some mosquitoes never had a bloodmeal before), and the probability that a L3-larva will actually be released during the act of biting. These mosquito-related factors have been combined in the factor v. Since v and sr are linear multiplication factors in the same sequence of calculations, we decided to arbitrarily fix the proportion v at 0·1, and estimate sr. The average number of infective larvae L3 released per mosquito-bite is calculated as a population average, by weighting each person with his or her relative exposure.
An individual's relative exposure to bites depends on his/her age, but there is also inter-individual variability. We assume the following relation between age and exposure: at birth a person has a relative exposure of E0, and thereafter it increases linearly until age amax at which a maximum exposure is reached, which remains at this level for the remainder of life. The variation in mosquito bites between individuals is captured by a personal ‘exposure index’. This exposure index is assumed to be a life-long characteristic of a person. Its value is randomly selected from a gamma probability distribution with mean=1 and shape-parameter αE. This gamma-distribution allows for persons to have low or very low relative exposure, but it does not allow for zero exposure. We therefore consider an additional parameter, the fraction f0 of persons that is never exposed to the bites of mosquitoes. We assume that males and females are equally exposed to mosquito bites.
The monthly transmission potential (mtp) is defined as the number of incoming L3 larvae per person per month, which varies between individuals and over time. The transmission potential is calculated as the product of the average monthly biting rate (mbr, number of mosquito-bites per month for an adult person), the relative exposure to bites of this person, and the average number of infective L3 released per mosquito-bite into a human host. Only a fraction of the larvae that entered the human body will survive the larval stages and develop into mature adult worms. This brings us back to the monthly force-of-infection, which depends on the monthly transmission potential, on the proportion (sr) of inoculated larvae that will survive the L3 and L4 stages, and on the individual's level of immunity to L3-larvae, which may vary between 0 (no immunity) and 1 (full immunity, no larva will survive).
Immune-regulation of parasite numbers
In LYMFASIM we assume two mechanisms for the working of the immune system on the dynamics of the parasite: anti-L3 immunity and anti-fecundity immunity. Anti-L3 immunity is triggered by exposure to L3-antigens and reduces the success of inoculated L3-larvae to mature in the human body. This mechanism is proposed on the basis of work by Day et al. (1991a,b) who found, among people followed for one year, an increase in antibodies to the L3 surface mainly in subjects aged 20 years and older i.e. subjects with the longest history of L3-inoculation. Beuria et al. (1995) also found an age-specific increase in the presence of antibodies and further concluded that antibody levels were highly variable between individuals. Further, a recent study showed that the prevalence of antibodies to L3 surface antigens was higher among amicrofilaraemic persons with or without antigenaemia than in subjects with microfilaraemia (Helmy et al. 2000). Several other epidemiological studies also provide indirect evidence for the possible role of acquired immunity in regulating filarial infections (Vanamail et al. 1989; Das et al. 1990; Bundy & Medley, 1992; Michael & Bundy, 1998, Michael et al. 2001a). However, the above field observations (Beuria et al. 1995; Day et al. 1991a,b) corroborate the evidence from laboratory studies on cat-Brugia pahangi (Denham et al. 1972, 1983; Grenfell, Michael & Denham, 1991; Michael et al. 1998; Devaney & Osborne, 2000) and jird-Acanthocheilonema viteae (Eisenbeiss, Apfel & Meyer, 1994; Bleiss et al. 2002) models that immunity acts against re-infection.
Anti-fecundity immunity reflects that prolonged presence of adult parasites may cause a breakdown in tolerance to the parasites, resulting in clearance of microfilariae and progress of disease (Maizels & Lawrence, 1991). Whether and to what extent the adult worms or the microfilariae are the target of this response is not yet clear. In the model we assume that the immune response causes a reduction in Mf production.
The modelling of these two types of immunity is similar (see Fig. 1), and is analogous to Woolhouse's (1992) ‘larval antigens, anti-larval response (LL)’ and ‘adult worm antigens, anti-egg response (AE)’ models. In the following, those parameters referring to the anti L3-immunity and the anti-fecundity models are denoted by, respectively, attaching a suffix l or w to the corresponding symbols. Cumulative ‘experience’ (H) of, respectively, L3 infection (Hl) and adult worm infection (Hw) determines the level of immunity, Rl and Rw. Loss of experience is governed by THl and THw, the half-life (in years) of experience of infection in the absence of boosting. The factor γ (‘strength of immunity’) translates the experience of infection into an immune response (γl and γw). The immune responsiveness levels Rl and Rw vary between individuals according to a gamma-probability distribution with mean 1 and shape-parameters αl and αw. A list and definitions of the model variables and parameter values for which we use external sources (observations, experiments, and literature), or for which we simply fixed the value within plausible ranges is given in Table 1. Table 2 summarizes the parameters estimated from fitting the models to the Pondicherry data.
Table 2. Parameters of LYMFASIM describing the transmission dynamics of Wuchereria bancrofti in humans and their estimated values arising from the fit of models with and without immunity (Units are in years unless otherwise stated. The sign ‘—’ denotes parameters that are not included in a particular model. Values in parentheses are 95% confidence boundaries for the duration of the immunological memory, success ratio and the estimates for the strength of the immune-response corresponding to lower and upper boundaries of the duration of immunological memory.)

Model quantification
The population of Pondicherry in 1981 is simulated by quantifying the life-table and human fertility from statistics for that year (Registrar General of India & Census Commissioner, 1981). The values for the monthly biting rate (mbr, see Fig. 2) during the vector management programme were estimated from fortnightly collection of human landing mosquitoes in one site in Pondicherry (Ramaiah et al. 1992). The mbr was used to assess the seasonal effect on vector population and also to monitor the impact of integrated vector management. Entomological observations indicated that the vector management programme has achieved a large reduction in transmission but did not achieve a total interruption (Ramaiah et al. 1992): within 2 years the annual infective biting rate was reduced by 86% and in 4 years by 94%; the average annual infective biting rate during the programme period was 45, compared to 228 prior to its start (80% reduction). Assuming that the observed pre-control monthly biting rate is representative for the situation in Pondicherry prior to the year 1981, we fixed the monthly biting rate at 2200 per adult person for the period before the start of vector management and after its cessation.

Fig. 2. Observed monthly biting rate in Pondicherry over the period 1980–1986.
Simulations are always started 150 years before 1981 in order to ensure an equilibrium age-composition of the human population and a dynamic equilibrium for the parasite population. The two types of immune response are considered in separate models. The parameters for the anti-L3 immunity are estimated by assuming that there is no anti-fecundity immunity, and vice versa. Adding the possibility of no immune-regulation, we have three versions of the full LYMFASIM model: anti-L3 immunity model, anti-fecundity immunity model, and no-immunity model.
Data
Epidemiological data are from the five-year Integrated Vector Management programme in Pondicherry. Surveys were carried out right before and after the completion of the programme (in 1981 and 1986). Details of sampling design and parasitological data collection are given by Rajagopalan et al. (1989) and Subramanian et al. (1989b). Mf-counts in 20 μl blood smears for both 1981 and 1986 are available for a cohort of 5071 persons. To enable a comparison of simulation results with the observations, the longitudinal data are represented as age-specific cross-tabulations of the Mf-count in 1981 versus the Mf-count in 1986 (Table 3). Data on overall Mf prevalence in 1989 and 1992 (Manoharan et al. 1997) are used for a first validation of the model.

Goodness-of-fit
Simulation results from the three models are compared with data for each of the cells in Table 3. The agreement between observed and simulated data is assessed by the following statistic,
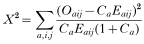
with: Oaij: Observed no. of persons in age-class a (3–7, 8–10, etc.) of whom the Mf-count in 1981 was in class i (0, 1–5, or >5 Mf per smear) and the Mf-count in 1986 was in class j. Eaij: See Oaij, for the simulated population. Ca: Oa/Ea, with Oa total observed and Ea total simulated no. of persons in age-class a.
In some age-classes, cells with i and j combinations have been merged to ensure that they comprise at least 5 observed individuals. The factor (1+Ca) in the denominator accounts for the stochastic variation in the simulated population (i.e. the ‘expected’ number is derived from a finite simulated population; with increasing simulation size, Ca approaches zero).
A P-value for the goodness-of-fit is calculated by assuming that X2 follows a χ2-distribution with D.F.=42 for models with anti-L3 or anti-fecundity immunity, and D.F.=44 for the model without immunity. The number of degrees of freedom is derived from the number of cells in Table 3 (72), minus the number of cells combined with other cells to ensure a minimum of 5 persons in each (combined) cell (12), minus the number of age-groups (8), minus the number of parameters to be estimated on the basis of the data (10 for the immunity models and 8 for the model without immunity). P-values >0·05 are taken to indicate a satisfactory agreement between estimations and observed data.
Due to the stochastic nature of the various processes involved in the model, the simulation output will be subject to random variation and will only represent an estimate of the true outcomes of the model. As a compromise between random variation and computing time for each version of the model (no immunity, anti-L3 or anti-fecundity immunity) a maximum of 1500 simulation runs was carried out and the total number of individuals per simulation run is approximately 50000.
As a result of variability in simulation output the standard estimation procedures (e.g. maximum likelihood estimation) are not applicable. Instead parameters in Table 2 are estimated by minimizing X2 in Eqn. (2) through a downhill-simplex routine (Nelder & Mead, 1965). For the immunity models, a 95% CI was determined for the immunological memory (parameters THl and THw) and for the success ratio (parameter sr) following the method of Plaisier et al. (1995). Starting from the best-fitting values of these parameters, alternative lower and higher values are tested and the other parameters re-estimated. Those values that result in a X2-difference of approximately 3·84 (95th percentile of a χ2-distribution with D.F.=1) are considered to be the CI-boundaries.
RESULTS
Goodness-of-fit of models with and without immunity
Table 2 gives a complete list of the estimated parameters and their values in the different models. The two immunity models and the model without immunity have all been fitted to the cross-tabulated 1981 and 1986 Mf-counts of the people in Vector management area (Table 3 and Fig. 3). Figure 3 shows the observed and predicted Mf distributions before (1981) and after (1986) vector control. Results in terms of age-specific prevalence, incidence and loss of infection are shown in Fig. 4. The goodness-of-fit was satisfactory for both the anti-L3 (X2=49·5; D.F.=42; P=0·20) and the anti-fecundity immunity model (X2=48·8; D.F.=42; P=0·22); no good agreement with the data was obtained for the model without immunity (X2=117·9; D.F.=44; P<0·001).

Fig. 3. Observed and simulated distributions for the number of Mf per blood smear in the IVM programme in 1981 and 1986. The upper graph shows the percentages of persons that were Mf-negative in 1981 and that showed 0, 1–5 or [ges ]6 Mf per blood smear in 1986. The middle graphs apply to persons with 1–5 Mf in 1981, etc. Values are shown for all age-classes combined. The simulation outcomes of the 3 models with and without immunity are standardized to the age-distribution of the observed cohort.

Fig. 4. Observed (dots) and simulated age-specific Mf-prevalence (in 1981 and 1986, A and B respectively), incidence of infection (% of Mf-negatives in 1981 that were positive in 1986, C) and loss of infection (% of Mf-positives in 1981 that were Mf-negative in 1986, D). The solid line is the prediction with anti-L3 immunity model, the dashed line applies to anti-fecundity immunity model, the dot-dashed line to model with no-immunity and the bars are 95% confidence limits for the prevalence calculated using normal approximation to binomial distribution.
The model without immunity had difficulty in fitting the relatively low pre-control Mf prevalence; a prevalence of 8·5% could only be reproduced by assuming that nearly two-thirds of the population was not exposed (f0=0·64), which is very unlikely given the ubiquity of the mosquito vector, C. quinquefasciatus. Also, this model failed to reproduce the observed decline in Mf prevalence after the age of 20 (Fig. 4).
The two models with immunity show a satisfactory fit to the low overall Mf prevalence and the age-specific data on prevalence, incidence and loss-of-infection (Fig. 4). For this fit, a long immunological memory of about 10 years is needed for both the anti-L3 and the anti-fecundity model. The values of the other parameters in Table 2 will be addressed in the discussion section.
Prevalence of Mf and adult worms
Figure 5 compares the prevalence of adult (male or female) worms for the immunity models with the Mf prevalence. In both models, the worm-prevalence (dashed line) is much higher than the Mf-prevalence as determined by a blood-smear (solid line). For the anti-L3 immunity model, the main reason for this difference is the presence of single-sex infections (Fig. 5A). Production of Mf will only occur in hosts that harbour at least one female and one male worm. The percentage of persons that satisfy this condition is depicted in Fig. 5A (dot-dashed line). The difference between the proportion of people harbouring both male and female worms and the simulated Mf prevalence is mainly caused by the occurrence of negative counts at low Mf-densities because of the variability of the number of Mf counted in a blood-smear of 20 μl. The difference between adult worm-prevalence and Mf-prevalence is larger for the anti-fecundity immunity model (Fig. 5B), which is caused by the anti-fecundity response.

Fig. 5. Simulated age-specific Mf-prevalence (in 1981; solid line), prevalence of persons with at least one adult worm (dashed line) and prevalence of persons with at least one male and at least one female worm (dot-dashed line). Predictions of the models with anti-L3 (A) and anti-fecundity immunity (B).
Confidence intervals
In estimating the confidence boundaries for the duration of immune responsiveness (THl and THw), the remaining parameters listed in Table 2 were re-estimated for each value of the duration, optimizing the goodness of fit. The sensitivity of the remaining parameter values to the value of the duration of immunological memory is as follows. The strength of immunity (parameters γl and γw) decreases approximately hyperbolically with increasing memory duration, indicating that the strength and duration compensate for each other in a multiplicative way. The values for other parameters (data not shown) listed in Table 2 remained virtually unchanged. The 95% CI indicates that neither a very short (under 5 years) nor a very long (over 18 years) duration of immunity is in agreement with the data and that the duration of immunity does not differ significantly between the two types of immunity. We also determined the confidence intervals for the success ratio (Table 2).
Long-term predictions
In order to explore the predictive validity of the immunity models, the trends in prevalence after cessation of the vector control are also assessed (Fig. 6). The observations (circles) are for the entire surveyed population in 1981, 1986, 1989 and 1992 in the integrated vector management area. The predicted prevalence is standardized to the age-distribution in the 1981 population. Both models predict the continuing down-going trend during the first few years after cessation of vector control, but the anti-L3 immunity gives the most accurate prediction. There are no data to check the long-term model prediction of a rapid increase in prevalence.

Fig. 6. Predicted and observed trend in the Mf-prevalence (% of persons with a positive blood smear). Lines: predicted Mf-prevalence for the anti-L3 immunity model (solid line) and anti-fecundity immunity model (dashed line). Circles: observed prevalence levels in 1981 (8·9%), 1986 (6·4%), 1989 (5·2%) and in 1992 (4·8%). Window bar highlights the duration of the integrated vector management programme (1981–1986). Bars are 95% confidence limits calculated using normal approximation to binomial distribution.
DISCUSSION
In this paper we analysed longitudinal data describing the impact of a 5-year integrated vector management programme on the intensity and prevalence of W. bancrofti infection in Pondicherry, India. The analysis helped us to gain further insight into the dynamics of the parasite in the human host. Emphasis was put to arrive at plausible estimates for the duration of immunological memory. Further, the analysis rendered a model that can be used for evaluation and prediction of the effects of vector management and other control measures including mass chemotherapy.
Immune-regulation of parasite numbers
Immune regulation in lymphatic filariasis is complex (Ottesen, 1992; Piessens, 1981), and it is not yet known how the immune system regulates parasite density in the human host. To cover this uncertainty, we considered two immunity-models that have been proposed for helminth infection by Woolhouse (1992), i.e. anti-L3 and anti-fecundity immunity.
Immune regulation appeared essential in describing the observed Mf-distribution in Pondicherry. A model without immunity failed to explain the decreasing prevalence levels in older age groups. Our conclusions on the role of acquired immunity critically depend on the ability of the models to explain the observed age-specific data. As was shown in previous studies, models with immunity can reproduce a peak in the age-prevalence curve (Fulford et al. 1992; Woolhouse, 1992). The position of the peak-age, its height, and the declining trend after the peak depend on the present and past transmission intensity, the worm life-span, the strength of the immune response and the duration of the immunological memory (Anderson & May, 1985).
The data from Pondicherry did not allow us to distinguish between the two types of immunity: both models could reproduce the observed data on Mf prevalence and intensity equally well. The anti-L3 type of immunity was found compatible with cross-sectional data from Pondicherry and other areas (Day et al. 1991b; Beuria et al. 1995; Chan et al. 1998; Michael & Bundy, 1998; Michael et al. 2001a), and is supported by data from animal infection experiments (Grenfell et al. 1991; Denham et al. 1992; Michael et al. 1998). The anti-fecundity immunity assumption has not previously been applied in lymphatic filariasis, and it remains to be seen whether it could also explain the results obtained in the above-mentioned studies.
Because the two immunity models predicted different age-specific patterns of adult worm-prevalence, an indication of their suitability to mirror observations could be obtained by comparing predicted adult worm prevalence with observed prevalence of circulating filarial antigen. The latter reflects the presence of live adult worms by detecting the presence of their excretory/secretory antigens. The Pondicherry dataset does not include data on antigenaemia, since this test was not available at the time of data-collection, but several other studies present age-specific data on Mf and antigen prevalence (Lammie, Hightower & Eberhard, 1994; Ramzy et al. 1994; Chanteau et al. 1995; Itoh et al. 1999; Sunish et al. 2001, 2002; Weerasooriya et al. 2002). These studies generally show a much higher prevalence of antigenaemia than of microfilaraemia, although the patterns of Mf and antigen prevalence by age are more or less similar. These observations are more consistent with the results of the anti-L3 immunity model than with the results of the anti-fecundity immunity model (Fig. 5).
Our analysis suggests that the decay of immunity after interruption of transmission is slow: it takes about 10 years to reduce the ‘experience of infection’ by 50%. How this translates into levels of herd immunity depends on the pre-control level of immunity in the population and the variation between individuals (Anderson & May, 1985).
Alternative explanations of a convex pattern of infection intensity by age are possible, such as a decrease in exposure to infection in older groups ( Fulford et al. 1992; Duerr, Dietz & Eichner, 2003) or mechanisms that reduce the probability of an incoming larva to develop into mature adult worms at older ages (Michael et al. 1998). These alternative mechanisms have not been examined in this paper, since most studies have stressed the possible role of acquired protective immunity (Bosshardt et al. 1991; Day et al. 1991a,b; Maizels & Lawrence, 1991; Beuria et al. 1995; Simonsen, 1985; Simonsen & Meyrowitsch, 1998; King, 2001).
Life-span
Our analysis also yielded an estimate of the life-span of W. bancrofti in the human host. The mean life-span of W. bancrofti in the human host was estimated to vary between 10 and 12 years in the present study, including the 8-month immature period. These estimates lie within the range of previous estimates, which varied from 8 to 15 years (Jachowski, Otto & Wharton, 1951; Conn & Greenslit, 1952; Manson-Bahr, 1959; Leeuwin, 1962; Nelson, 1966; Hairston & Jachowski, 1968; Mahoney & Aiu, 1970), but is about twice as high as the estimate by Vanamail et al. (1989, 1996), which was based on the same data. The reason for our longer life-span estimate is that we took the possibility of false negative counts in 1981 and 1986 into account. What naively is counted as loss or acquisition of infection between 1981 and 1986 is often the consequence of false negative counts. By neglecting the possibility of false-negatives, Vanamail et al. (1989, 1996) estimated a short duration in view of the observed high frequency of apparent loss and acquisition of infections.
Individual variation
A good fit of the immunity models to the data was achieved only by assuming considerable between-person variability in exposure to the vector and in immune response, and by allowing for sampling variation in the number of Mf counted in a 20 μl night blood sample at a given true Mf-density (Sasa, 1976). A significantly worse fit is obtained if one of these sources of variation is ignored.
The existence of exposure variation has been demonstrated by a study in Egypt, which revealed a positive association between the presence of microfilaraemia and residing in houses located near vacant land where Culex biting rates were higher (Gad et al. 1994). Recent results also suggest wide inter-individual variation in exposure to mosquito bites, as measured by matching mosquito blood-meals with human blood samples using the polymerase chain reaction (PCR) technique (Michael et al. 2001b). Our estimate suggests that the monthly biting rate in Pondicherry for individuals aged [ges ]20 years could vary between 100 and 4000.
Mf-counts are highly variable between smears from an individual. This variability in Mf counts can result from several sources: variations in blood sampling time (Sasa, 1976; Simonsen, Niemann & Meyrowitsch, 1997), short-term variation in Mf-density (Rachou, 1954, 1955; Pichon et al. 1981), sampling variability (Southgate & Hamilton, 1974; Sasa, 1976; Pichon et al. 1980; Park, 1988; Das et al. 1990; Dreyer et al. 1996; Grenfell et al. 1990; Simonsen et al. 1997), and variability in counting Mf. An important implication is that the false negative rate is a function of the Mf-density (the mean of the distribution of Mf in an individual). In terms of our estimated km (0·33) value, and for persons with (true) mean densities of 5, 10 and 20 Mf/20 μl, the probability of finding (false) zero Mf-counts according to the negative binomial distribution would be 40, 32 and 26%, respectively (

). Analysis of Mf frequency distributions among human populations in Pondicherry showed that about 5% of the Mf-negatives were in fact false-negatives, and that the proportion of false negatives varied between 5 and 20% for different age-classes (Das et al. 1990). Thus, the potential for false negative counts may be considerable (Grenfell et al. 1990).
Long-term predictions
The model predictions are in agreement with the observations during the first few years after cessation of control, especially those of the anti-L3 immunity model (Fig. 6). In a sensitivity analysis, it appeared that the post-control results could also be predicted with a slightly longer immunological memory for the anti-L3 model and a shorter memory for the anti-fecundity model. Otherwise, the predictions become inaccurate. Because entomological observations suggest that stopping the integrated vector management programme has resulted in a return of the vector to pre-control densities (Das et al. 1992), we assumed that from 1986 onwards the mbr returned to the pre-control level of 2200 bites/adult/month. The most striking difference between the models is the more pronounced decline and subsequent increase in Mf prevalence predicted by the anti-fecundity immunity model. Both models predict that about 25 years after cessation of vector control the Mf-prevalence would reach the pre-control level of 1981. After this period the prevalence continues to increase beyond the pre-control level returning to this level after about 65 years. Although long-term predictions with a model that is based on 5 years of observations should be considered with caution, the predictions do illustrate the impact of loss of immunity by showing this (damped) oscillation. The higher peak with the anti-fecundity immunity model is not surprising if we realize that, as a result of a reduced transmission, many persons will have lost all their worms and, hence, boosting will be completely interrupted in these persons. Also, the reduced transmission may result in a much longer period before a newborn child acquires his/her first worm, i.e. the moment that the build-up of immunity starts. In anti-L3 immunity model, boosting (rate of inoculation of L3-larvae) is not interrupted but reduced to lower values and this reduction applies to all individuals in the population.
Model validation and generalization
The next step in the development of LYMFASIM is to validate the fitted models. Necessarily, the model is a simplified representation of reality and several aspects related to transmission of infection in a dynamic population have not been considered, such as mobility of the human and vector population or focality of transmission.
We focussed on the role of acquired immunity in regulating infection intensity in the human host. Two alternative immunity models were in agreement with the longitudinal data from Pondicherry. To assess the validity of these models and their implication for the role of immunity, it is necessary to test the models against independent data sets from a range of endemic areas. Such a study is also necessary because of the different epidemiological patterns observed in Pondicherry and in other areas. In Pondicherry, the prevalence and intensity curves depict a convex relationship with age (monotonic increase over the age range 0–20 years and a declining trend in adults). In many places, though, the age-prevalence curves are better described by a saturating non-linear pattern (increasing in children until a stable prevalence is reached at adult age, see for example, Kumar & Chand, 1990; Kar, Mania & Kar, 1993; Gyapong, Magnussen & Binka, 1994; Kumar, Dash & Mansing, 1994; Lammie et al. 1994; Meyrowitsch, Simonsen & Makunde, 1995; Kazura et al. 1997). While the convex-pattern is suggestive of the role of acquired immunity or a decrease in exposure with increasing age, the saturating non-linear pattern could merely reflect the balance between gain and loss of infection due to natural death of parasites or age-dependent exposure levels until at adult age the exposure level is constant (Duerr et al. 2003).
Application of LYMFASIM to other areas would demand adaptation to the local epidemiological situation, taking differences in the vector-parasite combination and individual heterogeneity in exposure to mosquito biting into account. C. quinquefasciatus is the principal vector of W. bancrofti infection in Pondicherry. The non-linear saturating relationship between numbers of W. bancrofti L3 developed in C. quinquefasciatus and human Mf-density is one of the important regulating mechanisms considered in LYMFASIM. Therefore application of LYMFASIM to other areas where the vector or parasite species are different would require re-quantification of this relationship. If the parasite species is the same but the vector is different, most of the parameters describing the dynamics of parasites in human (success ratio, Mf-production, variation in smear count, lifespan of the parasite) may not differ very much. Heterogeneity in exposure to mosquito biting is expected to vary between areas, and hence would have to be re-quantified.
CONCLUSION
In order to explain the dynamics of W. bancrofti infection in Pondicherry, immune regulation and inter-individual variations in both exposure and immunity are necessary. Our analyses rendered quantified models that can be used to prospectively evaluate the effectiveness of various control strategies. Indeed, the models have already been used to simulate the effects of mass treatment programmes in Pondicherry and to assess the probability of elimination in relation to population coverage and the number of treatment rounds (Stolk et al. 2003). The robustness of the model in other situations has yet to be assessed, as the urban Pondicherry epidemiological pattern may not be applicable.
We are greatly indebted to the late Dr Vijai Dhanda, former Director of Vector Control Research Centre, Pondicherry for his encouragement and support. S. Subramanian received support from the special programme UNDP/World Bank/WHO for Research and Training in Tropical Diseases (ID: 920743 and 950247).
References
REFERENCES
ANDERSON, R. M. &
MAY, R. M.
(1985).
Herd immunity to helminth infection and implications for parasite control.
Nature, London 315, 493–496.CrossRefGoogle Scholar
BEURIA, M. K.,
BAL, M.,
DASH, A. P. &
DAS, M. K.
(1995).
Age-related prevalence of antibodies to infective larvae of Wuchereria bancrofti in normal indivduals from a filaria endemic region.
Journal of Biosciences 20, 167–174.CrossRefGoogle Scholar
BLEISS, W.,
OBERLANDER, U.,
HARTMANN, S.,
ADAM, R.,
MARKO, A.,
SCHONEMEYER, A. &
LUCIUS, R.
(2002).
Protective immunity induced by irradiated third-stage larvae of the filaria Acanthocheilonema viteae is directed against challenge third-stage larvae before molting.
Journal of Parasitology 88, 264–270.CrossRefGoogle Scholar
BOSSHARDT, S. C.,
McVAY, C. S.,
COLEMAN, S. U. &
KLEI, T. R.
(1991).
Brugia pahangi: circulating antibodies to adult worm antigens in uninfected progeny of homologously infected female jirds.
Experimental Parasitology 72, 440–449.CrossRefGoogle Scholar
BUNDY, D. A. &
MEDLEY, G. F.
(1992).
Immuno-epidemiology of human geohelminthiasis: ecological and immunological determinants of worm burden.
Parasitology 104, S105–S119.CrossRefGoogle Scholar
CHAN, M. S.,
SRIVIDYA, A.,
NORMAN, R. A.,
PANI, S. P.,
RAMAIAH, K. D.,
VANAMAIL, P.,
MICHAEL, E.,
DAS, P. K. &
BUNDY, D. A.
(1998).
Epifil: a dynamic model of infection and disease in lymphatic filariasis.
American Journal of Tropical Medicine and Hygiene 59, 606–614.CrossRefGoogle Scholar
CHANTEAU, S.,
GLAZIOU, P.,
PLICHART, C.,
LUQUIAUD, P.,
MOULIA PELAT, J. P.,
N'GUYEN, L. &
CARTEL, J. L.
(1995).
Wuchereria bancrofti filariasis in French Polynesia: age-specific patterns of microfilaraemia, circulating antigen, and specific IgG and IgG4 responses according to transmission level.
International Journal of Parasitology 25, 81–85.CrossRefGoogle Scholar
CONN, H. C. &
GREENSLIT, F. S.
(1952).
Filariasis residuals in veterans with report of a case of microfilaremia.
American Journal of Tropical Medicine and Hygiene 1, 474–476.CrossRefGoogle Scholar
DAS, P. K.,
MANOHARAN, A.,
SRIVIDYA, A.,
GRENFELL, B. T.,
BUNDY, D. A. &
VANAMAIL, P.
(1990).
Frequency distribution of Wuchereria bancrofti microfilariae in human populations and its relationships with age and sex.
Parasitology 3, 429–434.CrossRefGoogle Scholar
DAS, P. K.,
MANOHARAN, A.,
SUBRAMANIAN, S.,
RAMAIAH, K. D.,
PANI, S. P.,
RAJAVEL, A. R. &
RAJAGOPALAN, P. K.
(1992).
Bancroftian filariasis in Pondicherry, south India – epidemiological impact of recovery of the vector population.
Epidemiology and Infection 108, 483–493.CrossRefGoogle Scholar
DAS, P. K.,
SRIVIDYA, A.,
PANI, S. P.,
RAMAIAH, K. D.,
VANAMAIL, P. &
DHANDA, V.
(1994).
Cumulative exposure and its relationship with chronic filarial disease in bancroftian filariasis.
Southeast Asian Journal of Tropical Medicine and Public Health 25, 516–521.Google Scholar
DAY, K. P.,
GRENFELL, B.,
SPARK, R.,
KAZURA, J. W. &
ALPERS, M. P.
(1991 a).
Age specific patterns of change in the dynamics of Wuchereria bancrofti infection in Papua New Guinea.
American Journal of Tropical Medicine and Hygiene 44, 518–527.Google Scholar
DAY, K. P.,
GREGORY, W. F. &
MAIZELS, R. M.
(1991 b).
Age-specific acquisition of immunity to infective larvae in a bancroftian filariasis endemic area of Papua New Guinea.
Parasite Immunology 13, 277–290.Google Scholar
DENHAM, D. A.,
PONNUDURAI, T.,
NELSON, G. S.,
ROGERS, R. &
GUY, F.
(1972).
Studies with Brugia pahangi. II. The effect of repeated infection on parasite levels in cats.
International Journal of Parasitology 2, 401–407.Google Scholar
DENHAM, D. A.,
McGREEVY, P. B.,
SUSWILLO, R. R. &
ROGERS, R.
(1983).
The resistance to re-infection of cats repeatedly inoculated with infective larvae of Brugia pahangi.
Parasitology 86, 11–18.CrossRefGoogle Scholar
DENHAM, D. A.,
MEDEIROS, F.,
BALDWIN, C.,
KUMAR, H.,
MIDWINTER, I. C.,
BIRCH, D. W. &
SMAIL, A.
(1992).
Repeated infection of cats with Brugia pahangi: parasitological observations.
Parasitology 104, 415–420.CrossRefGoogle Scholar
DEVANEY, E. &
OSBORNE, J.
(2000).
The third-stage larva (L3) of Brugia: its role in immune modulation and protective immunity.
Microbes and Infection 2, 1363–1371.CrossRefGoogle Scholar
DREYER, G.,
PIMENTAEL, A.,
MEDEIROS, Z.,
BELIZ, F.,
MOURA, I.,
COUTINHO, A.,
DE ANDRADE, L. D.,
ROCHA, A.,
DA SILVA, L. M. &
PIESSENS, W. F.
(1996).
Studies on the periodicity and intravascular distribution of Wuchereria bancrofti microfilariae in paired samples of capillary and venous blood from Recife, Brazil.
Tropical Medicine and International Health 1, 264–272.CrossRefGoogle Scholar
DUERR, H. P.,
DIETZ, K. &
EICHNER, M.
(2003).
On the interpretation of age-intensity profiles and dispersion patterns in parasitological surveys.
Parasitology 126, 87–101.CrossRefGoogle Scholar
EISENBEISS, W. F.,
APFEL, H. &
MEYER, T. F.
(1994).
Protective immunity linked with a distinct developmental stage of a filarial parasite.
Journal of Immunology 152, 735–742.Google Scholar
FULFORD, A. J.,
BUTTERWORTH, A. E.,
STURROCK, R. F. &
OUMA, J. H.
(1992).
On the use of age-intensity data to detect immunity to parasitic infections, with special reference to Schistosoma mansoni in Kenya.
Parasitology 105, 219–227.CrossRefGoogle Scholar
GAD, A. M.,
FEINSOD, F. M.,
SOLIMAN, B. A.,
NELSON, G. O.,
GIBBS, P. H. &
SHOUKRY, A.
(1994).
Exposure variables in bancroftian filariasis in the Nile Delta.
Journal of the Egyptian Society of Parasitology 24, 439–455.Google Scholar
GRENFELL, B. T.,
DAS, P. K.,
RAJAGOPALAN, P. K. &
BUNDY, D. A.
(1990).
Frequency distribution of lymphatic filariasis microfilariae in human populations: population processes and statistical estimation.
Parasitology 101, 417–427.CrossRefGoogle Scholar
GRENFELL, B. T.,
MICHAEL, E. &
DENHAM, D. A.
(1991).
A model for the dynamics of human lymphatic filariasis.
Parasitology Today 7, 318–323.CrossRefGoogle Scholar
GYAPONG, J. O.,
MAGNUSSEN, P. &
BINKA, F. N.
(1994).
Parasitological and clinical aspects of bancroftian filariasis in Kassena-Nankana District, upper east region, Ghana.
Transactions of the Royal Society of Tropical Medicine and Hygiene 88, 555–557.CrossRefGoogle Scholar
HABBEMA, J. D. F.,
DE VLAS, S. J.,
PLAISIER, A. P. &
VAN OORTMARSSEN, G. J.
(1996).
The microsimulation approach to epidemiologic modeling of helminthic infections, with special reference to schistosomiasis.
American Journal of Tropical Medicine and Hygiene 55, 165–169.CrossRefGoogle Scholar
HAIRSTON, N. G. &
JACHOWSKI, L. A.
(1968).
Analysis of the Wuchereria bancrofti population in the people of American Samoa.
Bulletin of the World Health Organization 38, 29–59.Google Scholar
HELMY, H.,
WEIL, G. J.,
FARIS, R.,
GAD, A. M.,
CHANDRASHEKAR, R.,
ASHOUR, A. &
RAMZY, R. M.
(2000).
Human antibody responses to Wuchereria bancrofti infective larvae.
Parasite Immunology 22, 89–96.CrossRefGoogle Scholar
ISHAM, V. &
MEDLEY, G.
(1996).
Models for infectious human diseases. Their structure and relation to data. In
Publications of the Newton Institute, Vol. 6 (ed. Wright, J.), pp. 1–514. Cambridge University Press, Cambridge.CrossRef
ITOH, M.,
WEERASOORIYA, M. V.,
GUNAWARDENA, N. K.,
MUDALIGE, M. P.,
SAMARAWICKREMA, W. A. &
KIMURA, E.
(1999).
Wuchereria bancrofti antigenaemia in Sri Lanka.
Tropical Medicine and International Health 4, 207–210.CrossRefGoogle Scholar
JACHOWSKI, L. A.,
OTTO, G. F. &
WHARTON, J. D.
(1951).
Filariasis in American Samoa 1. Loss of microfilaria in the absence of continued reinfection.
Proceedings of the Helminthological Society of Washington 18, 25–28.Google Scholar
KAR, S. K.,
MANIA, J. &
KAR, P. K.
(1993).
Prevalence of lymphatic nodule in a bancroftian endemic population.
Acta Tropica 55, 53–60.CrossRefGoogle Scholar
KAZURA, J. W.,
BOCKARIE, M.,
ALEXANDER, N.,
PERRY, R.,
BOCKARIE, F.,
DAGORO, H.,
DIMBER, Z.,
HYUN, P. &
ALPERS, M. P.
(1997).
Transmission intensity and its relationship to infection and disease due to Wuchereria bancrofti in Papua New Guinea.
Journal of Infectious Diseases 176, 242–246.CrossRefGoogle Scholar
KING, C. L.
(2001).
Transmission intensity and human immune responses to lymphatic filariasis.
Parasite Immunology 23, 363–371.CrossRefGoogle Scholar
KUMAR, A. &
CHAND, S. K.
(1990).
Prevalence of Wuchereria bancrofti infection in some coastal villages of Ganjam, Orissa.
Journal of Communicable Diseases 22, 209–212.Google Scholar
KUMAR, A.,
DASH, A. P. &
MANSING, G. D.
(1994).
Prevalence of filariasis in rural Puri, Orissa.
Journal of Communicable Diseases 26, 215–220.Google Scholar
LAMMIE, P. J.,
HIGHTOWER, A. W. &
EBERHARD, M. L.
(1994).
Age-specific prevalence of antigenaemia in a Wuchereria bancrofti-exposed population.
American Journal of Tropical Medicine and Hygiene 51, 348–355.CrossRefGoogle Scholar
LEEUWIN, R. S.
(1962).
Microfilaraemia in Surinamese living in Amsterdam.
Tropical Geographical Medicine Amsterdam 14, 355–360.Google Scholar
MAHONEY, L. E., Jr. &
AIU, P.
(1970).
Filariasis in Samoan immigrants to the United States.
American Journal of Tropical Medicine and Hygiene 19, 629–631.CrossRefGoogle Scholar
MAIZELS, R. M. &
LAWRENCE, R.
(1991).
Immunological tolerance: the key feature in human filariasis?
Parasitology Today 7, 271–276.Google Scholar
MANOHARAN, A.,
DAS, P. K.,
KEERTHISEELAN, V. B. &
RAMAIAH, K. D.
(1997).
Trend in Wuchereria bancrofti infection in Pondicherry urban agglomeration after withdrawal of a five year vector control programme.
Journal of Communicable Diseases 29, 255–261.Google Scholar
MANSON-BAHR, P.
(1959).
The story of Filaria bancrofti. A critical review. Part I. Early history.
Journal of Tropical Medicine and Hygiene 62, 53–61.Google Scholar
MEYROWITSCH, D. W.,
SIMONSEN, P. E. &
MAKUNDE, W. H.
(1995).
Bancroftian filariasis: analysis of infection and disease in five endemic communities of north-eastern Tanzania.
Annals of Tropical Medicine and Parasitology 89, 653–663.CrossRefGoogle Scholar
MICHAEL, E.,
BUNDY, D. A. &
GRENFELL, B. T.
(1996).
Re-assessing the global prevalence and distribution of lymphatic filariasis.
Parasitology 112, 409–428.CrossRefGoogle Scholar
MICHAEL, E. &
BUNDY, D. A.
(1998).
Herd immunity to filarial infection is a function of vector biting rate.
Proceedings of the Royal Society of London, B Biological Sciences 265, 855–860.CrossRefGoogle Scholar
MICHAEL, E.,
GRENFELL, B. T.,
ISHAM, V. S.,
DENHAM, D. A. &
BUNDY, D. A.
(1998).
Modelling variability in lymphatic filariasis: macrofilarial dynamics in the Brugia pahangi-cat model.
Proceedings of the Royal Society of London, B Biological Sciences 265, 155–165.CrossRefGoogle Scholar
MICHAEL, E.,
SIMONSEN, P. E.,
MALECELA, M.,
JAOKO, W. G.,
PEDERSEN, E. M.,
MUKOKO, D.,
RWEGOSHORA, R. T. &
MEYROWITSCH, D. W.
(2001 a).
Transmission intensity and the immunoepidemiology of bancroftian filariasis in East Africa.
Parasite Immunology 23, 373–388.Google Scholar
MICHAEL, E.,
RAMAIAH, K. D.,
HOTI, S. L.,
BARKER, G.,
PAUL, M. R.,
YUVARAJ, J.,
DAS, P. K.,
GRENFELL, B. T. &
BUNDY, D. A.
(2001 b).
Quantifying mosquito biting patterns on humans by DNA fingerprinting of bloodmeals.
American Journal of Tropical Medicine and Hygiene 65, 722–728.Google Scholar
NELDER, J. A. &
MEAD, R.
(1965).
A simplex method of function minimization.
Computer Journal 7, 308–312.CrossRefGoogle Scholar
NELSON, G. S.
(1966).
The pathology of filarial infections.
Helminth Abstract 35, 311–336.Google Scholar
OTTESEN, E. A.
(1992).
The Wellcome Trust Lecture. Infection and disease in lymphatic filariasis: an immunological perspective.
Parasitology 104, S71–S79.Google Scholar
OTTESEN, E. A. &
RAMACHANDRAN, C. P.
(1995).
Lymphatic filariasis infection and disease: control strategies.
Parasitology Today 11, 129–131.CrossRefGoogle Scholar
OTTESEN, E. A.,
DUKE, B. O.,
KARAM, M. &
BEHBEHANI, K.
(1997).
Strategies and tools for the control/elimination of lymphatic filariasis.
Bulletin of the World Health Organization 75, 491–503.Google Scholar
OTTESEN, E. A.,
ISMAIL, M. M. &
HORTON, J.
(1999).
The role of albendazole in programmes to eliminate lymphatic filariasis.
Parasitology Today 15, 382–386.CrossRefGoogle Scholar
PARK, C. B.
(1988).
Microfilaria density distribution in the human population and its infectivity index for the mosquito population.
Parasitology 96, 265–271.CrossRefGoogle Scholar
PICHON, G.,
MERLIN, M.,
FAGNEAUX, G.,
RIVIERE, F. &
LAIGRET, J.
(1980).
[Studies of the numerical distribution of microfilariae in foci of lymphatic filariasis (author's transl).]
Tropenmedizin und Parasitologie 31, 165–180.Google Scholar
PICHON, G.,
RIVIERE, F.,
THIREL, R.,
CHEBRET, M.,
TETUANUI, A. &
TOUDIC, A.
(1981).
[Fluctuations affecting the measurement of microfilaremia (author's transl).] Bulletin de la Societe de Pathologie Exotique Filiales 74, 525–532.Google Scholar
PIESSENS, W. F.
(1981).
Lymphatic filariasis in humans: an immunologic maze.
Annals of Internal Medicine 95, 778–779.CrossRefGoogle Scholar
PLAISIER, A. P.,
VAN OORTMARSSEN, G. J.,
REMME, J. &
HABBEMA, J. D.
(1991).
The reproductive lifespan of Onchocerca volvulus in West African savanna.
Acta Tropica 48, 271–284.CrossRefGoogle Scholar
PLAISIER, A. P.,
ALLEY, E. S.,
BOATIN, B. A.,
VAN OORTMARSSEN, G. J.,
REMME, H.,
DE VLAS, S. J.,
BONNEUX, L. &
HABBEMA, J. D.
(1995).
Irreversible effects of ivermectin on adult parasites in onchocerciasis patients in the Onchocerciasis Control Programme in West Africa.
Journal of Infectious Diseases 172, 204–210.CrossRefGoogle Scholar
PLAISIER, A. P.,
SUBRAMANIAN, S.,
DAS, P. K.,
SOUZA, W.,
LAPA, T.,
FURTADO, A. F.,
VAN DER PLOEG, C. P.,
HABBEMA, J. D. &
VAN OORTMARSSEN, G. J.
(1998).
The LYMFASIM simulation program for modeling lymphatic filariasis and its control.
Methods of Information in Medicine 37, 97–108.Google Scholar
PLAISIER, A. P.,
CAO, W. C.,
VAN OORTMARSSEN, G. J. &
HABBEMA, J. D. F.
(1999).
Efficacy of ivermectin in the treatment of Wuchereria bancrofti infection: a model-based analysis of trial results.
Parasitology 119, 385–394.CrossRefGoogle Scholar
RACHOU, R. G.
(1954).
Daily variation in microfilaraemia due to Wuchereria bancrofti in 27 infected persons observed for 28 consecutive days.
Revista da Brasileira Malariol Doencas Tropical 6, 505–517.Google Scholar
RACHOU, R. G.
(1955).
Variation in microfilaraemia of Wuchereria bancrofti in 25 carriers in Santa Catarina examined for 52 weeks.
Revista da Brasileira Malariol E Doencas Tropical 7, 209–224.Google Scholar
RAJAGOPALAN, P. K.,
DAS, P. K.,
SUBRAMANIAN, S.,
VANAMAIL, P. &
RAMAIAH, K. D.
(1989).
Bancroftian filariasis in Pondicherry, south India: 1. Pre-control epidemiological observations.
Epidemiology and Infection 103, 685–692.Google Scholar
RAMAIAH, K. D.,
DAS, P. K.,
ARUNACHALAM, N.,
RAJAVEL, A. R. &
PAILY, K. P.
(1992).
Observations on population density of Culex quinquefasciatus and transmission indices of Bancroftian filariasis during and after Integrated Vector Management strategy.
Journal of Communicable Diseases 24, 173–184.Google Scholar
RAMZY, R. M.,
HAFEZ, O. N.,
GAD, A. M.,
FARIS, R.,
HARB, M.,
BUCK, A. A. &
WEIL, G. J.
(1994).
Efficient assessment of filariasis endemicity by screening for filarial antigenaemia in a sentinel population.
Transactions of the Royal Society of Tropical Medicine and Hygiene 88, 41–44.CrossRefGoogle Scholar
REGISTRAR GENERAL OF INDIA & CENSUS COMMISSIONER (1981).
Census of India 1981, Series 30 and Series 32, Pondicherry.
Controller of Publications,
New Delhi.
ROCHET, M. J.
(1990).
A simple deterministic model for bancroftian filariasis transmission dynamics.
Tropical Medicine and Parasitology 41, 225–233.Google Scholar
SASA, M.
(1976).
Human filariasis. A Global Survey of Epidemiology and Control. University Park Press, Tokyo.
SIMONSEN, P. E.
(1985).
Wuchereria bancrofti in Tanzania: immune reactions to the microfilarial surface, and the effect of diethylcarbamazine upon these reactions.
Transactions of the Royal Society of Tropical Medicine and Hygiene 79, 852–858.CrossRefGoogle Scholar
SIMONSEN, P. E.,
NIEMANN, L. &
MEYROWITSCH, D. W.
(1997).
Wuchereria bancrofti in Tanzania: microfilarial periodicity and effect of blood sampling time on microfilarial intensities.
Tropical Medicine and International Health 2, 153–158.CrossRefGoogle Scholar
SIMONSEN, P. E. &
MEYROWITSCH, D. W.
(1998).
Bancroftian filariasis in Tanzania: specific antibody responses in relation to long-term observations on microfilaremia.
American Journal of Tropical Medicine and Hygiene 59, 667–672.CrossRefGoogle Scholar
SOUTHGATE, B. A. &
HAMILTON, P. J. S.
(1974).
A quantitative approach to parasitological techniques in bancroftian filariasis and its effect on epidemiological understanding.
Transactions of the Royal Society of Tropical Medicine and Hygiene 68, 177–186.CrossRefGoogle Scholar
SRIVIDYA, A.,
PANI, S. P.,
RAJAGOPALAN, P. K.,
BUNDY, D. A. &
GRENFELL, B. T.
(1991).
The dynamics of infection and disease in bancroftian filariasis.
Transactions of the Royal Society of Tropical Medicine and Hygiene 85, 255–259.CrossRefGoogle Scholar
STOLK, W. A.,
SUBRAMANIAN, S.,
VAN OORTMARSSEN, G. J.,
DAS, P. K. &
HABBEMA, J. D.
(2003).
Prospects of elimination of bancroftian filariasis by mass drug treatment in Pondicherry, India: a simulation study.
Journal of Infectious Diseases 188, 1371–1381.CrossRefGoogle Scholar
SUBRAMANIAN, S.,
VANAMAIL, P.,
RAMAIAH, K. D.,
PANI, S. P.,
DAS, P. K. &
RAJAGOPALAN, P. K.
(1989 a).
A simple deterministic model for host–parasite relationship in Wuchereria bancrofti infection & its relevance to parasite regulation in human host.
Indian Journal of Medical Research 89, 411–417.Google Scholar
SUBRAMANIAN, S.,
PANI, S. P.,
DAS, P. K. &
RAJAGOPALAN, P. K.
(1989 b).
Bancroftian filariasis in Pondicherry, south India: 2. Epidemiological evaluation of the effect of vector control.
Epidemiology and Infection 103, 693–702.Google Scholar
SUBRAMANIAN, S.,
KRISHNAMOORTHY, K.,
RAMAIAH, K. D.,
HABBEMA, J. D.,
DAS, P. K. &
PLAISIER, A. P.
(1998).
The relationship between microfilarial load in the human host and uptake and development of Wuchereria bancrofti microfilariae by Culex quinquefasciatus: a study under natural conditions.
Parasitology 116, 243–255.CrossRefGoogle Scholar
SUNISH, I. P.,
RAJENDRAN, R.,
SATYANARAYANA, K.,
MUNIRATHINAM, A. &
GAJANANA, A.
(2001).
Immunochromatographic test (ICT) for estimation of true prevalence of bancroftian filariasis in an endemic area in southern India.
Transactions of the Royal Society of Tropical Medicine and Hygiene 95, 607–609.CrossRefGoogle Scholar
SUNISH, I. P.,
RAJENDRAN, R.,
MANI, T. R.,
MUNIRATHINAM, A.,
TEWARI, S. C.,
HIRIYAN, J.,
GAJANANA, A. &
SATYANARAYANA, K.
(2002).
Resurgence in filarial transmission after withdrawal of mass drug administration and the relationship between antigenaemia and microfilaraemia-a longitudinal study.
Tropical Medicine and International Health 7, 59–69.CrossRefGoogle Scholar
VANAMAIL, P.,
SUBRAMANIAN, S.,
DAS, P. K.,
PANI, S. P.,
RAJAGOPALAN, P. K.,
BUNDY, D. A. &
GRENFELL, B. T.
(1989).
Estimation of age-specific rates of acquisition and loss of Wuchereria bancrofti infection.
Transactions of the Royal Society of Tropical Medicine and Hygiene 83, 689–693.CrossRefGoogle Scholar
VANAMAIL, P.,
RAMAIAH, K. D.,
PANI, S. P.,
DAS, P. K.,
GRENFELL, B. T. &
BUNDY, D. A.
(1996).
Estimation of the fecund life span of Wuchereria bancrofti in an endemic area.
Transactions of the Royal Society of Tropical Medicine and Hygiene 90, 119–121.CrossRefGoogle Scholar
WEERASOORIYA, M. V.,
GUNAWARDENA, N. K.,
ITOH, M.,
QIU, X. G. &
KIMURA, E.
(2002).
Prevalence and intensity of Wuchereria bancrofti antigenaemia in Sri Lanka by Og4C3 ELISA using filter paper-absorbed whole blood.
Transactions of the Royal Society of Tropical Medicine and Hygiene 96, 41–45.CrossRefGoogle Scholar
WOOLHOUSE, M. E. J.
(1992).
A theoretical framework for the immuno-epidemiology of helminth infection.
Parasite Immunology 14, 563–578.CrossRefGoogle Scholar
WORLD HEALTH ORGANIZATION (1992).
Lymphatic Filariasis: the Disease and its Control.
WHO Technical Report Series No. 821. WHO, Geneva.
WORLD HEALTH ORGANIZATION (1997).
Elimination of lymphatic filariasis as a public health problem – resolution of the executive board of the WHO. Fifteeith World Health Assembly.
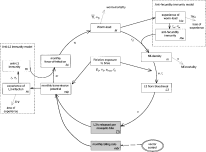
Fig. 1. Schematic representation of LYMFASIM. Immune-regulation is optional in LYMFASIM. The shaded boxes are entomological variables; these variables do not vary between individuals. The unshaded boxes are human variables; the index i indicates that the variable may differ between individuals. Along the arrows, the symbols of relevant parameters are shown.

Table 1. Description of stated variables and parameters of LYMFASIM with values compiled from field observations, experiments and the literature (expressed in months unless otherwise stated)
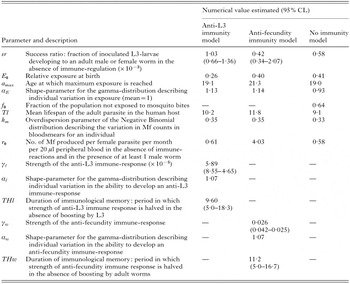
Table 2. Parameters of LYMFASIM describing the transmission dynamics of Wuchereria bancrofti in humans and their estimated values arising from the fit of models with and without immunity

Fig. 2. Observed monthly biting rate in Pondicherry over the period 1980–1986.
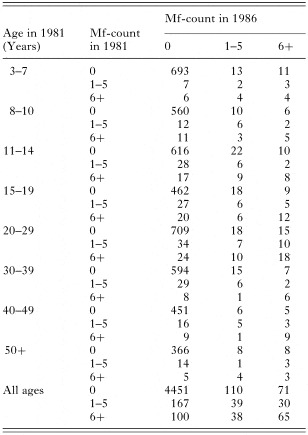
Table 3. Cross-tabulation of the observed frequencies of Wuchereria bancrofti microfilarial counts in 1981 and 1986 by age-group, in Pondicherry, India
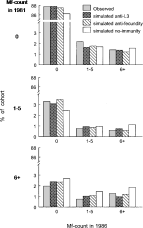
Fig. 3. Observed and simulated distributions for the number of Mf per blood smear in the IVM programme in 1981 and 1986. The upper graph shows the percentages of persons that were Mf-negative in 1981 and that showed 0, 1–5 or [ges ]6 Mf per blood smear in 1986. The middle graphs apply to persons with 1–5 Mf in 1981, etc. Values are shown for all age-classes combined. The simulation outcomes of the 3 models with and without immunity are standardized to the age-distribution of the observed cohort.
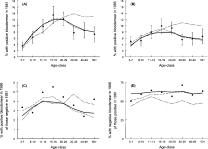
Fig. 4. Observed (dots) and simulated age-specific Mf-prevalence (in 1981 and 1986, A and B respectively), incidence of infection (% of Mf-negatives in 1981 that were positive in 1986, C) and loss of infection (% of Mf-positives in 1981 that were Mf-negative in 1986, D). The solid line is the prediction with anti-L3 immunity model, the dashed line applies to anti-fecundity immunity model, the dot-dashed line to model with no-immunity and the bars are 95% confidence limits for the prevalence calculated using normal approximation to binomial distribution.
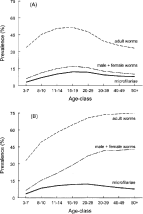
Fig. 5. Simulated age-specific Mf-prevalence (in 1981; solid line), prevalence of persons with at least one adult worm (dashed line) and prevalence of persons with at least one male and at least one female worm (dot-dashed line). Predictions of the models with anti-L3 (A) and anti-fecundity immunity (B).
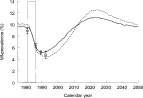
Fig. 6. Predicted and observed trend in the Mf-prevalence (% of persons with a positive blood smear). Lines: predicted Mf-prevalence for the anti-L3 immunity model (solid line) and anti-fecundity immunity model (dashed line). Circles: observed prevalence levels in 1981 (8·9%), 1986 (6·4%), 1989 (5·2%) and in 1992 (4·8%). Window bar highlights the duration of the integrated vector management programme (1981–1986). Bars are 95% confidence limits calculated using normal approximation to binomial distribution.
 You have
Access
- 59
- Cited by