Introduction
Diabetes mellitus (DM) is a multifactorial endocrine-metabolic disease characterized by hyperglycemia resulting from defects in insulin secretion and/or action. Reference Eizirik, Pasquali and Cnop1–Reference Collares-Buzato and Mauricio4 DM is one of the most prevalent metabolic diseases worldwide, affecting around 11% of the world’s population aged 20–79 years and imposing an economic burden on countries that represents 11.9% of total global health spending. 5 The main causes of diabetes development are linked to a complex network of genetic and environmental factors, such as obesity, a sedentary lifestyle, and population aging. 5–Reference Ilonen, Lempainen and Veijola8 An adverse intrauterine environment has been also pointed out as a predisposing factor to the development of diseases in adulthood, including early obesity and Type 2 dabetes mellitus (T2D). Reference Boney, Verma, Tucker and Vohr9–Reference Ruchat, Hivert and Bouchard12 This phenomenon is known as fetal metabolic programming. Reference Zhu, Cao and Li13–Reference Mathias, Elmhiri and de Oliveira15
The fetal metabolic programming envisages that in utero exposure to an imbalanced maternal nutrition can induce permanent changes in metabolic signaling pathways resulting in metabolic diseases in offspring adults. Reference Zhu, Cao and Li13,Reference Sanli and Kabaran14,Reference Grilo, Diniz, Tocantins, Areia and Pereira16,Reference Westermeier, Saez, Villalobos-Labra, Sobrevia and Farias-Jofre17 Although fetal metabolic programming is relatively a new research area, there is epidemiological and experimental evidence to support it. Reference Dhana, Haines and Liu18–Reference Cerf, Williams, Chapman and Louw22 Overall, these studies have shown that maternal malnutrition or nutrition deficiency, particularly of proteins, or overnutrition with the intake of high levels of lipids and carbohydrates can lead to hyperphagia, and obesity Reference Bringhenti, Moraes-Teixeira, Cunha, Ornellas, Mandarim-de-Lacerda and Aguila21,Reference Chango and Pogribny23,Reference Gregorio, Souza-Mello, Mandarim-de-Lacerda and Aguila24 , hyperinsulinemia, insulin resistance Reference Gregorio, Souza-Mello, Mandarim-de-Lacerda and Aguila24 , glucose intolerance Reference Yokomizo, Inoguchi and Sonoda20,Reference Bringhenti, Moraes-Teixeira, Cunha, Ornellas, Mandarim-de-Lacerda and Aguila21 , and increased risk of T2D development in adult offspring. Reference Eberle and Ament11,Reference Yokomizo, Inoguchi and Sonoda20,Reference Park, Stoffers, Nicholls and Simmons25 Epigenetic regulation (i.e. DNA methylation, histone acetylation/methylation, and noncoding RNA) seems to be involved in the underlying mechanism of fetal metabolic programming, which induces the circle of metabolic disorders in adults and across generations. Reference Zhu, Cao and Li13,Reference Pinney and Simmons26 Although there is growing interest and advances in the topic, the cellular/tissue mechanisms involved in fetal metabolic programming are not fully known and studies focusing on the programming changes in the endocrine pancreas and β-cells are still limited. Reference Yokomizo, Inoguchi and Sonoda20–Reference Cerf, Williams, Chapman and Louw22,Reference Fowden and Hill27,Reference Moulle and Parnet28
Beta-cells are the insulin-secreting cells of the pancreatic islet - the morphological and functional unity of the endocrine pancreas. Reference Orci and Unger29,Reference Cabrera, Berman, Kenyon, Ricordi, Berggren and Caicedo30 β-cells play a central role in diabetes pathogenesis; a decrease in their number due to mainly apoptosis or disruptions in their insulin secretion process is at the core of both Type 1 and Type 2 diabetes. Reference Eizirik, Pasquali and Cnop1,Reference Rhodes31,Reference Weir and Bonner-Weir32 Several aspects of insulin secretion and islet structure are compromised in T2D, including changes in rodent islet cytoarchitecture and β-cell and non-β-cell proportion Reference Maschio, Hernandes, Alvares, Marques-Souza and Collares-Buzato33–Reference Hong, Noh, Lee, Chung, Lee and Kim36 , an imbalance in the basal and stimulated insulin secretion Reference Falcao, Maschio and de Fontes37,Reference Carvalho, Oliveira and Britan38 , and an impairment of insulin granule release, associated with changes in content of SNARE/cytoskeleton-mediated membrane docking. Reference Oh and Thurmond39–Reference Zhang, Khan, Ostenson, Berggren, Efendic and Meister43
This work aimed to investigate the repercussions of maternal exposure to a diet with high levels of saturated fat during pregnancy and lactation for the biometric/metabolic profile, islet cytoarchitecture and morphometry, β-cell secretory function, and the VAMP-2 islet content, a vesicle-bound SNARE protein, as well as the islet cytoskeletal F-actin organization in mouse offspring.
Materials and methods
Animals and diets
Female and male C57BL/6 mice were obtained from breeding colonies and maintained at the Federal University of São Paulo (UNIFESP, Brazil). The animals were housed at 22 ± 2°C on a 12:12 h light–dark cycle and had free access to water and food. The animals were mated, and the first day of pregnancy was determined by detecting the vaginal plug. The females were separated into two groups depending on the diet they received during pregnancy and lactation. The control group was fed with a standard rodent diet (CON) (Nuvital CR-1, Paraná, Brazil), containing 4.5% lipids, 55% carbohydrates, and 22.5% proteins (g/100g). The high-fat (HF) group was fed a HF diet, containing 35% lipids, 34.7% carbohydrates, and 20.3% proteins (g/100g) during pregnancy and lactation. In this study, offspring from both groups were evaluated at 3, 12, and 90 postnatal days (P) (Fig. 1, Supplementary Material).
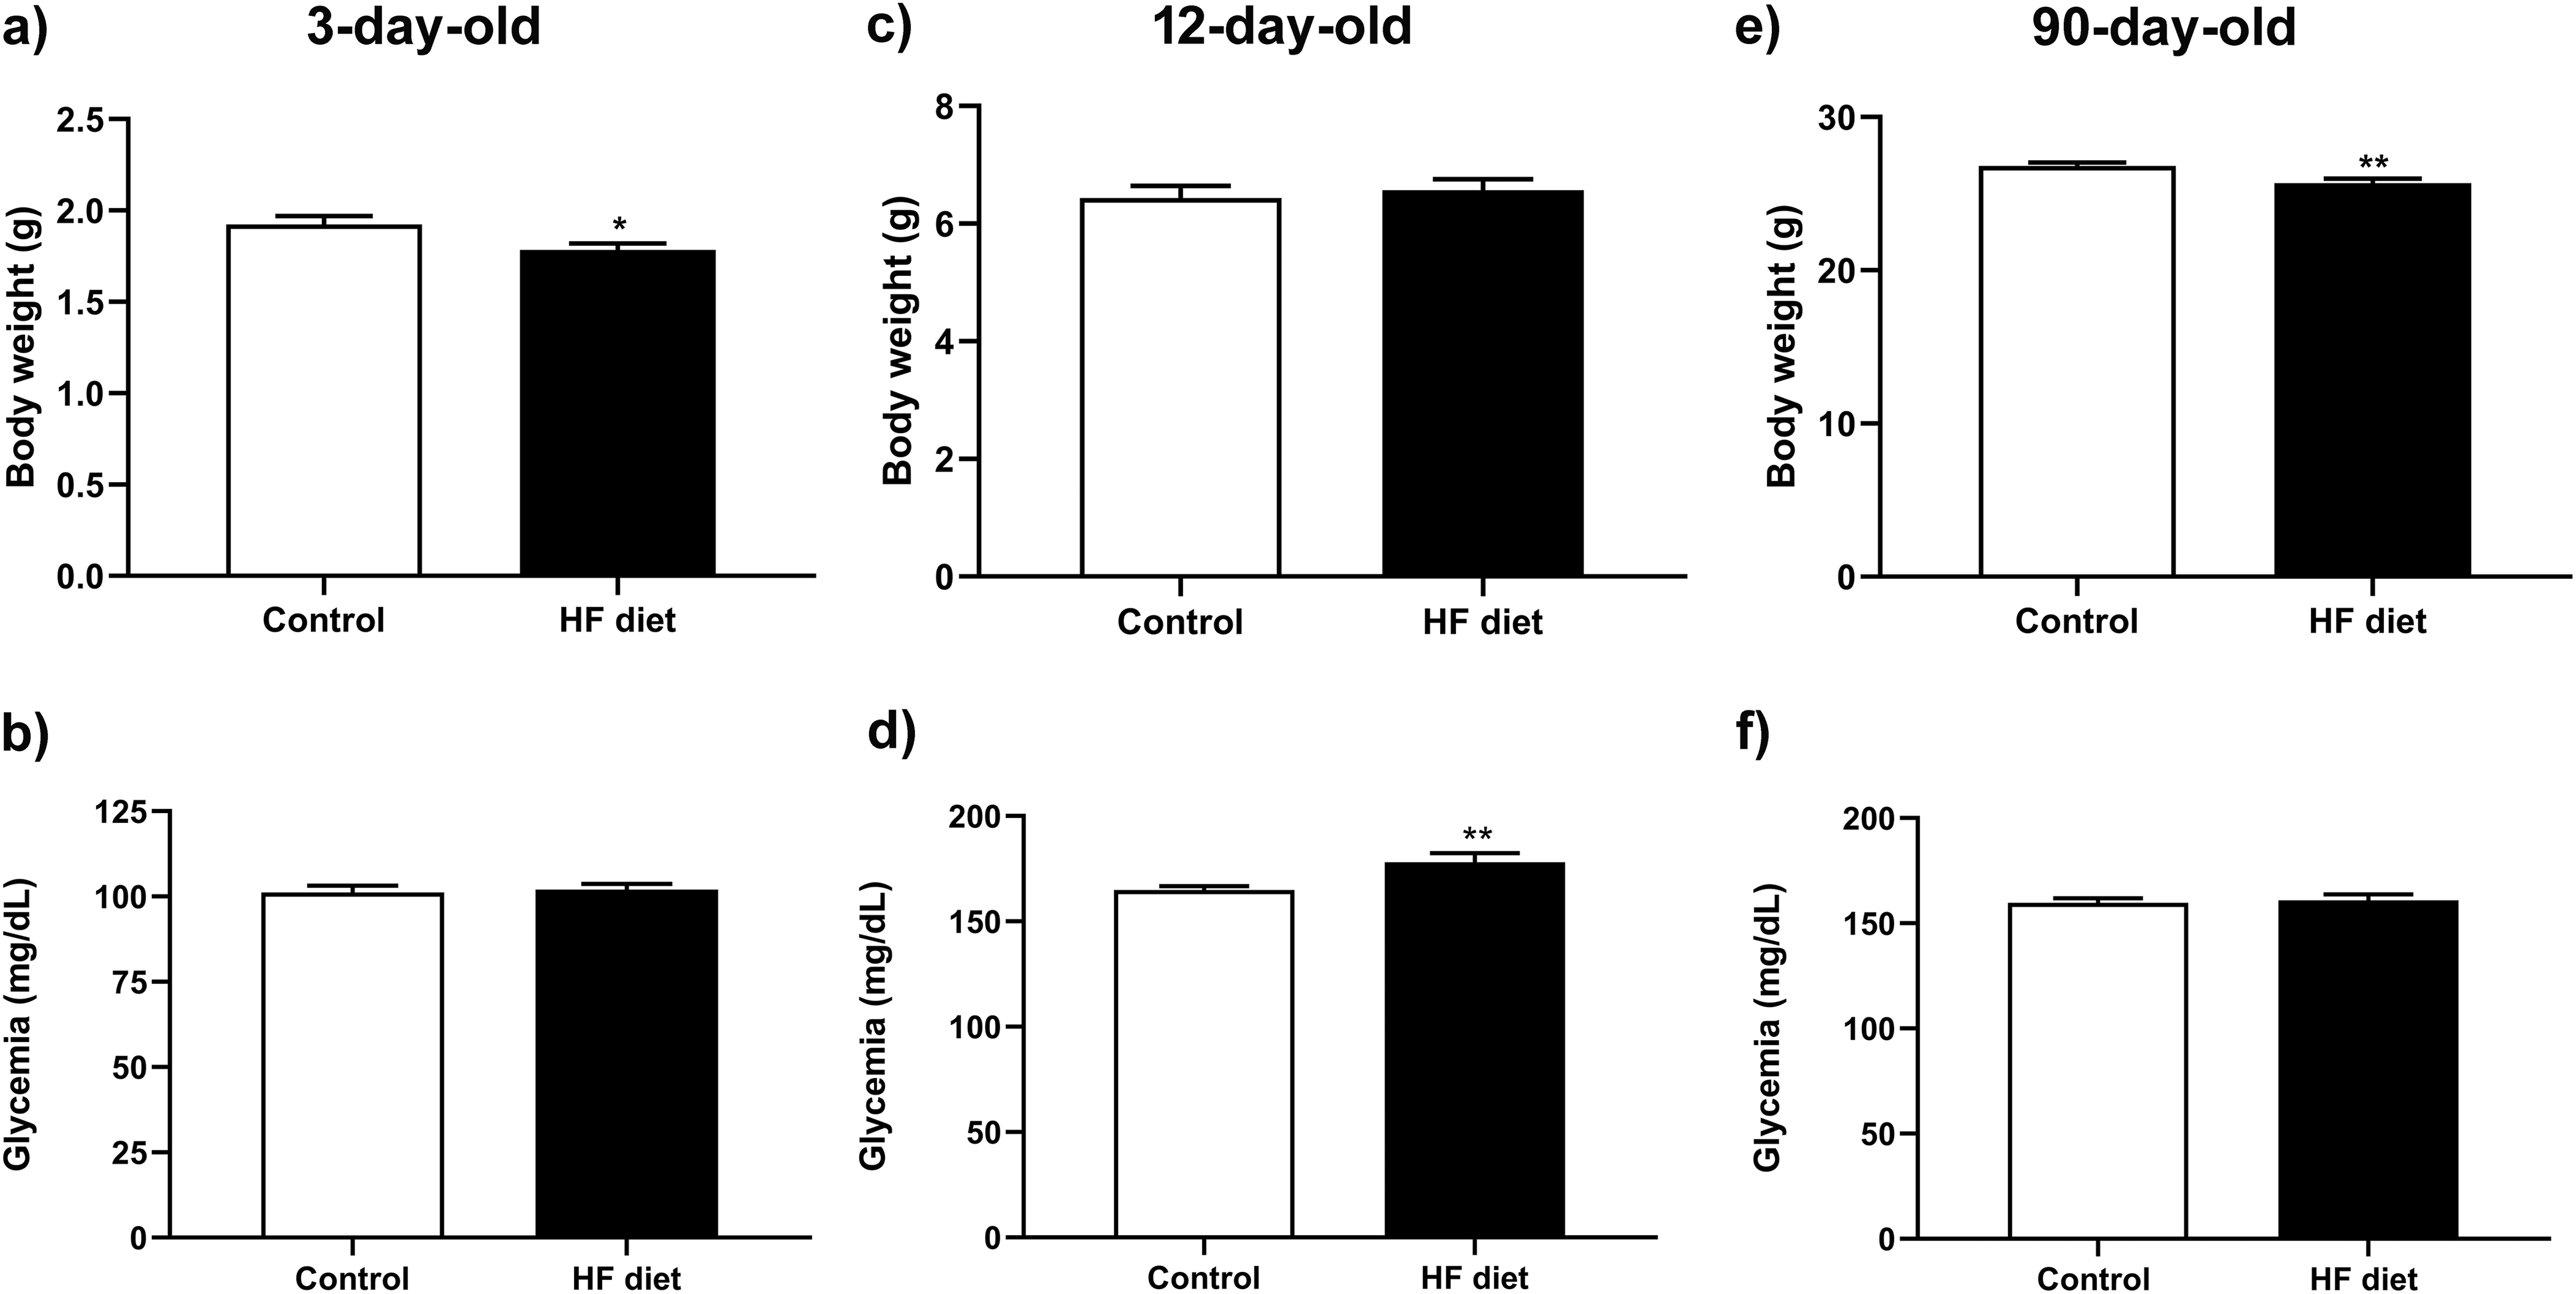
Body weight and postprandial glycemia of 3-, 12-, and 90-day-old mice from offspring of dams fed a high-fat (HF) diet during pregnancy and lactation. The panels a, c, and e show the body weight of mouse offspring from dams in the control and HF diet groups at 3-, 12-, and 90-day-old, respectively. N = 29–35 mice/group from 10 to 11dams/group (for 3-day-old mice; *p < 0.025), 17–26 mice/group from 9 to 10 dams/group (for 12-day-old mice), and 51–55 mice/group from 22 to 23 dams/group (for 90-day-old mice; **p < 0.003). Panels b, d, and f show the postprandial glycemia values of mice offspring of both groups at the ages studied. n = 28–33 mice/group from 10 to 11 dams/group (for 3-day-old mice), 16–23 mice/group from 9 to 10 dams/group (for 12-day-old mice; **p < 0.004), and 48–55 mice/group from 21 dams/group (for 90-day-old mice). Taken together, the data show a significant decrease in body weight in 3- and 90-day-old offspring, and an increase in blood glucose concentration only in 12-day-old offspring from the HF group compared to the control offspring. Statistical test used: two-tailed unpaired t-test.

For the 3- and 12-day-old mice (P3 and P12) from the offspring of both experimental groups, mice from both sexes were used. After weaning, male and female mice were identified, and the study was performed using only male mice (for the 90-day-old group, referred to as P90).
To ensure proper nursing, litters with more than eight pups were reduced to eight at birth. No significant differences were observed in the mean litter size between groups (Control: 6.8 ± 0.34 vs. HF: 6.72 ± 0.4; n = 25–29 litters/group; p = 0.8, two-tailed Mann–Whitney U test).
All experimental procedures used were approved by the Institutional Ethics Committee on Animal Use (CEUA) of the Federal University of São Paulo (UNIFESP, Brazil) under the protocols 2973260116 and 1306150817.
Body weight, adiposity, metabolic parameters
All animals were weighed at the end of the experimental period. Blood samples were collected from the neck blood vessels immediately after euthanasia by decapitation preceded by inhalator anesthesia with isoflurane. Glucose levels were determined in blood aliquots using the Accu-Chek Guide glucometer (Roche Diabetes Care GmbH, Mannheim, Germany). Blood samples were also kept in ice-cold heparinized tubes, centrifuged at 5,000 r.p.m. for 15 min, and stored at − 80°C until plasma insulin was determined using the Rat/Mouse insulin ELISA kit (Millipore, Burlington, MA). After euthanasia, the visceral fat depots (gonadal, retroperitoneal, and mesenteric) were excised and weighed. The results were presented as absolute weights of total visceral fat (the sum of the three visceral depots) and as a percentage of total visceral fat expressed about the respective body weight. The sample size of body weight evaluation was 29–35 mice/group from 10 to 11 dams/group (P3), 17–26 mice/group from 9 to 10 dams/group (P12), and 51–55 mice/group from 22 to 23 dams/group (P90). For blood glucose levels: N = 28–33 mice/group from 10 to 11 dams/group (P3), 16–23 mice/group from 9 to 10 dams/group (P12), and 48–55 mice/group from 21 dams/group (P90). The sample size of fat depot weighting was 46–55 mice/group from 19 dams/group (P90). For plasma insulin level measurement: N = 21–22 mice/group from 10 to 11 dams/group.
Glucose and insulin tolerance tests
Glucose and insulin tolerance tests (ITTs) were performed in the previous week before the euthanasia. For the glucose tolerance test (GTT), 8-h-fasted mice were injected with a 40% glucose solution (2 g/kg body wt ip). Blood was taken immediately before glucose injection and at 15, 30, 60, and 120 min thereafter. Blood glucose levels were measured in samples collected from the tail tip, using a glucometer Accu-Chek Guide (Roche Diabetes Care GmbH, Mannheim, Germany). For the ITT, 6-h-fasted mice were ip injected with 0.5 U/kg body wt human insulin (Novolin R, Novo Nordisk A/S, Kalundborg, Denmark). A drop of blood was taken immediately before insulin injection (T0) and at 4, 8, 12, and 16 min thereafter. For both tests, the results were expressed as area under the curves (AUC), which was determined using GraphPad Prism version 8 for Windows (GraphPad Software, San Diego, USA). In the case of the ITT curve, the results were expressed as a percentage calculated in relation to the glycemia obtained at T0, which was considered 100%. The fasting period for both tolerance tests occurred during the light cycle, and the tests were performed between 3 pm and 7 pm. The sample size for GTT and ITT analysis was 33-37 mice/group from 17 to 18 dams/group.
Islet isolation
Islets obtained from 90-day-old mice of both experimental groups were isolated using type V collagenase for pancreas digestion (EC 3.4.24.3; Sigma, St Louis, USA), as previously reported. Reference Carvalho, Oliveira and Britan38,Reference Maschio, Oliveira, Santos, Carvalho, Barbosa-Sampaio and Collares-Buzato44,Reference Carvalho, Barbosa and Britan45 In this procedure, the pancreas was inflated by injecting 3 mL of 0.8 mg/mL type V collagenase (Sigma, Cat#C9263) in Hank’s balanced salt solution (pH 7.4) supplemented with 5.6 mM glucose plus 1 mg/mL bovine serum albumin (BSA, Fisher Scientific, Loughborough, UK). For insufflation of the pancreas, the common bile duct near the duodenum should be correctly clamped. After excision, the collected pancreas was transferred to a round-bottom 15 mL centrifuge tube, and 2 mL of the collagenase solution was added. The pancreas was then incubated for 11 min at 37°C for enzymatic digestion. After washing in Hank’s balanced salt solution supplemented with 5.6 mM glucose and 1 mg/mL of BSA, fresh islets were collected in the same solution under a dissecting microscope. Reference Maschio, Oliveira, Santos, Carvalho, Barbosa-Sampaio and Collares-Buzato44 Isolated islets were used for determining glucose-stimulated insulin secretion (GSIS) and for Western blotting experiments. For immunoblotting, the islets were lysed in an anti-protease cocktail, containing: 10 mM imidazole, 4 mM EDTA, 1 mM EGTA, 200 μM DL-dithiothreitol, 200 µM phenylmethylsulfonylfluoride, 0.5 µg/mL pepstatin A, 200 KIU/mL aprotinin, 2.5 μg/mL leupeptin, and 30 μg/mL inhibitor trypsin (pH 7.4) using a sonicator (QSonica, Newtown, USA).
Glucose-stimulated insulin secretion (GSIS)
Groups of 5 isolated pancreatic islets were placed in round-bottom 2 mL microtubes and preincubated in a CO2 incubator for 30 min at 37°C in 1 mL of bicarbonate-buffered Krebs solution with a mixture of 95% O2 and 5% CO2 (BBKS; NaCl 112 mM, KCl5 mM, MgCl2 1 mM, CaCl2 25 mM, NaHCO3 1 mM, HEPES 15mM; pH 7.4), containing 5.6 mM glucose and 3 mg/mL BSA. Then, the islets were incubated for 1 h at 37°C in 1 mL of BBKS supplemented with 2.8 or 16.7 mM glucose. During the incubation steps, the microtubes were maintained open in the racks in the CO2 incubator. After rinsing with Hank’s buffer, the islets used for static insulin secretion assays were incubated for 24h in 0.5 mL acid-ethanol solution (0.18 M HCl in 95% ethanol, v/v) at 4°C to extract intracellular insulin, and lysed using a sonicator (QSonica, Newtown, USA). Reference Andersson and Sandler46,Reference Farhat, Almelkar and Ramachandran47 Aliquots of the supernatant fraction (secreted insulin) and acid-ethanol islet extract (total insulin content) were stored at −20°C. Secreted insulin was determined by radioimmunoassay (RIA) and expressed as % of the total insulin content of the islet. The basal glucose concentration (2.8 mM glucose) was chosen because some studies had demonstrated that GSIS begins when extracellular glucose rises above approximately 3–5 mmol/L. Reference Rorsman and Ashcroft48–Reference Soares, Balbo and Bronczek50 In contrast, 16.7 mM glucose represents a strongly stimulatory condition and falls within the range (16.7–24 mM) that maximally activates β-cell glucose metabolism and insulin exocytosis. Reference Rorsman and Ashcroft48,Reference Rebelato, Santos, Carpinelli, Rorsman and Abdulkader51 The sample size for GSIS assays was 10 mice/group from 3 to 4 dams/group.
Pancreas histology and morphometry
Whole pancreas from 3-day- and 12-day-old mice were fixed in 4% formaldehyde (in Tris-buffered saline 0.05 M, TBS, pH 7.4) for 16 h and embedded in paraffin. For pancreas from mice at these ages, semi-serial sections of 5 µm thickness were obtained with a regular spacing of 50 µm between sections until the block was completely exhausted. Reference Carvalho, Martins, da Cunha, Boschero and Collares-Buzato52 Pancreas from 90-day-old mice were fixed in 10% formaldehyde for 16–18 h and were sectioned into three fragments of similar size, and embedded in paraffin separately. Then, semi-serial sections of 5 µm thickness were obtained, with a regular spacing of 100 µm between sections. Six sections per block were randomly selected and processed for insulin immunoperoxidase reaction. Reference Carvalho, Oliveira and Britan38 All islets and pancreas sections were photographed with a digital camera coupled to a microscope. (Axio Observer-D1, Zeiss, Germany). The following morphometric parameters were analyzed in islet images: absolute area of pancreatic β-cells, absolute area of non-β cells, absolute area of the islet, β-cell size and number of β-cells per islet. Morphometric measurements were performed using Image J software (National Institutes of Health). For islet morphometric analysis, the sample size was 15 mice/group (3-day-old mice), 4-5 mice/group (12-day-old and 90-day-old mice). At all studied ages, the number of dams per group used for the morphometric analysis was 4-5.
Immunofluorescence and F-actin localization in pancreas sections
The cellular localization of the SNARE protein VAMP-2 and insulin was determined by indirect immunofluorescence staining on pancreas cryosections (8 µm). Pancreas were frozen in n-hexane cooled with dry ice. The sections were fixed in acetone at −20°C for 3 min. For the detection of SNARE protein VAMP-2, the pancreas sections were fixed for 10 min with 4% formaldehyde in Tris-buffered saline (TBS 0.05 M, pH 7.4) and permeabilized with 0.1% Triton X-100 in TBS for 5 min. After incubation for 1 h with 5% BSA (Fisher Scientific, Loughborough, UK) in TBS, the sections were incubated overnight at 4°C with the primary antibody anti-VAMP-2 (Abcam, UK, dilution 1:200) in 3% BSA in TBS. After washing with TBS, sections were incubated for 2 h at room temperature (RT) with FITC-conjugated secondary antibody anti-rabbit (Sigma, dilution 1:150) in 1% BSA in TBS. Thereafter, the double-staining with insulin was performed by incubating the pancreas sections with a guinea pig anti-insulin antibody (Dako, Carpinteria, USA; dilution 1:125) for 2 h at RT, followed by a last 2 h incubation at RT with a secondary antibody anti-guinea-pig conjugated to TRITC (Sigma; dilution 1:150). All sections were mounted with a commercial antifading medium (Vectashield, Vector Laboratories, Burlingame, USA) and analyzed under a fluorescence microscope coupled with an image capture system (Axio Observer-D1, Zeiss, Germany) or on the Leica SP8 Confocal Microscope (Leica, Germany). Excitation wavelengths were set at 405 nm (DAPI), 488 nm (FITC), and 543 nm (TRITC). Pancreas sections from offspring of control and HF diet-fed mice were compared during the same microscopy session and using identical acquisition parameters. The integrated pixel density of images was analyzed using ImageJ software (National Institutes of Health), selecting a square area of 100 pixels in five different regions of each analyzed islet.
For the evaluation of the islet cytoarchitecture pattern, paraffin-embedded pancreas sections (5 µm) were deparaffinized, hydrated, and subjected to a double immunostaining reaction for insulin (red) and glucagon detection (green). A similar immunofluorescence protocol to the previously mentioned was used. Reference Oliveira, Maschio, Carvalho and Collares-Buzato53 The primary antibodies used were the rabbit anti-glucagon (Dako, dilution 1:75) and guinea-pig anti-insulin (Dako, dilution 1:100–1:200). The secondary antibodies used were anti-rabbit FITC conjugated (Sigma, dilution 1:150) and anti-guinea-pig TRITC conjugated (Sigma, dilution 1:125). The incubation with anti-glucagon antibody was overnight at 4°C, and the incubations with other antibodies were at RT for 2 h.
Pancreas cryosections (8 µm) were also used for F-actin localization in pancreatic endocrine cells. After fixation with 3.7 % formaldehyde and 0.1 % Triton-permeabilization, the sections were incubated with the ActinRed 555 Ready Probes reagent (Life Technologies, Carlsbad, CA) diluted 1:20 in PBS 0.01 M (pH 7.4) for 2h at RT. After washing in PBS, the pancreas sections were mounted with an antifade medium (Vectashield, Vector Laboratories, Burlingame, USA). The sections were analyzed by a Leica SP8 Confocal Microscope (Leica, Germany) with the same excitation parameters previously described. The integrated pixel density of images was analyzed using ImageJ software (NIH), selecting 60 points at the perijunctional region of islet endocrine cells. The points were randomly distributed in the islet area.
For VAMP-2 immunohistochemistry detection and F-actin staining, the sample size used was 5 mice/group (90-day-old mice) from 3 to 4 dams/group. For double immunostaining of insulin and glucagon, the sample sizes were 18–21 mice from 6 dams/group (P3), 9 mice/group from 7 dams/group (P12), and 5–7 mice/group (P90) from 5 to 6 dams/group.
Western blot
Pools of 250–400 isolated islets (2–3 mice/islet pool, from 9 to 11 mice/group) were homogenized with a protease inhibitor cocktail solution and stored at −80°C until their use. The protein quantification was performed using a dye-binding protein assay based on the method of Bradford (BioRad, Hercules, CA). Aliquots of 40 µg of total protein content of islet homogenates from each group were incubated for 1 h at 37°C with 30% of the total volume made of 5x concentrated Laemmli sample buffer, and the samples were then fractionated by electrophoresis in 12% polyacrylamide gels. After that, the proteins were electrotransferred to nitrocellulose membranes (BioRad, Hercules, CA) and reversibly stained with Ponceau S solution (Sigma, St Louis, MO) to verify the protein profile. Then, the membranes were blocked overnight at 4°C with TBS 0.05 M (pH 7.4) containing 0.05% Tween 20 (TTBS) and 5% serum bovine albumin (BSA, Fisher Scientific, Loughborough, UK). After washing in TTBS, the membranes were incubated for 2 h at RT with primary antibody anti-VAMP-2 (Abcam, dilution 1:10,000) in TTBS (0.1% Tween 20) supplemented with 3% BSA. After washing in TTBS, the membranes were incubated for 1 h with an anti-rabbit secondary antibody conjugated to horseradish peroxidase (Sigma, diluted 1:3,500) in TTBS containing 1% BSA. After stripping, the membranes were reblotted with anti-GAPDH antibody (Sigma, dilution 1:14,000) to provide a protein loading control. The densitometric values were normalized by GAPDH signals. The immunoreactive bands were detected using a chemiluminescence kit (ClarityTM Western ECL Substrate kit – Bio-Rad) and a chemiluminescence documentation system (Uvitec Limited, Cambridge, UK). The density of immunoreactive bands was analyzed by ImageJ software (National Institutes of Health). The sample size used in Western Blot experiments was 9–11 mice/group from 5 to 6 dams/group.
Statistical analysis
Statistical differences between the two groups were assessed by Student’s t-test (two-tailed). For cytoarchitecture, morphometric, and semi-quantitative analysis of the fluorescence degree in immunohistochemistry experiments, we used the two-tailed Mann–Whitney U test. For multiple comparisons (as for static insulin secretion assays), statistical significance was determined by One-way ANOVA followed by Tukey’s multiple comparisons test. Data are presented as means + SEM, and the significance level was set at p < 0.05. The statistical analyses were performed using GraphPad Prism Version 8.00 for Windows (GraphPad Software, Inc., USA).
Results
Dams fed a high-fat diet exhibited metabolic disturbances
To better characterize the model, we measured some biometric and metabolic parameters of dams from control and HF-fed groups after weaning. HF-fed dams did not exhibit increased body weight (Fig. 2a, Supplementary material) but showed significant visceral adiposity relative to body weight (Fig. 2b, Supplementary material). These dams also presented elevated blood glucose levels (p < 0.03) and increased AUC of ITT (p < 0.015) compared to the control group (Fig. 2c, f, Supplementary material). Although plasma insulin levels were higher in the HF group (Fig. 2d Supplementary material, p = 0.094), the difference was not statistically significant; a similar trend was observed in the GTT AUC analysis (Fig. 2e Supplementary material).
Metabolic parameters of 90-day-old male mice from offspring of dams from control and HF diet groups. Panels a and b present visceral adiposity data from 90-day-old male offspring of both experimental groups. Panel a shows the absolute weight (g) of the total visceral fat depots (the sum of gonadal, mesenteric, and retroperitoneal fat), while panel b shows this data as a percentage in relation to body weight. N = 46–55 mice/group from 19 mothers/group, **p < 0.007). Panels c and e present the results of the glucose tolerance test (GTT, shown in c) and the insulin tolerance test (ITT, in e), whereas panels d and f show the mean values of the area under the curve (AUC) calculated from the GTT and ITT curves, respectively. For GTT, N = 33–36 mice/group from 17 to 18 mothers/group, *p ≤ 0.04, **p ≤ 0.007 and ***p < 0.0001 (AUC). For ITT, N = 37 mice/group from 17 to 18 mothers/group, **p < 0.0045 and ***p < 0.0001. Panel g presents the postprandial plasma insulin, and panel h shows the insulin secreted by isolated islets of mice from both groups (static insulin secretion assay). For plasma insulin levels, N = 21–22 mice/group from 10 to 11 mothers/group; **p < 0.004. In panel h, the values of insulin secreted are expressed as percentage of the total insulin islet content (N = 10 mice/group from 3 to 4 mothers/group, ***p < 0.0001, for 2.8 mM glucose condition vs. 16.7 mM glucose condition, and p = 0.051 for Con 16.7 mM glucose vs HF 16.7 mM glucose). Taken together, the data show that adult male offspring (P90) from the HF group display significantly increased visceral fat depot (relative to body weight) (b), glucose intolerance (c and d), insulin resistance (e and f), and hyperinsulinemia (g), associated with impaired in vitro glucose-induced insulin secretion (h) compared to the control group. Statistical tests used: two-tailed unpaired t-test (panels a to g), one-way ANOVA followed by Tukey’s post-test (panel h).

Biometric/metabolic parameters of offspring of dams fed a high-fat diet during pregnancy and lactation at different ages
Figure 1 shows body weight (g) and postprandial glycemia of offspring from control and high-fat diet (HF) dams at 3, 12, and 90 days of age (P3, P12, and P90, respectively). Offspring from HF-fed dams exhibited a slight but significant reduction in body weight at both perinatal (∼7% at P3, p < 0.025) and adult ages (∼4% at P90, p < 0.003) compared to control offspring (Fig. 1a, e). Meanwhile, 12-day-old mice from offspring of HF diet dams showed no changes in body weight (Fig. 1c) but displayed an increased postprandial glycemia (∼8% of increase) compared to mice from the control group at the same age (p < 0.004; Fig. 1d). The postprandial glycemia was found unchanged in offspring at the ages of 3- and 90 days (Fig. 1b, f). At weaning (21 day-old), male offspring from the HF diet group displayed significantly increased body weight (Control group: 8.69 ± 0.15g vs HF diet group: 10.60 ± 0.18g, an increase of nearly 20% in relation to the control group, N = 54–59 mice/group from 22 to 24 dams/group, p < 0.0001) as well as increased postprandial glycemia (Control group: 125.8 ± 2.16 mg/dL vs HF diet group: 168.2 ± 4.09 mg/dL, an increase of 34% in relation to the control group, N = 50–53 mice/group from 20 to 21 dams/group, p < 0.0001).
Figure 2 shows the metabolic parameters of mice from offspring of dams fed a control diet (control group) or a high-fat diet (HF diet group) during pregnancy and lactation at adult age (90-day-old mice). Our results indicate a tendency for an increase (∼10%) in absolute visceral adiposity (the sum of gonadal, mesenteric, and retroperitoneal fat depot weights) in male mice from the HF diet group (Fig. 2a, p = 0.06) and a significant increase (∼15%) in relative visceral fat (in relation to the body weight) in mice from the HF diet group, compared to the control group (Fig. 2b, p < 0.007). Figure 2c and d show the GTT curve (c) and AUC values (d) that indicate that male offspring from the HF diet group are glucose intolerant, as demonstrated by the increase (∼12%) in AUC of GTT results from mice from HF diet group, in comparison with control offspring (*p ≤ 0.04, **p ≤ 0.007 in Fig. 2c and ***p < 0.0001 in Fig. 2d). ITT shows that mice from the HF diet group are insulin resistant compared to control mice, as depicted by the increase (∼19%) in AUC of ITT curve of mice from HF diet group, compared to control mice (Fig. 2e and f, present the ITT curve and the AUC of ITT, respectively **p < 0.0045 and ***p < 0.0001). Both tests were performed about one week before euthanasia. Figure 2g shows the plasma insulin concentration of fed mice from both groups collected immediately after euthanasia. Our results indicate that male offspring of dams fed a HF diet display significantly increased plasma insulin levels (1.75-fold increase) compared to mice from the control group (p < 0.004). Meanwhile, the in vitro static insulin secretion assay shows that, although the islets from the HF diet group offspring are responsive to glucose, the level of insulin secreted by them when stimulated with 16.7 mM glucose (in relation to the total insulin content), displays a tendency of reduction (∼16%, p = 0.051) compared to islets of control offspring under the same glucose concentration.
Pancreatic islet morphometry and cytoarchitecture from mouse offspring of dams fed a high-fat diet during pregnancy and lactation at different ages
Figure 3 shows pancreas sections after double immunofluorescence for insulin and glucagon for both experimental groups at different ages. The islets of mice from both groups at all studied ages display a typical cytoarchitecture of a core formed of beta cells and a peripheral mantle of alpha cells. No alterations in this islet cellular arrangement were noted between the offspring from the HF diet group and the control offspring. This was further confirmed by the analysis of cytoarchitecture index in islets of 90-day-old mice showing no difference between the HF diet and control groups (Control: 0.81 ± 0.11; HF diet: 0.88 ± 0.09 arbitrary units; N = 86–130 islets analyzed from 5 to 7 mice/group, and 5–6 dams/group).
Cytoarchitecture pattern of pancreatic islets of 3-, 12-, and 90-day-old mice from offspring of dams fed a HF diet during pregnancy and lactation. Double immunostaining for insulin (in red, a–f) and glucagon (in green, a–f) evidenced pancreatic beta cells in the islet core and alpha cells in the islet periphery, respectively. This typical cell arrangement of rodent islets was maintained for all ages (P3 in a and b, P12 in c and d, P90 in e and f) and groups studied (offspring of dams from the control group in a, c, and e, and offspring of dams from the HF diet group in b, d, and f). N = 18–21 mice from 6 dams/group (P3), 9 mice/group from 7 dams/group (P12), and 5–7 mice/group (P90) from 5 to 6 dams/group. Scale bar: 20 μm.

Meanwhile, significant morphometric changes in the endocrine pancreas were observed from as early as 3 days after birth to adulthood (P90) in the HF diet offspring. Images in Fig. 4a–f are representative of pancreatic islets immunolabeled for insulin for both groups at all studied ages. Panels a, c, and e show islets of control offspring, whereas panels b, d, and f show islets from mice of HF diet offspring. Graphs in Figure 4 g–k present the data of islet morphometric parameters analyzed. Figure 4g depicts that islets of mice from offspring of the HF diet group at all studied ages have a decreased area in comparison with islets of control offspring (15% of reduction at P3 mice, p = 0.0005; a decrease of around 9% at P12, p = 0.0003, and reaching up to 25% decreased values at P90, p = 0.0014). Similarly, the beta cell area is also decreased in offspring from the HF diet group compared to the control group at their respective ages (a decrease of about 27% at P3, p < 0.0001; a reduction of 5% at P12, p = 0.0052, and reaching up to a decrease of 25% at P90, p = 0.003; Fig. 4h). Figure 4i presents the measurements of non-beta cell area. Islets of 3-day-old mice from HF diet offspring have a 30% increased non-beta cell area compared to the islets of age-matched controls (p < 0.0001). Conversely, in older age groups, the HF diet group exhibits a significant reduction in non-beta cell area (p < 0.0001 and p = 0.0005, respectively) compared to their control counterparts (approximately 20% for 12-day-old and 24% for 90-day-old mice). The beta cell number in islets of mice from the HF diet offspring is decreased, ranging from 18 to 30% at all studied ages, compared with islets of mice from control offspring (p < 0.0001; Fig. 4j). Meanwhile, pancreatic islets from 12-day-old and 90-day-old mice from the HF diet offspring show a significantly increased beta cell size (∼7% increase, p < 0.0001; Fig. 4k).
Pancreatic islet morphometric parameters of 3-, 12-, and 90-day-old mice from offspring of dams fed a HF diet during pregnancy and lactation. Panels a to f show representative islet images of 3-day-old mice (a and b), 12-day-old mice (c and d), and 90-day-old mice (e and f) from offspring of dams from control (a, c, and e) and HF diet groups (b, d, and f). Beta cells are evidenced in panels a to f by insulin immunodetection (in brown). Offspring of dams fed a high-fat diet during pregnancy and lactation display markedly decreased islet (Fig. 4g) and β-cell areas (4h) in all ages studied. Fig. 4i shows that the non-β-cell area is increased in islets of 3-day-old mice from the HF diet offspring group but decreased in 12- and 90-day-old mice from the HF diet group compared with the control group. The number of β-cells is significantly decreased in mice from the HF diet group at all ages analyzed compared to the control group (Fig. 4j). Nevertheless, the β-cell size is increased in 12- and 90-day-old mice from the HF diet group in comparison with its respective control group (Fig. 4k). For 3-day-old mice, 470–876 islets were analyzed from 15 mice/group (5 dams/group). For 12-day-old mice, 509–607 islets were analyzed from 4 to 5 mice/group (4–5 dams/group). For 90-day-old mice, 590–795 islets were analyzed from 4 to 5 mice/group (4 dams/group). **p ≤ 0.005, ***p ≤ 0.0005 (two-tailed Mann–Whitney test).

Figure 4. Long description
The figure contains six images and five bar graphs. Panels a to f show representative islet images of 3-day-old mice (a and b), 12-day-old mice (c and d), and 90-day-old mice (e and f) from offspring of dams from control (a, c, and e) and high-fat diet groups (b, d, and f). Beta cells are evidenced in panels a to f by insulin immunodetection in brown. Panel g is a bar graph showing islet area in square micrometers for 3-day-old, 12-day-old, and 90-day-old mice from control and high-fat diet groups. Panel h is a bar graph showing beta-cell area in square micrometers for the same age groups and diet conditions. Panel i is a bar graph showing non-beta-cell area in square micrometers for the same age groups and diet conditions. Panel j is a bar graph showing the number of beta-cells for the same age groups and diet conditions. Panel k is a bar graph showing beta-cell size in square micrometers for the same age groups and diet conditions. The bar graphs indicate significant differences in islet and beta-cell areas, non-beta-cell area, number of beta-cells, and beta-cell size between control and high-fat diet groups across different ages.
Reduced islet VAMP-2 content and altered cortical F-actin organization were observed in adult offspring of dams fed a high-fat diet during pregnancy and lactation
Figure 5 shows VAMP-2 immunostaining (green) in pancreatic islets of 90-day-old mice from control offspring (a and b) or in the HF diet group offspring (c and d). VAMP-2 immunodetection shows a cytoplasmic distribution in beta cells, evidenced by double immunolabeling for insulin (red staining in Fig. 5b and d) in islets from both groups. However, VAMP-2 immunolabeling is significantly decreased in islets of mice from the HF diet group compared to the control group (∼6% decrease, p = 0.0001; Fig. 5e). Immunoblotting data support this finding as shown in Figure 5f–h. Islet homogenates of offspring from the HF diet group present a significant decrease (22%) in VAMP-2 content compared to islets from the control offspring (p < 0.035; Fig. 5h). All membranes used in Western Blot for VAMP-2 and the respective GAPDH reaction are shown in Figure 3 Suppl. Mat.
VAMP-2 level and distribution pattern in pancreatic islets of 90-day-old male mice from offspring of dams fed a HF diet during pregnancy and lactation. Panels a to d show VAMP-2 immunostaining (in green, a–d) in islets from pancreas sections of 90-day-old mice from control (a and b) and HF diet groups (c and d). Panels b and d also show insulin staining (in red) and DAPI labeling (in blue). The panel e shows the mean fluorescence degree in VAMP-2 staining images from both groups. Note that VAMP-2 immunostaining is significantly decreased in islets of mice from HF diet group compared to control mice (***p = 0.0001, 87–94 islets were analyzed per group from 5 mice/group, and 3–4 dams/group, two-tailed Mann–Whitney test). The islet content of VAMP-2 was evaluated in islet homogenates by Western Blot (Fig. 5f). After stripping, the same membrane was reblotted with anti-GAPDH antibody (5g) to provide a protein loading control. Panel h shows the densitometric values for VAMP-2 normalized by GAPDH signals (N = 5 membranes from 9 to 11 mice/group, and 5–6 dams/group, *p < 0.035, two-tailed unpaired t-test). Scale bar in panels a–d: 20 μm.

This change in VAMP-2 islet content was associated with an alteration in F-actin organization, as detected with fluorescent-conjugated phalloidin, as shown in Fig. 6. The F-actin staining at the junctional region of pancreatic endocrine cells was more pronounced in offspring from the HF diet group compared to control mice (Fig. 6c). This finding suggests that the cortical actin mesh of the cytoskeleton in islet cells of mice from the HF diet group is thicker than that observed in control islets.
F-actin staining in pancreas sections of 90-day-old male mice from offspring of dams fed a HF diet during pregnancy and lactation. Panels a and b show confocal images of F-actin detected by TRITC-conjugated phalloidin in pancreatic islets of 90-day-old mice from control (Fig. 6a) and HF diet groups (Fig. 6b). The white arrows show the perijunctional region in islet cells from both groups. The quantification of F-actin staining shows that islets from the HF diet group displayed an increased perijunctional staining compared to control islets (Fig. 6c; ***p < 0.0001; n = 62–70 islets from 5 mice/group, and 3–4 dams/group). Scale bar in panels a and b: 20 μm. Statistical test used: two-tailed Mann–Whitney test.

Figure 6. Long description
The image contains two fluorescent micrographs and one bar graph. Panel A shows a fluorescent micrograph of F-actin staining in a pancreatic islets from the control group, detected by TRITC-conjugated phalloidin. The white arrow indicates the perijunctional region. Panel B shows a similar micrograph for the high-fat diet group, also highlighting the perijunctional region with a white arrow. Panel C is a bar graph quantifying F-actin staining, with the y-axis labeled F-actin staining (integrated pixel density) and the x-axis showing two groups: Control and HF diet. The bar graph indicates that the HF diet group has significantly increased F-actin staining compared to the control group, with a statistical significance of p < 0.0001.
Discussion
Adverse intrauterine conditions, such as maternal obesity, gestational DM, or maternal undernutrition, are associated with persistent metabolic dysregulation in offspring. Reference Zhu, Cao and Li13,Reference Elsakr and Gannon54 These outcomes are primarily attributed to fetal metabolic programming, wherein the developing fetus undergoes adaptive physiological and epigenetic modifications in response to the intrauterine environment, thereby increasing susceptibility to obesity, insulin resistance, and metabolic syndrome in later life. Reference Zhu, Cao and Li13,Reference Elsakr and Gannon54 Our study confirms the impact of maternal high-fat diet exposure during pregnancy and lactation on the metabolic animal state and for the islet morphometric parameters, with special repercussion for β-cells, impairing the β-cell secretory function, accompanied by the reduced islet VAMP-2 content, and altered organization of the cytoskeletal F-actin network (both associated with insulin granule exocytosis) in mouse offspring.
In our study, dams fed a HF diet during pregnancy and lactation already displayed a compromised metabolic profile, characterized by elevated visceral adiposity, higher glycemic levels, and an increased ITT AUC relative to control dams. Their adult offspring (P90) showed significantly lower body weights, a trend that was evident as early as 3 days of age. Additionally, these adult offspring of dams from the HF group also exhibited an increased visceral fat depot (relative to body weight), hyperinsulinemia, glucose intolerance (assessed by i.p. GTT), and insulin resistance (assessed by i.p. ITT), without significant changes in postprandial glycemia compared to the control group. These metabolic alterations are hallmarks of the early phase of type 2 diabetes, known as prediabetes. Reference Collares-Buzato and Mauricio4,Reference Carvalho, Oliveira and Britan38,Reference Oliveira, Maschio, Carvalho and Collares-Buzato53,Reference Ferrannini, Gastaldelli and Iozzo55 Notably, the unchanged postprandial glycemia observed in adult offspring was also present in newborns from the HF group (3-day-old mice), suggesting that at both developmental stages, insulin resistance is being compensated by an increased secretory response from pancreatic beta cells (hyperinsulinemia). Interestingly, the 12-day-old mouse offspring from the HF group exhibited postprandial hyperglycemia in comparison with control offspring. This finding suggests that the metabolic challenges during lactation differ from those during pregnancy. Supporting this idea, several studies have demonstrated that the same metabolic insult can program distinct phenotypes, depending on the specific developmental window of exposure, gestation, lactation, or both periods. Reference Gregorio, Souza-Mello, Mandarim-de-Lacerda and Aguila24,Reference Moulle and Parnet28,Reference Pico, Reis, Egas, Mathias and Matafome56 Overall, our results indicate significant disturbances in glucose homeostasis in offspring of dams exposed to a high-fat diet during gestation and lactation, consistent with previous works using similar models. Reference Yokomizo, Inoguchi and Sonoda20,Reference Bringhenti, Moraes-Teixeira, Cunha, Ornellas, Mandarim-de-Lacerda and Aguila21,Reference Cerf57,Reference Volpato, Schultz, Magalhaes-da-Costa, Correia, Aguila and Mandarim-de-Lacerda58
The structural configuration of the pancreatic islet, defined by the spatial arrangement and proportion of endocrine cells, is integral to islet function, as it facilitates unique paracrine interactions essential for coordinated hormone secretion. Reference Carvalho, Martins, da Cunha, Boschero and Collares-Buzato52,Reference Bosco, Armanet and Morel59 In rodents, β-cells are the most abundant among all endocrine pancreatic cells and occupy the islet core, surrounded by a peripheral mantle formed by the other cell types. Reference Carvalho, Martins, da Cunha, Boschero and Collares-Buzato52 Changes in this typical islet cell proportion and cytoarchitecture are often associated with impaired insulin secretion and the development of T2D in human and animal models. Reference Collares-Buzato and Mauricio4,Reference Carvalho, Oliveira and Britan38,Reference d Oliveira, Carvalho and Polo60 In our study, the metabolic disturbances of the HF offspring were accompanied by significant morphometric changes in the endocrine pancreas, observed from as early as 3 days after birth that persisted until adulthood (90 days), which included a decreased total islet area, a reduced β-cell area within the islet, and a lower β-cell number per islet. Meanwhile, the islet cytoarchitecture was preserved in the offspring of the HF group at all studied ages. These findings indicate that the metabolic programming induced by maternal intake of the HF diet during pregnancy and lactation affects the morphogenesis of the endocrine pancreas.
Interestingly, we also observed an increase in β-cell size in islets from 12-day-old and adult offspring of the HF group. Although β-cell hypertrophy is a process relatively poorly understood, it is considered one of the compensatory mechanisms to restore glucose homeostasis during states of increased insulin demand, such as insulin resistance. Reference Oliveira, Maschio, Carvalho and Collares-Buzato53,Reference Cerf61–Reference Weir, Laybutt, Kaneto, Bonner-Weir and Sharma63 Therefore, it is possible to hypothesize that, in our model, the β-cell hypertrophy compensates partially the insulin resistance state induced by maternal exposure to the HF diet, maintaining hyperinsulinemia and postprandial normoglycemia, despite the reduced β-cell mass.
Studies on the repercussions of fetal metabolic programming on the structure and morphometry of the endocrine pancreas are relatively scarce. Reference Elsakr and Gannon54 To the best of our knowledge, our work, for the first time, describes changes in several morphometric parameters of pancreatic islets in a model of metabolic programming. Although comparisons between studies are difficult due to differences in animal model, diet, and study design used, Yokomizo et al. 2014 Reference Yokomizo, Inoguchi and Sonoda20 have reported a decrease in the islet area in male adult offspring from dams exposed to a HF diet during pregnancy and lactation, which agrees with our results. Reference Yokomizo, Inoguchi and Sonoda20 Interestingly, they observed in these animals a significant reduction in islet expression of PDX-1, a well-known transcription factor that regulates β-cell proliferation and survival mechanisms. Reference Yokomizo, Inoguchi and Sonoda20,Reference Kaneto, Miyatsuka and Kawamori64
The consistent decrease in β-cell area and number, indicative of β-cell mass reduction, seen at early stages of post-natal development (3-day-old) in our metabolic programming model, suggests that the processes leading to impaired β-cell population formation likely began earlier, during embryonic/fetal development, a period not covered in this study. Since it is well-known that the establishment of a functional β-cell mass during the embryonic and fetal stages of development relies on the differentiation of multipotent progenitors and the subsequent expansion of newly formed cells, Reference Chernysheva capital Em, Ruchko capital Ie, Karimova capital Em, Vorotelyak capital Ie and Vasiliev capital65 it is plausible to suggest that maternal HF diet exposure probably affects the complex network of genetic and epigenetic factors that control differentiation and proliferation of insulin-secreting cells during the early development. Further research is needed to clarify this process.
We also investigated the process of exocytosis of insulin granules in our animal model of metabolic programming by analyzing the VAMP-2 islet content, a vesicle-bound SNARE protein, as well as the organization of islet cytoskeletal F-actin. Insulin granule exocytosis in pancreatic β-cells is a complex, highly regulated process by which insulin is released from intracellular storage vesicles (secretory granules) into the bloodstream in response to elevated glucose levels. This process involves a sequence of coordinated events, including granule mobilization/trafficking, docking, and membrane fusion, and is mainly mediated by cytoskeletal and SNARE proteins and is regulated by calcium signaling. Reference Aslamy and Thurmond66–Reference Wang and Thurmond68 The mobilization/trafficking of insulin granules depends on the glucose-induced depolymerization of the cytoskeletal actin cortex, a dense network located under the plasma membrane that, at basal glucose conditions, acts as a barrier to exocytosis. Reference Wang and Thurmond68–Reference Arous and Halban70 The members of the SNARE protein family are found in the vesicles that store insulin (v-SNARE) or in the plasma membrane (target) (t-SNARE). Reference Aslamy and Thurmond66 During docking, the vesicles are transported toward the plasma membrane by the pairing of v-SNARE and t-SNARE proteins, which act similarly to a zipper, bringing the two structures together. Reference Aslamy and Thurmond66,Reference Torrejon-Escribano, Escoriza, Montanya and Blasi71 Soon after, fusion occurs, which is accompanied by a local increase in the concentration of calcium ions provided by the opening of Ca2+ channels present in the plasma membrane. Reference Rorsman and Renstrom67,Reference Wang and Thurmond68
We have observed, by immunofluorescence and immunoblotting, a significant decrease in the islet content of the v-SNARE, VAMP-2, in islets of adult offspring from HF diet-fed dams. This was accompanied by changes in F-actin organization, indicative of a thicker cytoskeletal actin cortex in the islet cells of these animals. Altogether, these results suggest that maternal exposure to the HF diet induces an impairment of the granule exocytosis in adult offspring. Reduced levels of SNARE proteins and disorganization of the actin cytoskeleton have been described in animal models of T2D and diabetic patients, and are associated with compromised insulin secretion. Reference Oh and Thurmond39–Reference Ostenson, Gaisano, Sheu, Tibell and Bartfai41,Reference Arous and Halban70,Reference Thurmond and Gaisano72 Although isolated islets of the offspring from the high-fat diet group remained responsive to glucose, they showed a trend toward reduced insulin secretion relative to total insulin content when stimulated with 16.7 mM glucose. This finding aligns with the decreased VAMP-2 expression and altered F-actin organization observed in islets from this group. Future work will explore the involvement of other cytoskeletal and SNARE proteins in this phenomenon.
In conclusion, the metabolic programming with HF diet during pregnancy and lactation induces metabolic disturbances in adult offspring, including increased visceral adiposity, hyperinsulinemia, glucose intolerance, and insulin resistance. These alterations were associated with changes in islet morphometry, decreased VAMP-2 islet content, and altered cytoskeletal organization, indicative of reduced beta cell mass and impaired insulin granule exocytosis, respectively, with consequences to the insulin secretion process at high glucose concentration. This subtle impairment in insulin secretion may explain the mice’s inability to efficiently compensate for their response to glucose load seen during the GTT. Taken together, the metabolic and islet alterations, some of which can already be observed at an early stage of animal development in our metabolic programming model, may predispose these mice to glucose dysregulation and the development of T2D later in life.
Supplementary material
The supplementary material for this article can be found at https://doi.org/10.1017/S2040174426100646.
Acknowledgments
The authors thank Prof. Marcia Regina Nagaoka for the use of the UVITEC gel documentation system. We also thank the Multiuser Multiphoton Confocal Microscopy Laboratory (INFAR-UNIFESP) for the access to confocal microscopy.
Financial support
This work was funded by grants from FAPESP (#2014/22206-2) and Conselho Nacional de Desenvolvimento Científico e Tecnológico (CNPq, Grants #446957/2014-3, and #405330/2025-1). DCS and CCF were recipients of the CAPES Postgraduate Scholarship (Brazil). CBC-B is a recipient of a Research Fellowship from CNPq (Grant # 301552/2025-8).
Competing interests
The authors declare no competing interests.
Ethical standard
All experimental procedures were performed according to the ethical guidelines and regulations set out by the National Council for the Control of Animal Experimentation (CONCEA, Brazil) and were approved by the Institutional Ethics Committee on Animal Use (CEUA) of the Federal University of São Paulo (UNIFESP, Brazil) under the protocols 2973260116 and 1306150817.