I. INTRODUCTION
Scintillators are materials that exhibit luminescence when excited by various types of radiation. They are used in an array of applications including medical diagnosis, nuclear detection, and high-energy particle physics. Cs2LiYCl6 (CLYC) is a room-temperature scintillator originally proposed by Combes et al. in 1999. Reference Combes, Dorenbos, van Eijk, Kramer and Godel1 It was further developed at the Delft University of Technology. Reference van Loef, Dorenbos, van Eijk, Kramer and Güdel2–Reference Bessiere, Dorenbos, van Eijk, Kramer and Güdel4 Early studies reported an energy resolution of ∼7% at 662 keV. Reference Combes, Dorenbos, van Eijk, Kramer and Godel1 Glodo et al. Reference Glodo, Hawrami and Shah5 were able to improve the performance significantly, achieving an energy resolution of 3.6% at 662 keV with 1″ × 1″ detectors. Furthermore, van Loef et al. Reference van Loef, Dorenbos, van Eijk, Kramer and Güdel2 noted the possibility for pulse shape discrimination with CLYC by detecting core-valence luminescence. Core-valence luminescence is only excited by gamma radiation and has a fast decay time. Excitations from neutron radiation are typically slower, making it possible to distinguish scintillation pulses caused by gamma rays from those caused by neutrons. Reference Roush, Wilson and Hornyak6 Commercial interest in CLYC developed due to its dual gamma/neutron detection functionality and good energy resolution. Crystal growth studies directed toward commercializing this compound were started in 2003, and CLYC was a commercial product by 2012. Reference Glodo, Hawrami and Shah5
CLYC crystals are typically grown by the vertical Bridgman method. Reference Glodo, Hawrami and Shah5,Reference Higgins, Glodo, Shirwadkar, Churilov, van Loef, Hawrami, Ciampi, Hines and Shah7 The appearance of bubbles, cracks, and unwanted secondary phases in CLYC Bridgman boules has been an obstacle to the manufacture of high-performance detectors. Reference Lejay, Blahuta, Ouspenski, Menge and Richaud8 Precipitates were observed forming spontaneously in melts, suggesting that CLYC melts incongruently. As a result, high-quality CLYC crystals with uniform composition are difficult to grow from stoichiometric melts. Since single-crystal growth is considerably more complicated for incongruently melting compounds, knowledge of the relevant phase equilibria is helpful in developing an optimal growth strategy. Reference Christensen9 A comprehensive phase diagram can define the range of compositions over which the solid compound is in equilibrium with the melt.
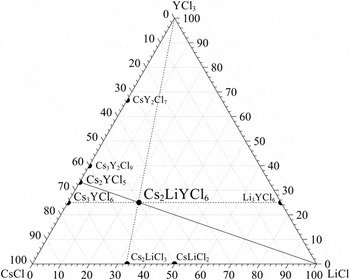
Although phase diagrams for the binary systems CsCl–YCl3, Reference Seifert and Büchel10 YCl3–LiCl, Reference Sun, Bian, Tao, Zhai, Zhong and Qiao11 and CsCl–LiCl Reference Korreng12 are known, no binary or ternary phase diagram containing the CLYC compound was currently available. For this reason, we initiated a study to explore one of the isoplethic (constant compositional range) sections within the CsCl–YCl3–LiCl ternary system (see Fig. 1). The Cs2YCl5–LiCl section was chosen since Cs2YCl5 and LiCl are commercially available starting materials used in crystal growth. Stoichiometric CLYC is made from an equimolar mixture of Cs2YCl5 and LiCl.
Ternary plot of CsCl–YCl3–LiCl system. Cs2LiYCl6 (CLYC) is at the intersection of the Cs2YCl5–LiCl, Cs3YCl6–Li3YCl6, and Cs2LiCl3–YCl3 joins.

The phase diagram was constructed using a combination of powder X-ray diffraction (XRD) and differential thermal analysis (DTA). Phases were identified using XRD. DTA was used to determine melting ranges and solid-state transformation/reaction temperatures. Also, the boundary theory of phase diagrams Reference Zhao, Song and Fan13 and Rhines’ model equilibria Reference Rhines14 were considered. Based on the phase diagram results given below, some melt compositions were selected for the Bridgman growth from Cs2YCl5–LiCl melts. The compositional variation along one Bridgman boule’s growth axis was used to verify the curvature of CLYC’s solubility region, and XRD was used to characterize the segregated secondary phases. Finally, 662 keV gamma ray pulse-height spectra were measured for cylindrical slices from the various boules.
II. BACKGROUND
The construction of the phase diagram of interest was challenging due to the absence of quasi-binary joins containing the CLYC compound. Three joins that contain CLYC are Cs2YCl5–LiCl, Cs3YCl6–Li3YCl6, and Cs2LiCl3–YCl3. None are quasi-binary because one end-component melts incongruently in each case. Tie-lines do not lie exclusively in-plane. The lever rule is still valid, but out-of-plane tie-lines must be considered. In the case of three-phase equilibrium, the lever rule must be applied to tie-triangles. Four-phase equilibrium is allowed in these sections, but it must be invariant according to the phase rule. It occurs at isothermal planes wherein constituent phase compositions are fixed at the corners of adjoining tie-triangles and comes in three varieties: class I, II, and III. In classes I and III, four-phase equilibria are ternary eutectic (L ⇌ α + β + γ) and peritectic (α + β + L ⇌ γ) reactions, respectively. Class II four-phase equilibrium (α + L ⇌ β + γ) has no analogue in true binary sections. Reference Rhines14
Boundary theory Reference Zhao, Song and Fan13 is a powerful tool for constructing complicated phase diagrams. It gives us the theorem of corresponding relationship (TCR). For an isobaric (constant pressure) system of N components, the TCR states that the dimension R of a “phase boundary” between two neighboring phase regions (NPRs) is
 $$R = \left( {N - Z - r} \right) - \Phi + 1\quad ,$$
where Φ is the total number of phases between the NPRs, Z is the number of independent conditions which constrain the concentration of components across the boundary, and r is the number of independent chemical reactions occurring in the system. The phase boundary represents the collection of equilibrium phase points existing on the common boundary and is distinct from the “geometrical boundary” between NPRs. The phase points are only the boundary points of single-phase regions along the geometrical boundary. The geometrical boundary on the other hand can contain any system points and thus may have a higher dimensionality R′. For NPRs with ΦC phases in common, R′ is given by
 $$R' = \left\{ {\matrix{ {R + {\Phi _{\rm{C}}}} \quad\quad\,\,\,\,\,\ {i{\rm{f}}\;R = 0} \cr {R + \left( {{\Phi _{\rm{C}}} - 1} \right)} \quad {{\rm{otherwise}}} \cr} \quad .} \right.$$
The dimensions of the boundaries in an isopleth are uniquely determined only if the section is “regular.” Most arbitrary sections are regular, and every boundary’s dimension in these isopleths is equal to its dimension in the ternary space minus one. This cannot hold true for sections passing through invariant points, since the invariant point’s boundary would have a negative dimension in the isopleth. These are the so-called “irregular” sections. By including the CLYC peritectic, our isopleth inevitably passes through an invariant point. The section of interest must be irregular. A boundary’s isoplethic dimension may either be equal to or one less than its ternary dimension.
III. EXPERIMENTAL PROCEDURE
The Cs2YCl5 (≥99.99% cesium yttrium chloride) and LiCl (≥99.9% lithium chloride) starting materials used for this phase diagram study were purchased from a materials supplier. Cs2YCl5 was occasionally synthesized in-house from CsCl and YCl3 to verify certain results. Since the materials are hygroscopic, special precautions were taken to avoid hydration. All materials were stored under a N2 atmosphere in a Dri-Lab HE 243 dry glovebox with a hygrometer. Samples were prepared in the dry glovebox and then taken to the analytical equipment in sealed containers.
A DTA/thermo-gravimetric analysis (TGA) system was used for determining melting, solidification, and phase transformation temperatures. Alumina sample and reference holders were first baked at 1400 °C for one hour. Sample holders were then loaded with 60–80 mg of unreacted mixtures of Cs2YCl5 and LiCl. The DTA chamber was first evacuated and then purged with argon three times before each experiment. The samples were reacted at high temperatures in the chamber before obtaining heating and cooling curves. A heating/cooling rate of 10 °C/min was used. Extrapolated onsets for the phase diagram were determined from heating curves with the Proteus analysis software.
Samples for powder XRD were synthesized in sealed quartz ampoules, embedded in crystal wax, and covered with a 1 mil Kapton polyimide film. The X-ray system did not have high temperature capabilities, so quenching from high temperatures was often used for the phase identification of a specific composition at a specific temperature. Materials were annealed at the quenching temperature for 1–2 days. The diffractometer used Cu Kα radiation with a wavelength of 1.5405980 Å. Counting times and step sizes ranged from 28 to 100 s and 0.01–0.02°, respectively. Background subtraction, smoothing, and pattern matching were performed in the HighScore Plus software package.
Single-crystal boules were grown from Cs2YCl5–6LiCl melts with a 0.4 mol% cerium dopant at 0.5 mm/h in vacuum-sealed quartz ampoules using the vertical Bridgman method. The ampoules were vacuum baked above 200 °C prior to growth, and the starting materials were loaded in a dry glovebox. Laser ablation inductively coupled plasma mass spectrometry (ICP-MS) was used to measure compositional variation along one boule’s growth axis. Slices from some of the boules were then used for XRD and scintillation studies.
Pulse-height spectra were measured using a Hamamatsu R6231-100 photomultiplier tube (PMT; Hamamatsu Photonics K. K., Hamamatsu, Japan) located in a glovebox at less than 3 ppm moisture. PMT output signals were processed by a Canberra 2005 preamplifier (Canberra Industries Inc., Meriden, Connecticut), an Ortec 672 amplifier (Ortec Inc., Easley, South Carolina) set at 10 µs shaping time, and an Ortec Easy-MCA-2k multichannel analyzer (Ortec Inc.). Photopeak centroids and energy resolutions were determined using Ortec Maestro peak-fitting software (Ortec Inc.). Samples were cupped within a diffuse reflector to improve light collection. Resulting light yield was estimated by comparing the gamma response of CLYC to NaI(Tl) and LYSO(Ce) scintillators made by Hilger Crystals (Margate, United Kingdom), each sized 5 × 5 × 5 mm3, with corrections made for the PMT quantum efficiency.
IV. RESULTS & DISCUSSION
A. Phase diagram
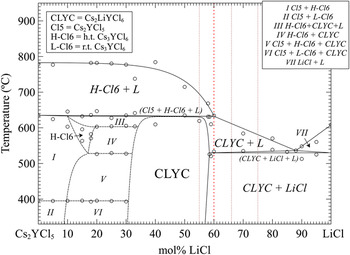
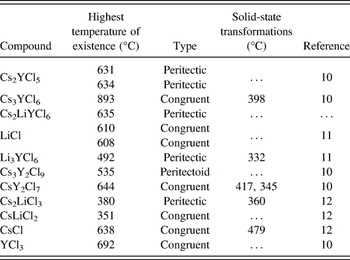
The Cs2YCl5–LiCl phase diagram developed is shown in Fig. 2. Four different compounds appeared in the phase diagram. CLYC was found to exist over a solid solution range from approximately 31–57% LiCl at room temperature and melt incongruently at about 635 °C at its stoichiometric composition, that is, 50% LiCl. The melting behavior of the Cs2YCl5 (peritectic 634 °C) and LiCl (congruent 608 °C) end-components was consistent with the literature data given in Table I. The Cs3YCl6 compound also appeared in the Cs2YCl5–LiCl section. Cs2YCl5 is known to melt into Cs3YCl6 + L. Reference Seifert and Büchel10 No other solid phases in the ternary system exist above 700 °C at standard pressure (Table I).
Phase diagram of the Cs2YCl5–LiCl section. Dotted vertical lines correspond to the growth melt compositions investigated. Open circles are extrapolated onsets of DTA heating curves.

Melting and phase transformation temperatures for CsCl–LiCl–YCl3 compounds.

The structural phase transformation temperature of monoclinic (L-Cl6) to high-temperature cubic (H-Cl6) Cs3YCl6 was found to be 395 ± 1 °C. The phase transformation temperature has previously been reported in the literature to be 398 °C. Reference Seifert and Büchel10
Boundary theory forbids the CLYC single-phase field from meeting the H-Cl6 + L coexistence region. If these two regions met, we would have R = 3 − 3 + 1 = 1 and ΦC = 0, which violates the fourth corollary of the TCR. Reference Zhao, Song and Fan13 The Cl5 + H-Cl6 + L three-phase assemblage was included to separate the two regions. The (Cl5 + H-Cl6 + L)/(CLYC) boundary is a class III four-phase equilibrium or ternary peritectic. This boundary must be isothermal, requiring Cs2YCl5 to have a higher melting point than CLYC. This was not observed, but the difference in measured melting temperatures of Cs2YCl5 and CLYC was within the range of experimental error.
The left-hand side was developed with the aid of Rhines’ hypothetical model for class III four-phase equilibrium. Reference Rhines14 The complex shapes of the left-hand side’s boundaries were not resolved in detail, and so are shown as indefinite dashed lines in Fig. 2. The III–IV boundary occurred at 604 ± 1 °C, and likely belongs to the 600 °C isothermal plane boundary warranted by the 10% YCl3 eutectic in the CsCl–YCl3 system. Reference Seifert and Büchel10 The neighboring Cs3YCl6 compound’s solubility region was thought to pass through the Cs2YCl5–LiCl section. Without single-phase H-Cl6 dividing fields I and III, a four-phase equilibrium boundary would exist over a range of temperatures, violating the phase rule.
The right-hand side of the diagram resembles a binary eutectic phase diagram. The CLYC plus liquid coexistence region ranges from 50 to 88% LiCl but is very narrow up to 58% LiCl. The CLYC + L region ends at a pseudoeutectic point (536 °C). The pseudoeutectic is not an invariant eutectic point. Rather, it is a point on the cotectic line connecting the CLYC + L and LiCl + L phase fields. A binary eutectic reaction cannot occur in this section again by the fourth corollary of the TCR. The CLYC + LiCl + L three-phase assemblage was included for this reason. At lower temperatures, the liquid froze, and a two-phase region of CLYC and LiCl was observed. Since no other equilibrium phase was seen in the CLYC + LiCl field, there was no ternary eutectic reaction in the section.
B. DTA results
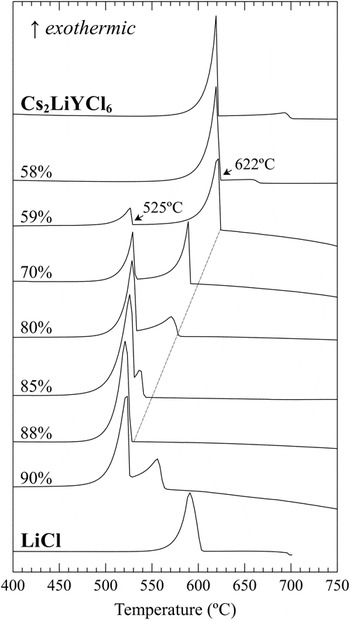
DTA measurements were performed for several Cs2YCl5–LiCl mixtures. Extrapolated onsets from heating curves were plotted as open circles in Fig. 2. Note that Fig. 3 shows cooling curves (exothermic up) while the phase diagram was developed using the heating curves exclusively. Heating curves were preferred for the phase diagram since cooling curves may be affected by supercooling. Reference Mackenzie15 Cooling curves still illustrated qualitative features in the phase diagram. They were used in Fig. 3 for their sharper, more conspicuous peaks.
Cooling curves for 50–100% LiCl. A discontinuous drop in the melting point was observed between 58 and 59% LiCl. A pseudoeutectic was observed at 88% LiCl.

The extrapolated onsets from the heating curves mostly matched the boundary lines. A few thermal events appeared to be inconsistent with the phase diagram. Their DTA peaks neither showed up consistently nor agreed with XRD observations. For example, the 395 °C line corresponding to the structural transformation of Cs3YCl6 sometimes extended into the CLYC single-phase region. This was thought to result from kinetic factors, i.e., slow reaction times compared to equilibrium conditions, which commonly affect systems with incongruent compounds and solid-state reactions. Reference Alper16 Possibly, sufficient time to finish the (Cs3YCl6 + L)/(CLYC) reaction was not allowed upon freezing, so the Cs3YCl6 phase remained at low temperatures. An unaccounted-for line of points at 514 °C was also occasionally observed in phase V of Fig. 2. One explanation is that the sample was separated in the holder during melting and underwent the V–IV phase transition in two different temperature regions.
The DTA curves contained no clear evidence of the Cl5 + H-Cl6 + L and CLYC + LiCl + L regions. These regions likely only spanned at most a few degrees, making them difficult to identify in DTA curves. A close inspection of the solidus peaks did reveal some potential double peaks, although admittedly these are impossible to distinguish from instrument noise.
The relative intensities of the solidus and liquidus peaks in Fig. 3 were consistent with the lever rule applied to the Cs2YCl5–LiCl phase diagram. The liquidus peaks become weaker, so less solid should remain at the start of melting, as composition approaches 59% LiCl from 50% LiCl. A sudden drop in solidus temperature was observed between 58 and 59% LiCl, coinciding with the CLYC solubility limit. The liquidus peaks then attenuate and decrease in temperature until the pseudoeutectic composition (88% LiCl), where the solidus and liquidus have merged. The liquidus peaks reappear beyond the pseudoeutectic as the LiCl + L region begins. Finally, the congruently melting LiCl end-component produced only one melting peak.
C. XRD results
XRD experiments were performed for various compositions and temperatures in the Cs2YCl5–LiCl section. Calculated patterns from the International Centre for Diffraction Data (ICDD) for L-Cs2YCl5, Cs3YCl6, and CLYC based on the structural data in Table II were used for reference. The LiCl reference pattern was obtained experimentally by Swanson and Tatge. Reference Swanson and Tatge17 Our patterns matched the reference patterns closely.
Structural data for compounds observed in the Cs2YCl5–LiCl section (H/L = high/low-temperature modification).

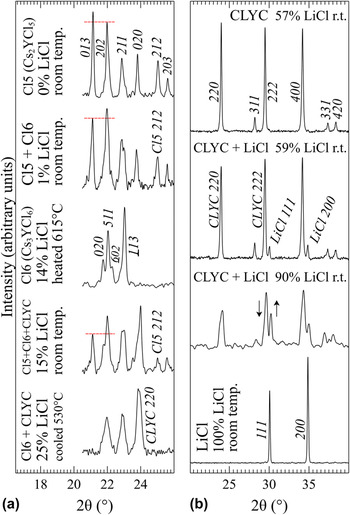
Single-phase CLYC patterns were observed from about 31 to 57% LiCl at room temperature and 31–58% LiCl when quenched from 560 °C. Some modest peak-shifting was observed across the CLYC solubility region. At 30% LiCl and below, Cs2YCl5 and Cs3YCl6 secondary phases appeared. Above the upper solid-solubility limit, both CLYC and LiCl diffraction peaks were visible. The LiCl phase can be identified by its (111) and (200) peaks at 2θ ≈ 30.1 and 34.9°, respectively. As expected, the LiCl peaks increased in intensity relative to the CLYC peaks as more LiCl was added.
Nine representative diffraction patterns are given in Fig. 4(a) (0–25% LiCl) and Fig. 4(b) (57–100% LiCl). Quenching from the H-Cl6 + CLYC + L (III) and H-Cl6 + CLYC (IV) regions yielded similar patterns. The liquid crystallized into Cs3YCl6 + CLYC since its composition was likely fixed along the out-of-page (from Fig. 2) cotectic between the H-Cl6 + L and CLYC + L fields. Furthermore, it was unclear whether our quenching procedure was effective at stabilizing the high-temperature Cs3YCl6 modification at room temperature. No experimental or calculated pattern for H-Cs3YCl6 was discovered in the literature or databases, and the quenched Cs3YCl6 phase mostly resembled low-temperature Cs3YCl6. A high-temperature diffractometer could serve to verify the tentative left-hand side of the phase diagram.
XRD patterns of (a) LiCl-poor and (b) LiCl-rich phase fields.

The low-symmetry Cs2YCl5 lattice generated a great number of diffraction peaks, some of which overlapped with the characteristic Cs3YCl6 peaks. The relative intensity of the (202) and (013) Cs2YCl5 peaks was analyzed to spot the Cs3YCl6 phase in multiphase regions. Note the red dashed lines in Fig. 4(a). Reflection from the (511) Cs3YCl6 plane adds to the intensity of the (202) Cs2YCl5 peak, while no other plane reflects at the same angle as the (013) Cs2YCl5 plane. In pure Cs2YCl5, the (013) peak should be more intense than the (202) peak. However, the (202) peak was more intense than the (013) peak in some patterns, indicating the presence of the Cs3YCl6 compound. On the other hand, noting the absence of the Cs2YCl5 phase simply required inspecting 2θ ≈ 21.1° for the (013) peak or 2θ ≈ 25.0° for the (212) peak. Neither CLYC nor Cs3YCl6 reflects near these angles. In the 15 and 25% LiCl patterns in Fig. 4(a), the CLYC phase can be distinguished by its prominent (220) peak.
D. Bridgman boules
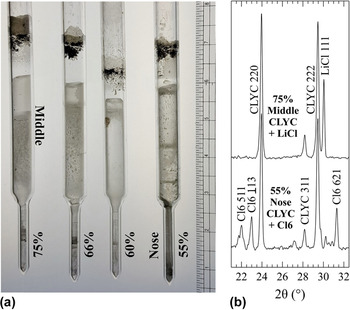
Four CLYC boules were grown by the vertical Bridgman method from Cs2YCl5–LiCl melts with cerium dopant. Typically, for the growth of incongruently melting phases, compositions for which the crystal is in equilibrium with the melt over a range of temperatures are preferred. Reference Christensen9 In our case, those are between the peritectic (50% LiCl) and pseudoeutectic (88% LiCl) points in Fig. 2. The four boules in Fig. 5(a) were grown from melts containing 55, 60, 66, and 75% LiCl. Although the phase diagram was developed in an argon atmosphere, the Bridgman experiments showed that the trends predicted by the phase diagram are directly relatable to the growth behavior.
(a) Partial CLYC boules grown by the vertical Bridgman method from Cs2YCl5–LiCl melts of varying composition. The 60% LiCl melt produced the clearest crystal. (b) XRD patterns from the middle of 75% (top) and nose of 55% (bottom).

The 60% LiCl melt produced the clearest boule, with no visible secondary phase at the nose. The 55% boule had substantial Cs3YCl6 deposits in the capillary and nose sections, as evidenced by the XRD pattern shown in Fig. 5(b). The 66 and 75% crystals formed eutectic-like LiCl structures along their lengths. The LiCl secondary phase region occupied a larger portion of the 75% boule. The black material at the tail of the ampoules may have been a contaminant in the starting materials, which floated on the melt surface during growth.
At higher LiCl concentrations, the melt’s boundary layer will become more lithium-rich as cesium and yttrium atoms are disproportionately incorporated into the growing CLYC lattice. Once the boundary layer reaches the pseudoeutectic composition, LiCl will crystallize. All else being equal, starting with a highly lithium-rich melt composition should yield more LiCl secondary phases, as was observed.
If a melt composition below 60% LiCl is used, solid Cs3YCl6 will precipitate out of the melt and sink toward the bottom of the ampoule or the crystal interface. From about 60 to 88% LiCl, only CLYC will precipitate out spontaneously. Supposing the growth rate is slow enough so that the availability of cesium and yttrium atoms is not limited by boundary layer diffusion, a composition around 60% LiCl is optimal for avoiding the formation of both Cs3YCl6 and extensive LiCl secondary phases. If a more rapid growth rate is preferred, selecting a composition closer to 50% LiCl, while leading to some Cs3YCl6 formation, would be helpful.
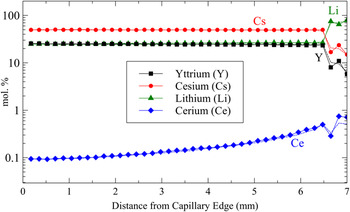
ICP-MS compositional analysis along the 60% CLYC boule’s growth axis in Fig. 6 showed a slight increase in lithium concentration (2.6% in the Cs2YCl5–LiCl basis). These data confirmed the steep right-hand boundary to the CLYC solid-solubility region in Fig. 2 and the observed absence of secondary phases in the capillary and nose of the 60% boule in Fig. 5(a). The abundances of yttrium, cesium, and lithium varied relatively little until the last-to-freeze section, where the lithium-rich boundary layer crystallized into CLYC + LiCl. The variations along the center and edge were more-or-less consistent. Also, the cerium dopant segregation was consistent with a segregation coefficient less than one.
Laser ablation ICP-MS of cerium-doped 60% boule. Solid and dashed lines were measured along the center and edge of the length accordingly.

E. Gamma testing
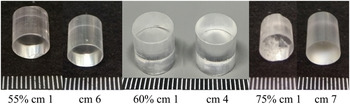
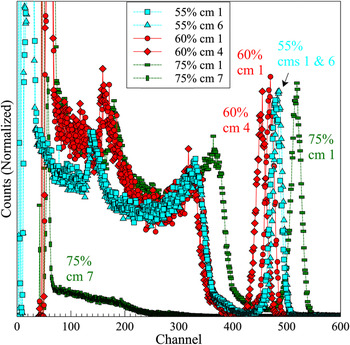
Small detectors from the 55, 60, and 75% boules were prepared for gamma response testing by cutting with a wire saw and polishing with SiC paper, using mineral oil. Each was approximately 9 mm in diameter and 10 mm long. Figure 7 displays the crystals, noting the location they were taken from each boule, where cm 1 corresponds to the first-to-freeze portion and cm 8 corresponds to the last-to-freeze portion. Note that the last-to-freeze portion of the 75% boule was cloudy.
Detectors made from the LiCl-rich boules.

Four of the detectors had similar responses, with about 19,000 ph/MeV and 4.2% energy resolution. As seen in Fig. 8, the sample from the midsection of the 60% boule had a slightly lower light output, perhaps due to cerium segregation. This starting composition was optimized with regard to single-crystal yield and was not necessarily expected to improve scintillation properties. Many other variables must be considered for enhancing detector performance. Gamma testing was performed here to verify that boules from LiCl-rich melts still luminesced. The ‘cm 7’ sample from the 75% boule, for example, showed no gamma response at all, as expected from its high LiCl content. Moreover, its density was only 2.3 g/cc, while the other samples averaged 3.3 g/cc.
662 keV gamma ray pulse-height spectra of detectors shown in Fig. 7.

V. CONCLUSION
The Cs2YCl5–LiCl phase diagram was explored using DTA and powder XRD analysis, and used to explain Bridgman growth results. Stoichiometric CLYC is an intermediate solid solution which melts at 635 °C in a ternary peritectic reaction, i.e., class III four-phase equilibrium. A high-temperature Cs3YCl6 plus liquid phase field was found above the four-phase isotherm until about 60% LiCl. Below it, a CLYC and liquid two-phase region extended from 50 to 88% LiCl, ending at a pseudoeutectic equilibrium with LiCl at 536 °C.
By analyzing the phase diagram, we reasoned that an abundantly lithium-rich growth melt should yield more LiCl secondary phase. Also, a melt below 60% LiCl would precipitate out unwanted Cs3YCl6 secondary phase. At slow growth rates, a composition around 60% LiCl was thought to be optimal for preventing the formation of Cs3YCl6 while maintaining low concentrations of LiCl secondary phase. The vertical Bridgman growth at 0.5 mm/h of 55%, 60%, 66%, and 75% LiCl boules confirmed the insight from the phase diagram. The 60% crystal did not contain either Cs3YCl6 or LiCl secondary phases in the nose or middle of the boule.
ACKNOWLEDGMENTS
We wish to thank Stanford Nano Shared Facilities for giving us access to an X-ray diffractometer, Prof. Yi Cui for allowing us to use his DTA/TGA system, and George Calvert for assistance with the dry glovebox and transparent furnace. This work was partially supported by the Department of Homeland Security contract HSHQDC-15-C-B0040.