




No CrossRef data available.
Article contents
Electrocardiographic characterization in Trypanosoma cruzi reinfected mice
Published online by Cambridge University Press: 16 April 2004
Abstract
Chagas' disease, caused by Trypanosoma cruzi, affects approximately 20 million people. There are 3 stages in the disease: acute, intermediate and chronic, the diversity and severity of the symptoms range from a mild electrocardiographic alteration to sudden death. We have previously demonstrated that when reinfections were carried out in the acute phase they produce greater cardiac damage. The aim of the present work was to investigate whether T. cruzi reinfected mice present electrocardiographic abnormalities that could be characteristic and only achieved after reinfections. Of the mice reinfected during the acute phase 100% showed abnormalities from days 90 post-infection, with a predominance of auricle ventricle blocks (67–71%). All the mice reinfected during the chronic infection showed electrocardiographic alteration after 30 days post-first reinfection. Of the mice infected, without reinfection, 60% exhibited electrocardiographic dysfunction at 90 days post-infection. Our results demonstrated that when the host was reinfected in the acute phase, more serious electrocardiographic alterations were developed than when the reinfections were carried out in the chronic stage. Sudden death described in some chagasic patients, might be related to some of the findings described here.
Information
- Type
- Research Article
- Information
- Copyright
- © 2004 Cambridge University Press
INTRODUCTION
Chagas' disease, caused by Trypanosoma cruzi, represents a serious public health problem in Central and South America, where about 20 million people are infected (WHO, 1991; Moncayo, 1999). There are 3 stages in the human disease: acute, indeterminate and chronic stage and its clinical evolution varies in different patients and in different regions (Storino & Milei, 1994). The heart is the organ most commonly involved, and sudden death due to cardiac dysrhythmias may occur. In the chronic phase 20–30% develop chagasic cardiomiopathy (Storino & Milei, 1994; Andrade, 1999). Diversity of symptoms and severity range from a mild electrocardiographic alteration to sudden death. This great variability in cardiac Chagas' disease may be due to several factors. Two of them were studied here: host exposure to reinfection (Dias, 1963; Macedo, 1976; Prata, 2001; Bustamante et al. 2002) and the number of parasites reinfecting the host (Fernández et al. 1996). The role of T. cruzi reinfections has been evaluated in several models. Cabrine-Santos et al. (2001) studied reinfections in hamsters and found that they may aggravate the inflammatory processes. Similar findings were reported in rats by Revelli et al. (1990). Controversially, Machado et al. (2001) observed that there were no signs of electrocardiographic alteration in both infected and in reinfected dogs. Lauria-Pires & Teixeira (1997) described similar observations in BALB/c mice. We have previously demonstrated that if the host is subjected to reinfections at any time the cardiac lesions will be more severe (Bustamante et al. 2002, 2003). Electrocardiographic studies give important information about aspects of cardiac function and are a useful tool for measuring the severity of cardiopathy and in prognosis (Laguens et al. 1980; Berul et al. 1996; Wehrens, Kirchhoff & Doevendans, 2000). The mouse model for Chagas' disease was described by Laguens et al. (1980) demonstrating that it reproduces the 3 phases seen in the human disease from a pathological, immunological and electrocardiographic point of view.
The aim of the present work was to examine if mice reinfected with T. cruzi present electrocardiographic abnormalities that are characteristic and only achieved with the reinfections.
MATERIALS AND METHODS
Parasites
Bloodstream trypomastigotes of T. cruzi, Tulahuen strain, designated as TINF/CL/1945/Tulahuen (T. cruzi I) (Anonymous, 1999) were obtained from infected mice. Infected heparinized blood was used for the assays described below.
Infection
Albino Swiss female mice weighing 30±1 g (n=282) were inoculated with 50 trypomastigote forms of T. cruzi, by i.p. injection. The number of parasites/ml of blood was determined using a Neubauer haemocytometer. The blood (0·1 ml) was diluted in physiological solution and 30% of BSA (V fraction) in order to obtain the appropriate parasite concentration.
Reinfections
We used 2 murine models. In the acute model, reinfections were made 10 and 20 days after the first infection. In the chronic model the first reinfection was performed 1 year after the initial infection, followed by a second reinfection 10 days later. The animals were divided into the following groups: group 1 (mice infected and not reinfected n=30) (infected control group); group 2 (mice reinfected in the acute stage, with 50 bloodstream forms of T. cruzi, n=39); group 3 (mice reinfected in the acute stage, with 500 bloodstream forms of T. cruzi, n=43); group 4 (mice reinfected in the chronic stage, with 50 bloodstream forms of T. cruzi, n=30); group 5 (non-infected, control group n=50).
The investigation was carried out according to the Guide for the Care and Use of Laboratory Animals published by the U.S. National Institute of Health.
Electrocardiography
Electrocardiograms were obtained with an electrocardiographic unit (Model FD-16 Fukuda Denshi) under 10 mg/kg ketamine CLH anaesthesia (Parke Davis). In the acute model electrocardiographic studies were performed in normal mice previous to being infected and at 30, 60 and 90 days post-infection (p.i.). In the chronic model they were performed 12 months p.i. and 30, 60 and 90 days post-first reinfection. The electrocardiographic tracings were obtained with 6 standard leads (dipolar leads DI, DII, DIII and unipolar leads aVR, aVL, aVF), recording at 50 mm/s with amplitude set to give 1 mV/10 mm.
The electrocardiographic abnormalities analysed were: modifications in auricle–ventricle conduction (prolonged PQ segment), in intraventricular conduction (prolonged QRS complex), and alteration in auricle–ventricle conduction associated with intraventricular conduction and arrhythmias. The electrocardiographic registers were read by a specialist, taking into account the electrocardiographic pattern in normal and in T. cruzi infected mice previously described (Wehrens et al. 2000; Sadigursky & Andrade, 1986). All alterations suggestive of bundle branch blocks were recorded under the name of intraventricular blockade as suggested by Sadigursky & Andrade (1986). We also used their criteria to characterize the intraventricular conduction abnormalities and auricle–ventricle blocks.
Statistical analysis
The obtained data were compared by χ2 for all the electrocardiographic studies. The significance level was set at P<0·05.
RESULTS
Fig. 1 shows the evolution of the percentages of mice showing at least 1 kind of electrocardiographic abnormality through the 3 phases of the experimental infection and Table 1 shows the electrocardiographic abnormalities found in the acute model (groups 1–3) in the non-infected (group 5) mice. Some of these abnormalities were found in 6% of group 5 at day 30 p.i., with a predominance of arrhythmias (A) (4%, see Table 1). Of group 1 mice 12·5% showed some electrocardiographic disturbances (Fig. 1) with a high incidence (9·4%, Table 1) of AVB whereas 81% and 72% of groups 2 and 3 presented electrocardiographic alterations at the same time (P<0·01) (Fig. 1). However, while group 2 exhibited a majority (61·9%) of AVB, group 3 showed a higher proportion (38·9%) of intraventricular blockade (IVB) (Table 1). During the indeterminate stage (60 days p.i.), similar qualitative alterations were detected. In this phase the reinfected groups showed all of the electrocardiographic abnormality types studied in this work. In the chronic phase of the infection (90 days p.i.), 60% of non-reinfected mice presented abnormalities (Fig. 1), with a majority (26·7%) of ABV, whereas 100% of the reinfected mice showed electrocardiographic alterations (Fig. 1). Both groups exhibited a high predominance (67 and 71·4% respectively) of AVB in this phase (Table 1). Results presented in Table 2 show the electrocardiographic abnormalities observed in the chronic experimental model (groups 1, 4 and 5). The electrocardiographic pattern found in group 1 at 360 days p.i. was similar to that displayed at 60 days p.i. (group 1, Table 1). Of group 1 mice 70% showed AVB, the main electrocardiographic disturbance on days 390, 420 and 450 p.i. (Fig. 1). On the other hand 100% of the reinfected population showed electrocardiographic dysfunction after 390 days p.i. (P<0·01) (Fig. 1), in which the predominance of AVB was clearly marked.

Fig. 1. Evolution of the percentages of non-infected ([utrif ]), infected without reinfections (○), acutely reinfected with 50 trypomastigotes (□) or with 500 trypomastigotes ([squf ]) and chronically reinfected ([bull ]) mice showing at least 1 kind of electrocardiographic abnormality along the 3 phases of experimental Chagas' disease. Dark arrows indicate acute reinfection time and white arrow indicates chronic reinfection time. *P<0·01 when compared between groups at the same time.
Table 1. Percentages of non-infected, infected without reinfection and acutely reinfected mice with Trypanosoma cruzi that showed abnormalities through the evolution of experimental Chagas' disease (Within each column and taking into account the time (30, 60 and 90 days p.i.) values with different superscript symbols differ significantly between them (P<0·01). AVB: Auricle–ventricle blockade (prolonged PQ segment); IVB: intraventricular blockade (prolonged QRS complex); AV-IV: AVB associated with IVB.)

Table 2. Percentages of non-infected, infected without reinfection and chronically reinfected mice with Trypanosoma cruzi showing abnormalities through the evolution of experimental Chagas' disease (Within each column and taking into account the time (360, 390, 420 and 450 days p.i.) values with different superscript symbols differ significantly between them (P<0·01). AVB: Auricle–ventricle blockade (prolonged PQ segment); IVB: intraventricular blockade (prolonged QRS complex); AV-IV: AVB associated with IVB.)

DISCUSSION
During the clinical course of Chagas' disease electrocardiographic alterations are usually the first clinical evidence of disease progression, but the onset of this abnormality is rarely detected, since it tends to be asymptomatic at the beginning and heart involvement is usually clinically detected in the chronic phase. (Prata & Macedo, 1984; Zicker et al. 1990). One possible factor associated not only to the onset of the electrocardiographic abnormalities but also to its progression is reinfections.
Here, we examined in 2 experimental models (acute and chronic) whether T. cruzi-reinfected mice present electrocardiographic abnormalities only achieved by reinfections. In the acute model, 90 days p.i., the reinfected animals presented a higher percentage (100%) of electrocardiographic abnormalities than the infected ones (60%) (P<0·01).
As regards the specific type of abnormalities described in Table 1, by 90 days p.i. there was no significant difference between groups 2 and 3. However, there were significant differences (P<0·01) at the earlier time-points: group 2 having a higher prevalence of AVB and group 3 of IVB and the combination of both showing some dose-response dependence because group 3, that presented a more serious abnormality (IVB) were infected with a higher dose of parasite. These results are in accordance with Maguire et al. (1987) and with de Andrade et al. (1998) which, in a longitudinal study, found that ventricular conduction defects were more frequent and they were considered as an unequivocal sign of disease progression, known to be associated to increased mortality. These findings indicate that the reinfection produces more severe damage in cardiac electric conduction through the evolution of Chagas' disease.
Regarding the chronic model, it appears that the similar results displayed by group 1 at 360 days p.i., and group 2, at 60 days p.i., suggest that a lower reinfective dose in the early stage of T. cruzi infection will accelerate the evolution of cardiac damage, especially the electric conduction system. All the chronically reinfected animals showed electrocardiographic alterations with values significantly higher than the ones observed for the infected ones. Therefore, reinfections carried out in the chronic phase produced a significant increase of electrocardiographic abnormalities when compared with the other groups.
Controversially, reinfections carried out in other experimental models did not modify electrocardiographic patterns (Lauria-Pires & Teixeira, 1997; Machado et al. 2001) that were proposed to be related to the immunity that conferred some protection provoked by reinfections (Nussenzweig, Deane & Kloetzel, 1963; Brener, 1967).
Our results demonstrated that when the host was reinfected in the acute phase of experimental Chagas' disease, significantly more serious electrocardiographic alterations developed than when the reinfections were given in the chronic stage. Reinfections increased the number of electrocardiographic abnormalities and the different T. cruzi dose induced more severe alterations.
Thus sudden death described in some chagasic patients, might be related to some of the findings described here.
This work was supported by grants from the Agencia Córdoba Ciencia and Secretaría de Ciencia y Técnica (SECYT) from Universidad Nacional de Córdoba.
References
REFERENCES
ANONYMOUS (1999).
Recommendations from Satellite Meeting. International Symposium to Commemorate the 90th Anniversary of the Discovery of Chagas' disease. Rio de Janeiro, Brazil.
Memorias do Instituto Oswaldo Cruz
94, 429–432.
ANDRADE, Z.
(1999).
Immunopathology of Chagas' disease.
Memorias do Instituto Oswaldo Cruz
94, 71–80.CrossRefGoogle Scholar
BERUL, C. I.,
ARONOVITZ, M. J.,
WANG, P. J. &
MENDELSOHN, M. E.
(1996).
In vivo cardiac electrophysiology studies in mouse.
Circulation
94, 2641–2648.CrossRefGoogle Scholar
BRENER, Z.
(1967).
Algunos aspectos da imunidade adquirida em camundongos experimentalmente inoculados con Trypanosoma cruzi.
Revista do Instituto de Medicina Tropical de Sao Paulo
9, 233–238.Google Scholar
BUSTAMANTE, J. M.,
RIVAROLA, H. W.,
FERNÁNDEZ, A. R.,
ENDERS, E. J.,
FRETES, R.,
PALMA, J. A. &
PAGLINI-OLIVA, P. A.
(2002).
Trypanosoma cruzi reinfections in mice determine the severity of cardiac damage.
International Journal for Parasitology
32, 889–896.CrossRefGoogle Scholar
BUSTAMANTE, J. M.,
RIVAROLA, H. W.,
FERNÁNDEZ, A. R.,
ENDERS, J. E.,
FRETES, R.,
PALMA, J. A. &
PAGLINI-OLIVA, P. A.
(2003).
Indeterminate Chagas' disease: Typanosoma cruzi strain and re-infection are factors involved in the progression of cardiopathy.
Clinical Science
104, 415–420.CrossRefGoogle Scholar
CABRINE-SANTOS, M.,
SILVA, E. L.,
CHAPADEIRO, E. &
RAMÍREZ, L. E.
(2001).
Trypanosoma cruzi: Characterization of reinfection and search for tissue tropism in hamsters (Mesocricetus auratus).
Experimental Parasitology
99, 160–167.CrossRefGoogle Scholar
De ANDRADE, A. L.,
ZICKER, F.,
RASSI, A.,
RASSI, A. G.,
OLIVEIRA, R. M.,
SILVA, S. A. &
TURCHI MARTELLI, C. M.
(1998).
Early Electrocardiographic abnormalities in Trypanosoma cruzi seropositive children.
American Journal of Tropical Medicine and Hygiene
59, 530–534.CrossRefGoogle Scholar
DIAS, E.
(1963).
Os efeitos da superinfecçao sobre a evoluçao da cardiopatia crônica chagasica.
Revista Goiana de Medicina
9, 233–239.Google Scholar
FERNÁNDEZ, A. R.,
ENDERS, J. E.,
RIVAROLA, H. W.,
PAGLINI, P. A. &
PALMA, J. A.
(1996).
Cardiac β receptors' density or affinity modified by different Trypanosoma cruzi amount.
Acta Physiologica Pharmcologica et Therapeutica Latinoamericana
47, 137–143.Google Scholar
LAGUENS, R. P.,
CABEZA MECKERT, P.,
BASOMBRIO, M. A.,
CHAMBO, M. A.,
COSSIO, P.,
ARANA, R. &
GELPI, R. J.
(1980).
Infección crónica del ratón con Trypanosoma cruzi. Modelo experimental de enfermedad de Chagas.
Medicina
40, 33.Google Scholar
LAURIA-PIRES, I. &
TEIXEIRA, A. R.
(1997).
Superinfections with genetically characterised Trypanosoma cruzi clones did not aggravate morbidity and mortality in BALB/c mice.
Journal of Parasitology
83, 819–824.CrossRefGoogle Scholar
MACEDO, V.
(1976).
Influencia da exposiçao à reinfeçao na evoluçao da doença de Chagas: Estudo longitudinal de cinco anos.
Revista do Patologia Tropical
5, 33–116.Google Scholar
MACHADO, E. M.,
FERNÁNDEZ, A. J.,
MURTA, S. M.,
VITOR, R. W. A.,
CAMILO, Jr., J. R.,
PINHEIRO, S. W.,
REIS LOPES, E.,
ADAD, S. J.,
ROMANHA, A. J. &
PINTO DIAS, J. C.
(2001).
A study of experimental reinfection by Trypanosoma cruzi in dogs.
American Journal of Tropical Medicine and Hygiene
65, 958–965.CrossRefGoogle Scholar
MAGUIRE, J. H.,
HOFF, K. E.,
SHERLOCK, I.,
GUIMARAES, A. C.,
SLEIGH, A. C.,
RAMOS, N. B.,
MOTT, K. E. &
WELLER, T. H.
(1987).
Cardiac morbidity and mortality due to Chagas' disease: prospective electrocardiographic study of a Brazilian community.
Circulation
75, 1140–1145.CrossRefGoogle Scholar
MONCAYO, A.
(1999).
Progress towards interruption of transmission of Chagas disease.
Memorias do Instituto Oswaldo Cruz
94, 401–404.CrossRefGoogle Scholar
NUSSENZWEIG, V.,
DEANE, L. M. &
KLOETZEL, K.
(1963).
Differences in antigenic constitution of strains of Trypanosoma cruzi.
Experimental Parasitology
14, 211–232.CrossRefGoogle Scholar
PRATA, A.
(2001).
Clinical and epidemiological aspects of Chagas' disease.
Lancet Infectious Diseases
1, 92–100.CrossRefGoogle Scholar
PRATA, A. &
MACEDO, V. O.
(1984).
Morbidity of Chagas' heart disease.
Memorias do Instituto Oswaldo Cruz
79, 93–96.CrossRefGoogle Scholar
REVELLI, S.,
BERRA, H.,
VALENTI, J.,
MORENO, H.,
BERNASCONI, M.,
POLI, H. &
MORINI, J.
(1990).
Effect of reinfection on the development of rats infected with Trypanosoma cruzi.
Revista do Instituto de Medicina Tropical de Sao Paulo
32, 260–268.CrossRefGoogle Scholar
SADIGURSKY, M. &
ANDRADE, S. G.
(1986).
Electrocardiographic changes in experimental chronic murine Chagas' disease.
Brazilian Journal of Medicine and Biological Research
19, 379–388.Google Scholar
STORINO, R. &
MILEI, J.
(1994).
Enfermedad de Chagas.
Mosby,
Doyma Argentina, Buenos Aires.
WEHRENS, X. H. T.,
KIRCHHOFF, S. &
DOEVENDANS, P. A.
(2000).
Mouse electrocardiography: An interval of thirty years.
Cardiovascular Research
45, 231–237.CrossRefGoogle Scholar
WORLD HEALTH ORGANIZATION (1991).
Control of Chagas' Disease.
WHO Technical Report Series 811, 1–93.
WHO, Geneva.
ZICKER, F.,
ALMEIDA NETTO, J. C.,
ZICKER, E. M. S.,
OLIVEIRA, R. M. &
SMITH, P. G.
(1990).
Trypanosoma cruzi infections and electrocardiographic findings among active manual workers. A population based study in central Brazil.
International Journal of Epidemiology
19, 182–186.Google Scholar
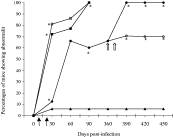
Fig. 1. Evolution of the percentages of non-infected ([utrif ]), infected without reinfections (○), acutely reinfected with 50 trypomastigotes (□) or with 500 trypomastigotes ([squf ]) and chronically reinfected ([bull ]) mice showing at least 1 kind of electrocardiographic abnormality along the 3 phases of experimental Chagas' disease. Dark arrows indicate acute reinfection time and white arrow indicates chronic reinfection time. *P<0·01 when compared between groups at the same time.
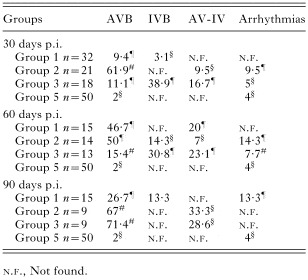
Table 1. Percentages of non-infected, infected without reinfection and acutely reinfected mice with Trypanosoma cruzi that showed abnormalities through the evolution of experimental Chagas' disease
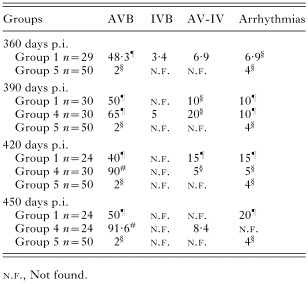
Table 2. Percentages of non-infected, infected without reinfection and chronically reinfected mice with Trypanosoma cruzi showing abnormalities through the evolution of experimental Chagas' disease
 You have
Access
- 7
- Cited by