In many Western countries, long waiting times for elective surgery are a concern. Major joint replacement is an example of a type of surgery with a high volume of demand and relatively long waiting periods for patients. As populations get older, the prevalence of slowly progressive diseases, such as osteoarthritis (OA) in hip and knee joints, is increasing. Over three-quarters of a million total hip and knee replacement surgeries are done in the United States annually (Reference Hoogeboom, van den Endey and van der Sluisz1). Furthermore, according to March et al. (1997), the costs of OA have been estimated to account for up to 1–2.5 percent of the Gross National Product (GNP) in several developed countries (Reference March and Bachmeier2). In Finland, a total of 11,104 total joint replacements (TJRs) were performed in 2004 (hip 6,600 and knee 5,905), with the median waiting time of 181 days for the surgery (hip 153 and knee 209 days). Until 2007, the number of TJRs was 17,334 (hip 7,698 and knee 9,636), with a median waiting time of 120 and 142 days, respectively (3;Reference Lavernia, Guzman and Gachupin-Garcia4). The mean waiting time for elective surgical procedures is approximately 3 months in several countries and the maximum waiting times can stretch into years.
An important question is what effect do longer waiting times, brought about by lower rates of surgery, have on patient welfare. Health status is likely to deteriorate (on average) with waiting and welfare will be lower if there is postponement of the benefit from surgery (time preference). However, the OECD Waiting Times study found surprisingly little evidence, from a review of the medical literature, of significant deterioration of health or worsening of surgical outcomes as a result of waiting for elective surgery in those countries where waiting times are up to 3 or 6 months, depending on the condition (Reference Siciliani and Hurst5). Surgeons seem to be good at triage, that is, at re-prioritizing patients whose conditions become unstable or deteriorate while they wait. Longer waiting may be more problematic. A study of patients on the waiting list for total hip replacement at one hospital in the United Kingdom, using a health status score specific to hip pathology, found evidence of significant deterioration and that the deterioration was greater the longer the wait. The median wait, here, was approximately 1 year (Reference Kili, Wright and Jones6). Similarly, a study of patients waiting for varicose vein surgery in the United Kingdom found “considerable deterioration” in their condition while waiting for surgery. In this case, the median wait was 20 months (Reference Sarin, Shields, Farrah, Scurr and Coleridge-Smith7).
It is commonly thought that, due to waiting, there is a deterioration in the condition for which treatment is required, a loss of health-related quality of life (HRQoL) in the form of significant pain or disability, as well as an increase in the costs of surgery and use of other treatments and healthcare services pre- and postoperatively. However, as Siciliani et al. (Reference Siciliani and Hurst8) suggest, eliminating waiting times altogether would not in fact constitute an optimum waiting time from the perspective of the hospital. It can be cost-effective to maintain short queues of elective patients, because the adverse health consequences of short delays are small and because there are savings in hospital capacity from allowing queues to form (Reference Siciliani and Hurst8;Reference Gravelle and Siciliani9).
According to earlier studies, patients waiting for TJR have a poor quality of life and they have difficulties functioning in their daily activities (Reference Hirvonen, Blom and Tuominen10–Reference Tuominen, Sintonen and Hirvonen15). However, little is known about the cost-utility of total joint replacement in relation to waiting time.
The aim of our prospective, randomized, controlled trial was to compare CU of short and longer waiting times for TJR. Many observational studies have documented findings before and after operations, but such studies do not control for the natural course of the disease (Reference Lavernia, Guzman and Gachupin-Garcia4;Reference Laupacis, Bourne and Robareck16–Reference Rissanen, Aro and Sintonen18). According to literature reviews by Hoogeboom et al. (Reference Hoogeboom, van den Endey and van der Sluisz1) and ourselves, no prior studies have estimated the effect of waiting time on the cost-utility of total joint replacement in hip and knee patients using a randomised study design.
MATERIALS AND METHODS
Data Collection and Study Design
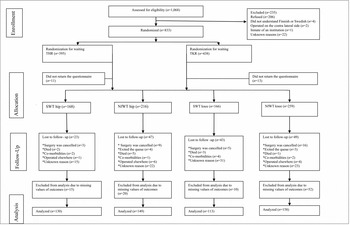
Between August 2002 and November 2003, we recruited a total of 833 patients from three Finnish hospitals to take part in this study. The three hospitals were the Surgical Hospital and Jorvi Hospital, which are both part of Helsinki University Central Hospital, and Coxa Hospital for Joint Replacement in Tampere. Patients were recruited to take part in the study through contact with orthopedic and practice staff during four (at Coxa three) recruitment periods (Supplementary Table 1, which can be viewed online at www.journals.cambridge.org/thc2013067). Patients’ recruitment is shown in the flow chart (Figure 1) following the requirements of the CONSORT statement.
Flow of patients through the trial.

The key inclusion criteria were the need for a primary TJR due to OA of the hip or knee joint, as evaluated by the hospital surgeon, that the patient was an adult (age >16) and placed on the waiting list in a research hospital, and that the patient was willing and mentally able to participate in the study. The key exclusion criteria were patients with rheumatoid arthritis, fractures, and congenital hemophilia or congenital deformities.
Randomization
Once the patients had been placed on the hospital waiting list, the study nurse randomly assigned them to one of two groups: (i) a short waiting time (SWT) group, with a maximum waiting period of 3 months; or (ii) a nonfixed waiting time (NfWT) group, with surgery performed according to the hospital's routine procedure and with the waiting period measured from the date the patient was added to the waiting list to the date of admission for surgery. The number of patients placed on the waiting list varied from one month to another, being specific to each hospital. Therefore, we could not estimate in advance the number of patients to be placed on the list. The patients randomized into the SWT group could only be operated on in one of four operating periods (within 2 weeks after each recruitment period) during the year. The arrangement was needed because operating rooms for the surgery of SWT patients had to be booked in advance before we could recruit the patients. For ethical reasons, all patients waiting for total joint replacement had to have an equal chance of being recruited to participate in the study in either the SWT or the NfWT group. As only half of the hospitals’ 1-month surgical capacity could be allocated to the SWT group, the number of SWT patients was restricted and determined specifically for each hospital. Therefore, we needed to allocate the patients in unequal numbers to either the SWT or the NfWT group.
The researchers generated the random allocation sequence using a computer with a random number generator programmed with Visual Basic. In each hospital, after being placed on the waiting list, we informed the patient about the study and the patient provided his or her informed signed consent. The study nurse assigned participants to their groups after the decision for surgery had been made and informed the patient of the decision. A separate randomization procedure was performed within each hospital. Surgeons were blind to patient allocation. For ethical reasons, double-blinding was not possible.
The patients used a self-administered questionnaire to report their socio-demographic data, comorbidities as diagnosed by a medical doctor, HRQoL, disease-specific medication (DSM), ability to function and the degree of pain, and the use of health and social services.
The study was approved by the Helsinki University Central Hospital Surgery Ethics Committee (registration np. 134/E6/02).
Measurement of HRQoL
We measured HRQoL using the generic 15D instrument. The 15D is composed of fifteen dimensions: moving, vision, hearing, breathing, sleeping, eating, speech, eliminating, vitality, usual activities, mental function, discomfort and symptoms, depression, distress, and sexual activity. Each dimension has five ordinal levels to choose from. The 15D can be used as a profile measure or to give a single index score by means of population-based preference weights. The index score (15D score) ranges from 0 (dead) to 1 (completely healthy) (Reference Sintonen19). The 15D questionnaire takes 5–10 minutes to complete and it describes the HRQoL of the respondent at present. A difference of >|0.03| in the 15D score is clinically important in the sense that, on average, people can feel the difference (Reference Sintonen20). We chose to use the 15D for three main reasons: (i) it has been used successfully in earlier studies dealing with hip and knee replacement and thus facilitates a comparison of the presurgery scores in these studies; (ii) earlier research has shown that in most of the important properties (reliability, content validity, sensitivity in terms of discriminatory power and responsiveness to change), the 15D instrument compares at least equally with other similar instruments that produce a valuation-based single index number (Reference Hawthorne, Richardson and Day21;Reference Stavem22); and (iii) recent research has since confirmed that, especially in the rehabilitation of musculoskeletal disorders, the 15D instrument was at least as responsive as the SF-6D and much more responsive than the EQ-5D (Reference Moock and Kohlmann23).
By using the mean 15D scores from each measurement point, and by assuming a linear change in the scores between the measurement points, we also estimated the possible gain in quality-adjusted life-years (QALY gain) for both groups within the observation period. To obtain an equally long observation period for both randomized groups, we assumed that the final HRQoL scores in the SWT group would carry forward until the mean final measurement point in the NfWT group and that members of the SWT group would incur no further costs during that time.
Cost Data
The data on the usage of healthcare and social services were based on patients’ self-reports from the waiting time to 1 year postoperatively, which we measured in 3-month periods. We obtained the costs for the surgery from the Finnish Hospital Discharge Register. We valued the use of healthcare and social services at Finnish unit costs for the year 2006 (Reference Hujanen, Kapiainen and Tuominen24). The total direct costs include the following items: outpatient visits (doctor, nurse and chiropodist), the costs of the surgery including radiology, laboratory services, hospital days, and rehabilitation services. We multiplied the use and costs of regular social services due to OA, including meals-on-wheels, home help, laundry services, bathing services, and transportation, during the waiting time by the number of months spent on the waiting list. We carried out all analyses from a Finnish societal perspective, excluding production losses and value-added taxes.
We used the total costs thus calculated and the QALYs gained during the observation period to compare the cost-utility of SWT and NfWT separately for hip and knee patients. As even the longest observation period was shorter than 2 years, no discounting was applied.
Statistical Analysis
The sample size estimate was based on the primary outcome variable: the 15D score. A subgroup of 177 patients would provide an 80 percent power (two-tailed α error 5 percent) of detecting clinically important differences Δ0.03 in the mean 15D score between the randomized groups. We conducted primary analyses using the intention-to-treat (ITT) principle (Reference Hujanen, Kapiainen and Tuominen24), so that we could follow the patients in the groups to which they had been randomly allocated. As a secondary analysis we looked at patients in the different randomization groups with actually shorter and longer waiting times (per protocol analysis).
We compared the characteristics of the randomized groups and those who were lost to follow-up at baseline using either the independent samples t-test or the chi-squared test, depending on whether the variable was on a continuous or a nominal scale. In addition, we calculated the mean values for use and the costs of health and social services. To assess the degree of uncertainty in the results, we performed a probabilistic sensitivity analysis (bootstrapping with 1,000 replicates). The results are given in the form of mean incremental costs and effects with their 95 percent confidence intervals, an incremental cost-effectiveness ratio (ICER), a cost-effectiveness plane and a cost-effectiveness acceptability curve (CEAC).
We replaced the missing values on the 15D dimensions, if a minimum of 80 percent of the dimensions had been completed, using a regression model with the patient's responses for other dimensions, age and gender as explanatory variables (Reference Rissanen, Aro and Sintonen18). Data analyses were performed using SPSS versions 14 and 16 for Windows.
RESULTS
Patient Characteristics
Of the eligible patients invited to participate in the study, 235 (160 women) patients with a mean age of 70 years refused to participate and were excluded. The most frequently quoted reason for refusal was an unwillingness to complete the questionnaires. Thus, 833 patients, after providing informed consent, were randomly allocated to either the SWT (n = 346) or NfWT (n = 487) group (Figure 1). Of the 833 randomized patients, 24 did not return the questionnaire at baseline, although they had signed informed consent forms and had been randomized. Of the remaining 809 patients, 162 were lost to follow-up during the waiting time for various reasons and were not included in the final analyses (Figure 1). Due to missing values, the final cost-utility analyses are based on 550 (66 percent) of the randomized patients who completed the questionnaires, with a mean (±SD) age of 66 (±9.9; range; from 33 to 89) years, of which 345 (63 percent) were women and a further 243 (hip n = 130, knee n = 113) were in the SWT group and 307 (hip n = 149, knee n = 158) were in the NfWT group (Figure 1).
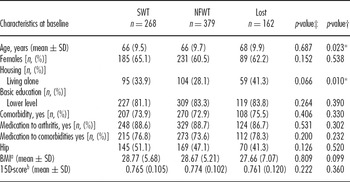
The baseline characteristics of the randomized groups were similar (Table 1). We have reported the details about the characteristics of these two patient groups in our earlier studies (Reference Hujanen, Kapiainen and Tuominen24;Reference Hollis and Campbell25). The mean (±SD) 15D score in the SWT group for hip patients was 0.770 (±0.09) and 0.779 (±0.10) in the NfWT group; the difference was neither statistically significant nor clinically important (95 percent confidence interval [CI] for a mean difference from −0.036 to 0.026). The mean (±SD) 15D scores at baseline for knee patients were 0.772 (±0.18) and 0.779 (±0.12), respectively (95 percent CI for a mean difference from −0.004 to 0.030) (Table 1). The percentage of patients receiving disease specific medication (DSM) was more than 87 percent in all patients groups.
Baseline Characteristics in Patients Waiting for Total Joint Replacement and Those Lost to Follow-up

*p<0,05.
‡Difference between the randomized groups.
†Difference between the patients, who remained in the study to the end of follow-up and those lost to follow-up.
aBody mass index (kg/m2).
b15D-score (scale 0 = worst, 1 = best).
Approximately 20 percent (n = 162) of the patients dropped out after randomization at any stage of the follow-up. The only statistically significant differences in the baseline characteristics between the dropouts and those, who remained in the study to the end of follow-up, were found in the mean age (dropouts slightly older) and in the proportion of living alone (among dropouts slightly higher) (Table 1).
Cost-Utility
The mean waiting time for hip patients was 74 (SD ± 145; n = 145) days in the SWT group and 194 (SD ± 175; n = 169) days in the NfWT group, and for knee patients 94 (SD ± 81; n = 123) days and 239 (SD ± 135; n = 210) days, respectively.
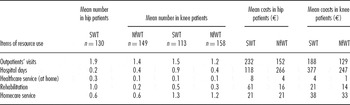
The 15D score improved after the operation in all four groups (Table 2). The mean (±SD) total costs for healthcare and social services are reported in Table 3.
Mean 15D Scores in the Randomized Groups of Hip and Knee Patients

*p<0.01.
Mean Use and Costs of Healthcare and Social Services during the Waiting Time between the Randomized Groups, in Hip and Knee Patients

aSum of different types of hospital outpatients’ units (University hospital, central hospital, district hospital, health care centre, private hospital, occupational health care unit).
bRegular homecare services due to osteoarthritis.
The mean total costs of TJR among hip replacement patients were EUR 9986 (±3,540) in the SWT group and EUR 10 472 (±4,686) in the NfWT group, and EUR 9809 (±4,085) and EUR 9801 (±3,116) among knee replacement patients, respectively. During the equally long follow-up period, the SWT hip patients experienced, on average, 1.341 QALYs and the NfWT patients 1.327 QALYs. Correspondingly, the SWT knee patients experienced, on average, 1.453 QALYs and the NfWT patients 1.467 QALYs (Supplementary Table 2, which can be viewed online at www.journals.cambridge.org/thc2013068). Point estimates thus suggest a strong dominance for SWT among hip patients but for NfWT among knee patients (Supplementary Figures 1, 2, which can be viewed online at www.journals.cambridge.org/thc2013069 and www.journals.cambridge.org/thc2013070). On the basis of probabilistic sensitivity analysis in hip patients, the 95 percent CI for the mean difference in QALYs was from −0.048 to 0.076 and in costs from −1453€ to 464€. In knee patients, the 95 percent CI for the mean difference in QALYs was from −0.095 to 0.063 and in costs from −913€ to 955€. If the willingness to pay for a QALY is EUR 20,000, the probability of SWT being cost-effective for hip patients is approximately 85 percent and approximately 40 percent for knee patients (Supplementary Figure 3, which can be viewed online at www.journals.cambridge.org/thc2013071).
In the secondary per protocol analysis the mean total costs among hip patients were EUR 10,302 (±3788) in the SWT group and EUR 10,402 (± 4854) in the NfWT group, and EUR 9,374 (±3259) and EUR 9904 (±3115) among knee patients, respectively. During the equally long follow-up period, the SWT hip patients experienced, on average, 1.3536 QALYs and the NfWT patients 1.3879 QALYs. Correspondingly, the SWT knee patients experienced, on average, 1.4428 QALYs and the NfWT patients 1.5022 QALYs. Point estimates thus suggest an ICER of EUR 3000 for NfWT among hip patients and of EUR 9058 among knee patients. However, there is a lot of variance around the point estimates and the differences in costs and QALYs between the per protocol groups were not statistically significant neither in hip nor knee patients.
DISCUSSION
Scientific evidence on the relationship between waiting time and outcomes for TJR is inconsistent. The absence of randomized trials has prevented an assessment of whether longer waiting is somehow related to HRQoL outcomes and costs. The present study compared the cost-utility of short and longer waiting times for TJR. To our knowledge, this study is the first one in which patients were randomly allocated to short and nonfixed waiting time groups when placed on the waiting list and followed according to the ITT principle.
The main finding of this study was that hip patients in the SWT group gained, on average, more QALYs at lower costs than patients in the NfWT group, suggesting a strong dominance for the SWT group. In knee patients the situation was the opposite. However, there is a high degree of uncertainty surrounding these results based on point estimates, and probabilistic sensitivity analyses indicated that if the willingness to pay for a QALY is EUR 20 000, then the probability of a SWT being cost-effective in hip patients is approximately 85 percent and only approximately 40 percent in knee patients.
It is to be noted although that our findings may not be fully transferable to other countries. Even by using the same HRQoL instrument and valuation algorithm, the HRQoL results may not be similar due to different indications of treatment. Transferability of costs is shadowed by differences across countries e.g. in treatment practices and unit costs.
Strengths and Limitations
There are some limitations to this study. First, a total of seventy-four patients in the SWT group waited for more than 3 months. The main reasons for this were the hospitals’ limited capacity to carry out TJR within the 3-month waiting time period or the patients’ unwillingness to be operated on within 3 months. Due to these factors, the differences between the randomized groups may have been underestimated and there might also be some bias in the use of health and social services. However, the primary analysis was based on the ITT principle to address the question of clinical effectiveness and to avoid the bias associated with a nonrandom loss of participants.
The per protocol analysis gave rise to further uncertainty over whether there is any real difference between the waiting time groups in cost-utility in either procedure. The point estimates suggested an ICER of EUR 3000 for NfWT among hip patients and of EUR 9058 among knee patients, but the differences in costs and QALYs between the per protocol groups were not statistically significant neither in hip nor knee patients.
Second, defining and measuring the waiting time for surgery is not a simple matter. What is the real starting point for the waiting period? According to Siciliani and Hurst (2003), one observable starting point is the time when a patient is first referred by a general practitioner to a hospital to be assessed for surgery. In the present study, the waiting time began when the practitioner first made the decision for surgery, even though patients may have already been waiting for an unknown amount of time before this decision. This might affect patients’ baseline quality of life, which was poor (Reference Siciliani and Hurst5).
Third, also establishing comparable QALYs and costs between the SWT and NfWT group is not without weaknesses, as the final measurements of HRQoL and costs in both groups did not take place equidistantly in time from the baseline. With our solution, the mean follow-up time is the same in both groups. However, we do not know exactly, how the HRQoL and costs in the SWT group developed during the time from the last measurement in that group to the final measurement in the NfWT group. The HRQoL may have deteriorated slightly due to ageing, but as the mean time difference between the last measurements in the groups was only 4–8 months, the change would probably be negligible; therefore, our assumption of no change may be justified. On the other hand, had the SWT group incurred further costs contrary to our assumption, its total cost would have been underestimated. As these changes would probably been marginal, they may have not affected our conclusions.
Another possible weakness is that approximately one-third of patients dropped out during the follow-up. However, apart from being slightly older and living slightly more frequently alone, the dropouts did not deviate in a statistically significant manner in their baseline characteristics from those, who remained in the study to the end of follow-up. Thus overall, the dropout may not bias our results significantly.
Finally, the costs of medication were not included in the final analyses; the costs have been reported in our earlier studies and the findings were that the cost trends were highest during the waiting time and lowest after the operation (Reference Tuominen, Sintonen and Hirvonen15;Reference Tuominen, Sintonen and Hirvonen26;27).
The strengths of this study are that the patients awaiting TJR were prospectively followed from the time of first being placed on the waiting list to admission—with waiting times recorded precisely—and further for a year postoperatively, providing evidence of the effect of waiting time on pre- and postoperative health status. Furthermore, the patients were randomly assigned to the SWT and NfWT groups; the randomization was successfully completed and the groups did not differ from each other at baseline.
CONCLUSION
According to the present study, there does not seem to be a significant difference in the cost-utility of short and longer waiting times for TJR, at least given the waiting time difference between our study groups.
SUPPLEMENTARY MATERIAL
Supplementary Table 1: www.journals.cambridge.org/thc2013067
Supplementary Table 2: www.journals.cambridge.org/thc2013068
Supplementary Figure 1: www.journals.cambridge.org/thc2013069
Supplementary Figure 2: www.journals.cambridge.org/thc2013070
Supplementary Figure 3: www.journals.cambridge.org/thc2013071
CONTACT INFORMATION
Ulla Tuominen, M.Sc. PhD Candidate, (ulla.tuominen@kela.fi), Social Insurance Institution of Finland, Helsinki, Finland
Harri Sintonen, PhD, Professor, Hjelt Institute/Department of Public Health, University of Helsinki, Finland
Pasi Aronen, M.Sc., Hospital Distric of Helsinki and Uusimaa, Helsinki, Finland
Johanna Hirvonen, PhD, Mikkeli University of Applied Sciences, Mikkeli, Finland
Seppo Seitsalo, MD, PhD, Professor, Orton Orthopaedic Hospital, Helsinki, Finland
Matti Lehto, MD, PhD, Professor, University of Tampere, Finland
Kalevi Hietaniemi, MD, Hospital District of Helsinki and Uusimaa, Finland
Maria Blom, PhD, Professor, Division of Social Pharmacy, Faculty of Pharmacy University of Helsinki, Finland
CONFLICTS OF INTEREST
Harri Sintonen is the developer of the 15D and receives royalties from the electronic version of the 15D. He is a member of scientific advisory boards of MSD and Eli Lilly and has received consultancy fees or honoraria from several medical companies. The other authors report no potential conflicts of interest.