Introduction
Improved health in the Western world has resulted in greater longevity, prompting research efforts to define successful aging. Rowe and Kahn (Reference Rowe and Kahn1997) initially operationalized “successful aging” as freedom from disease or disease-related disability, high cognitive and physical functioning, and active engagement with life. Although these dimensions of successful aging have been closely linked to exceptional longevity, older adults report valuing different indicators of successful aging (Phelan et al., Reference Phelan, Anderson, LaCroix and Larson2004; Depp and Jeste, Reference Depp and Jeste2006).
Positive aging phenotypes, as distinct from successful aging, encompass the experiences of older adults who are not free of disease or disability but who are able to adapt to and transcend related challenges (Woods et al., Reference Woods2012). To date, there has been limited effort to identify positive aging phenotypes that emphasize physical, social, and emotional functioning (EF). Our analyses of data from Women's Health Initiative (WHI) participants, age 65 and over, yielded a two-factor phenotype of positive aging: Physical-Social Functioning (PSF) and EF. PSF included measures of general health, role limitations due to physical causes, physical functioning, social functioning, and energy/fatigue. EF included self-rated quality of life, role limitations due to emotional causes, and emotional well-being. These two factors predicted healthy life span, years of independent living, and years to mortality better than the individual subscales used to construct the factors (Woods et al., Reference Woods2012). Each standard deviation of increase in PSF was accompanied by a 21% reduction in mortality risk, a 17% reduction in risk of major health conditions, and a 26% reduction in risk of dependent living. A similar increase in EF scores was associated with a smaller, but significant, 7% reduction in risk of mortality, a 5% reduction in risk of major health conditions, and a 12% reduction in risk of dependent living, when positive aging factors were fitted in the same model. Although PSF and EF factors underscore the main constituents of the positive aging phenotype, and might somehow resemble Rowe and Kahn's (Reference Rowe and Kahn1997) constructs of successful aging, none completely overlap both. In addition, the human functioning indexes presented here provide a unique perspective that harmonizes multiple dimensions of the positive aging experience. These dimensions resonated in elderly respondents’ views on positive aging phenomena (Phelan et al., Reference Phelan, Anderson, LaCroix and Larson2004). A sensitivity to change over the life span and in relation to changing health is the next step in exploring a positive aging phenotype.
Few investigators have examined longitudinal trajectories of “positive aging” (Minicuci et al., Reference Minicuci, Marzari, Maggi, Noale, Senesi and Grepaldi2005; Kaplan et al., Reference Kaplan, Huguet, Orpana, Feeny, McFarland and Ross2008). Seeking to understand patterns of thriving in older adulthood, Kaplan and associates (2008) classified older adults by trajectories of health using a Health Utilities Index of vision, hearing, speech, ambulation, dexterity, emotion, cognition, and pain/disability. Thrivers (8%) maintained exceptional health with no or mild disability, nonthrivers (47%) experienced moderate or severe disability; 36% of participants died during follow-up, and 9% were institutionalized. Although this approach to understanding trajectories of positive aging is useful, thriving focuses on the absence of disability instead of preclinical criteria that might differentiate high-functioning positive aging from less healthy states. This paper is one of the first attempts to characterize a positive aging phenotype based on integrated human functioning indexes over an extended period. We sought to examine trajectories of these indexes that empirically differentiate older women who retain optimal PSF and EF during a large, long-term clinical trial (CT) from those who do not. The specific aims of this study were the following:
-
1. Describe trajectories of two positive aging factors (PSF and EF) over time (baseline, years 1, 3, 6, and 9) in older WHI participants.
-
2. Characterize the longitudinal association between the PSF and EF trajectories.
-
3. Differentiate among trajectories of positive aging over time based on baseline demographic characteristics, health behaviors, health status, and personal and social factors.
Methods
Design and data
The WHI is a study of postmenopausal women's health and risk factors for cancer, heart disease, and osteoporotic fractures. It was designed as a set of randomized controlled CTs and an observational study (OS). Details of the design, recruitment strategies, data collection methods, and baseline data are available elsewhere (Anderson et al., Reference Anderson2003; Hays et al., Reference Hays2003). Briefly, women ages 50 to 79 were recruited for the WHI from 1993 to 1998 at 40 clinical centers in the United States, which yielded a diverse population of postmenopausal women, of whom 18% were from underrepresented racial and ethnic groups. Women were excluded for medical conditions with a predicted survival of 3 years or less, for conditions limiting adherence or retention (e.g., alcohol or drug dependency and dementia), or for active participation in any other intervention study. The CTs (N = 68,132) included three overlapping components: the hormone therapy trial (N = 27,347), the dietary modification trial (N = 48,835), and the calcium and vitamin D trial (N = 36,282). Eligible women could be randomized into one, two, or all three of the CTs. Trial assignment was random. Women who were ineligible or unwilling to join the CTs were invited to join the OS, in addition to those who were specifically recruited for the OS. The CT women attended baseline and protocol-defined clinical visits. WHI staff followed up with the CT participants for a median of 8.0 years. All WHI participants provided written informed consent, and institutional review board approval was obtained at each of the 40 WHI clinical centers and at the Clinical Coordinating Center at the Fred Hutchinson Cancer Research Center, Seattle, Washington. In the present study, we focused on data from women age 65 years or older (at baseline) who enrolled in one or more of the CTs and who had positive aging indicators measured at baseline and in years 1, 3, 6, and 9. Longitudinal positive aging indicators were collected in a random subsample from among roughly 6% of CT participants (N = 5,626, oversampled for racial/ethnicity minority). Within this subsample, the 2281 women who were 65 years or older at baseline composed our analytic sample. However, the number of women whose data were available for these analyses varied over time, primarily because there was variability in length of follow-up, with protocol-defined age-distribution goals resulting in younger age cells being closed to recruitment earlier than older age cells (Hays et al., Reference Hays2003).
Measures
Positive aging indicators
Based on our earlier factor analyses of data from WHI participants, we identified two factors of a multidimensional positive aging phenotype: PSF and EF (Woods et al., Reference Woods2012). PSF measures were assessed using general health, physical role functioning, physical functioning, social role functioning, and vitality SF-36 subscales (Ware and Sherbourne, Reference Ware and Sherbourne1992; scored from 0 to 100; higher score reflecting better health). EF measures included emotional role functioning, and emotional well-being SF-36 subscales; in addition to self-rated quality of life scale. Women rated their quality of life from worst (0) to best (10). The summary measures were calculated as in Woods et al.: the sum of standardized values of the five and three indicators for PSF and EF indexes, respectively.
Predictors
Comprehensive data on demographic, health-behavior, health-status, and personal and social factors were collected using well-established self-reported measures (Matthews et al., Reference Matthews1997) at baseline. Demographic characteristics included family income, education, and ethnicity. Health behavior items related to smoking and alcohol consumption. Smoking was a three-category variable: never smoker/past smoker/current smoker. Alcohol intake was a four-category variable: nondrinker (non- and past drinker), mild drinker (<1 drink per week), moderate drinker (<7 drinks per week), and heavy drinker (7+ drinks per week).
Health status measures, or comorbidities, included self-reported history of coronary heart disease, heart failure, stroke, treated diabetes mellitus, hypertension, arthritis, cancer, and history of hip fracture. The total number of chronic conditions was calculated. Body mass index (BMI) at baseline was calculated as weight in kilograms divided by height in meters squared and rounded up to the nearest tenth. Sleep disturbance was assessed by the Insomnia Rating Scale (Levine et al., Reference Levine2003), with a summary score ranging from 0 to 20; a higher score indicated greater sleep disturbance. Pain was measured as bodily pain on the SF-36 with a score ranging from 0 to 100; a higher score indicated better health/lower pain. Physical activity was assessed by self-report, with total expenditure of energy calculated in metabolic equivalent of tasks (METs). General symptoms were assessed using a 34-item symptom checklist, measuring the occurrence and severity of symptoms in the last 4 weeks. Scores ranged from 0 to 3; a higher score indicated more symptoms. Depression symptoms were assessed using the short form of the Center for Epidemiological Studies Depression scale (Burnam et al., Reference Burnam, Wells, Leake and Landsverk1988). Scores ranged from 0 to 10; a higher score indicated a greater likelihood of depression.
Personal factors included optimism using a Life Orientation Test–Revised Scale (Scheier and Carver, Reference Scheier and Carver1985), with possible scores ranging from 6 to 30; a higher score indicated greater optimism. Education was assessed using the highest degree completed.
Social factors included negative life events using a questionnaire from the Alameda County Study (Berkman and Syme, Reference Berkman and Syme1979). Scores ranged from 0 to 11; a higher score indicated a greater number of negative events. Social support was assessed by participants’ self-report of how often different types of support were available to them (Sherbourne and Stewart, Reference Sherbourne and Stewart1991). Scores ranged from 9 to 45; a higher score indicated greater support.
Although Depp and Jeste (Reference Depp and Jeste2006) underscored the relative importance of the factors being examined in the present study, no other studies have systematically tested the strength of the personal, social, and health-related correlates of positive aging as an operationally defined, dependent variable.
Analyses
Descriptive statistics were used to describe individual indicators of positive aging and their summary factor scores (PSF and EF index scores) at each time point. Latent class growth modeling (Nagin, Reference Nagin2005) was then used to identify distinct subgroups of individuals who followed a similar pattern of change over time on each of the two dimensions of positive aging. A set of model parameters (intercept and slope) was estimated for each of the identified trajectories based on maximum likelihood estimation. Given the continuous nature of the PSF and EF index scores, and given that the data were collected at up to five time points (i.e., baseline, years 1, 3, 6, and 9), normal distribution functions with a quadratic term were fitted to the data. Through a process similar to that for latent class analysis, parameters were estimated to define the shape of the trajectories and the probability of trajectory group membership (Nagin, Reference Nagin2005). The maximum probability assignment rule was used to assign each woman to the trajectory group for which she held the highest posterior membership probability. The number of groups was chosen based on the following selection criteria: (1) interpretability, (2) theoretical justification, (3) parsimony, (4) lowest Bayesian Information Criteria (BIC) score, (5) Lowest Akaike Information Criterion (AIC), (6) average posterior probability in each class >0.70 and no more than 15% overlap/cross-membership between noncontiguous clusters, and (7) at least 5% of total count in each group. Similar criteria were applied to estimate shapes of the trajectories, with all possible combinations of polynomial trajectory functions among subgroups being tested. A detailed theoretical and practical exemplar of latent class growth modeling using WHI data can be found elsewhere (Zaslavsky et al., Reference Zaslavsky, Cochrane, Herting, Thompson, Woods and Lacroix2014).
Multinomial logistic regression was carried out to identify predictors of the positive aging trajectories using baseline data. Forward–backward, stepwise selection of demographic, personal characteristics, health-related behaviors, general symptoms, and social relationships was utilized. Only variables that yielded the best-fitted model in terms of AIC and BIC were included in the regression analysis. Analyses were conducted using the SAS package (SAS, Windows build 9.1.3 Service Pack 4, SAS Institute Inc., Cary, NC, U.S.A.). Group-based trajectory modeling was conducted using the PROC TRAJ application (Jones et al., Reference Jones, Nagin and Roeder2001). Full information maximum likelihood estimation was used to integrate all available information based on missing-at-random assumptions in a latent class growth modeling framework. In logistic regressions list-wise deletion was carried out. All statistical tests were two-sided, with a p value of less than 0.01 considered statistically significant to mitigate effects of multiple testing.
Results
Longitudinal characteristics
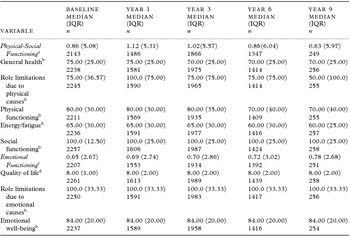
Table 1 identifies the median and interquartile range of PSF and EF Index Scores and indicators of each factor over time (baseline, years 1, 3, 6, and 9).
Positive aging indicators and index scores over time in older women's health initiative clinical trial participants (N = 2281)

aPhysical-Social Functioning Index = sum of standardized values of the five indicators.
bFrom SF-36(10). Scored 0–100; higher score = better health.
cEmotional Functioning Index = sum of standardized values of the three indicators.
dScored 0–10; higher score = better quality of life.
IQR = Interquartile range.
Trajectories of change
Physical-social functioning
When modeling PSF using the latent class growth algorithm, we found that model fit statistical criteria improved with increasing numbers of trajectory groups. However, we noted a less dramatic change when going from a five-trajectory to a six-trajectory model or higher (see Table S1, published as supplementary material online attached to the electronic version of this paper at http://journals.cambridge.org/ipg). Also, when models contained six or more trajectories, one or more trajectories failed to capture at least 5% of the sample. Our final decision to select a five-trajectory model was based on the following: an improvement in model selection criteria when comparing one- to four-trajectory models, an adequate sample size in each of the estimated clusters, reasonably good average posterior probabilities of group membership (range 0.73–0.91, mean 0.8), and adequate interpretability (see Tables S2 and S3, published as supplementary material online attached to the electronic version of this paper at http://journals.cambridge.org/ipg).
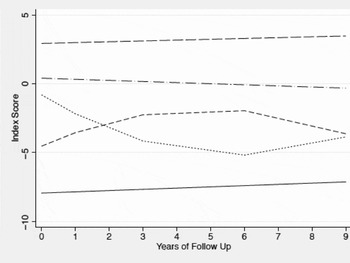
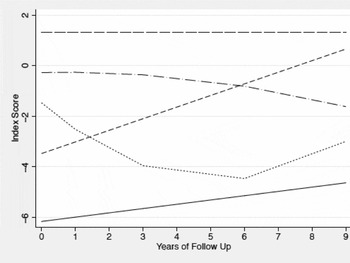
Figures 1 and 2 illustrate estimated longitudinal dynamics of the two positive aging dimensions. To simplify interpretation, we labeled each of the derived trajectories such that the first word denoted an ordinal ranking of that trajectory's intercept relative to the other trajectories (high, medium, and low), and the second word indicated direction of change over time (decliner and increaser).
Estimated five trajectories of physical-social functioning index scores during 9 years of follow-up in older women's health initiative clinical trial participants (N = 2281). Results are from regression via latent class growth models. Estimated groups are depicted as: low maintainers (8.3%)a = solid; mid-low improver (10.4%)a = short dashed; medium decliner (10.7%)a = dotted; mid-high maintainer (31.2%)a = dashed dotted; high maintainer (39.4%)a = long dashed. a(%) – percentage from a total sample in a given group.

Estimated five trajectories of emotional functioning index scores during 9 years of follow-up in older women's health initiative clinical trial participants (N = 2281). Results are from regression via latent class growth models. Estimated groups are depicted as: low maintainers (3%)a = solid; mid-low improver (9%)a = short dashed; medium decliner (7.7%)a = dotted; mid-high maintainer (22.8%)a = dashed dotted; high maintainer (57.5%)a = long dashed. a(%) – percentage from a total sample in a given group.

Figure 1 depicts the five estimated trajectories of PSF. Almost one-tenth of the sample (n = 188, 8.3%) fell into a consistently low level of PSF (Low Maintainers; LM). The second trajectory, Mid-Low Improvers (MLI), included 10.4% (n = 235) of the sample, who experienced a relatively high rate of improvement during the first 6 years of follow-up followed by a reverse of this trend thereafter. The third trajectory, Medium Decliners (MD; n = 241, 10.7%), demonstrated a relatively steep rate of decline from baseline up to year 6 and then an upward pattern during the remaining follow-up period. The fourth trajectory, Mid-High Maintainer (MHM; n = 706, 31.2%), had relatively constant PSF during 9 years of follow-up with a slight annual decline (Slope = −0.08, 95% CI = 0.02–0.14). The last and largest trajectory, High Maintainer (HM), described 39.4% of the sample (n = 890), who had relatively stable high PSF.
Emotional functioning
EF trajectory modeling followed a pattern of change in model fit criteria similar to PSF, so a five-trajectory model was also selected to best represent these data.
Figure 2 illustrates the five estimated trajectories of EF. Only 3% of the sample (n = 67) fell into a consistently low level of EF (Low Maintainers; LM). The second trajectory, Mid-Low Improvers (MLI), included 9% (n = 205) of the sample with a relatively high rate of improvement (Slope = 0.46, 95% CI = 0.38–0.54) during all years of follow-up. The third trajectory, Medium Decliners (MD; n = 174, 7.7%), had a relatively steep rate of decline from baseline to year 6 with a rising pattern thereafter. The fourth trajectory, Mid-High Maintainers (MHM; n = 706, 22.8%), had relatively stable EF during the first 3 years of follow-up and an accelerated annual decline thereafter. The last and largest trajectory, High Maintainers (HM), described 57.5% of the sample (n = 1307), with consistently high EF.
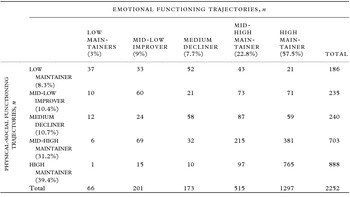
As seen in Table 2, PSF and EF trajectories were positively associated, Χ 2(16, N = 2,252) = 979.1, p < 0.001. Nonetheless, continuously high EF over time was less dependent on high PSF than was high PSF on EF stability. Specifically, 12% of individuals who were members of the LM, MLI, or MD trajectories of PSF were members of the highest EF trajectory (HM), but only 3% of women who were in the highest PSF trajectory group were also members of the LM, MLI, or MD trajectories of EF. Similarly, 19.5% of women with high EF trajectories (HM or MHM) were members of low PSF trajectories (LM, MLI, or MD), but only 8.4% of women with high PSF were also members of the lowest EF trajectories.
Cross-classification of emotional functioning and physical-social functioning trajectories of positive aging in older women's health initiative clinical trial participants (N = 2252)

Chi-square test of independence: X 2 (16, N = 2,252) = 979.1, p < 0.001).
Predictors of trajectory-group membership
Physical-social functioning
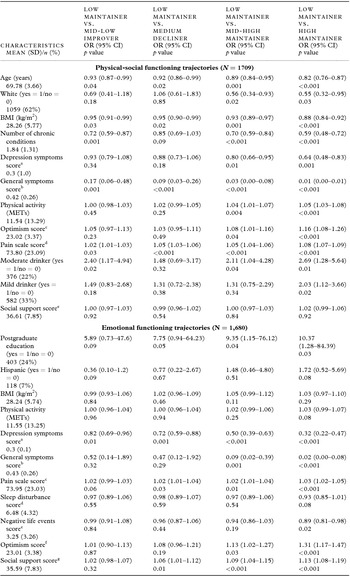
Predictors of membership in the PSF trajectories were finalized using a stepwise procedure and examined using multinomial logistic regression. Odds ratios (ORs) were estimated from the final prediction model using the LM group as the reference category (Table 3).
Odd ratios (OR) and 95% confidence intervals (CI) from a multinomial logistic regression of physical-social and emotional functioning trajectories of positive aging. Estimating the effect of predictors on the likelihood of being in the low maintainer versus mid-low improver, medium decliner, mid-high maintainer, and high maintainer trajectory groups, in older women's health initiative clinical trial participants

All variables entered simultaneously into the model. ORs >1 denote benefit. BMI = body mass index; METs = metabolic equivalent of tasks; SD = standard deviation; % = percentage of total sample.
aScored 0–10, higher score = a greater likelihood of depression.
bScored 0–3, higher score = more symptoms.
cScored 0–100, higher score = less pain.
dScored 0–20, higher score = greater sleep disturbance.
eScored 0–11, higher score = more negative life events.
fScored 6–30, higher score = greater optimism.
gScored 9–45; higher score = greater support
Compared to the LM reference group, MLIs were younger, had lower BMI and fewer chronic conditions and general symptoms, scored more favorably on the pain scale, and were more likely to be moderate drinkers. MDs were also younger and had lower BMI, fewer general symptoms, and less pain. Similarly, the MHMs were younger; had lower BMI, fewer chronic conditions and general symptoms and less pain, were less depressed and more physically active, had higher optimism, and were more likely to be moderate drinkers. Finally, the HMs were younger, had lower BMI and less depression, were less likely to be White, had fewer chronic conditions and general symptoms and less pain, were more physically active, had higher optimism, and were more likely to be mild or moderate drinkers than LMs.
Emotional functioning
Predictors of EF trajectories were similarly derived using a stepwise procedure and examined using multinomial logistic regression. ORs were estimated using the LM group as the reference category (Table 3).
Briefly, MLIs were less depressed than the LM reference group. MDs were also less depressed, scored more favorably on the pain scale, and had more social support. MHMs had more education, fewer general and depression symptoms, less pain, more social support, and higher optimism. Finally, HMs also had more education, fewer general and depressive symptoms, fewer negative life events, less pain, higher optimism, and more social support than LMs.
Discussion
This study described trajectories and correlates of positive aging dimensions over time, based on a previously developed and validated phenotype of PSF and EF that was associated with health-related outcomes of healthy life span, years of independent living, and years to mortality (Woods et al., Reference Woods2012). Most studies of positive aging have examined longitudinal patterns and classify individuals according to one or more health trajectories based on subjective categorization and a priori assumptions (Minicuci et al., Reference Minicuci, Marzari, Maggi, Noale, Senesi and Grepaldi2005; Kaplan et al., Reference Kaplan, Huguet, Orpana, Feeny, McFarland and Ross2008). Our data-driven statistical approach quantified an individual's group membership in the form of probabilities, based on an empirical approach. Our study is also one of the first attempts to track both PSF and EF dimensions and to examine their association in a very large elderly cohort (n = 2281) over an extended period (up to 9 years).
Five distinct trajectories of both positive aging dimensions were identified for older participants in the WHI CT. The number and shape of these trajectories were similar to longitudinal patterns identified in other studies (Kaplan et al., Reference Kaplan, Huguet, Orpana, Feeny, McFarland and Ross2008; Gill et al., Reference Gill, Gahbauer, Han and Allore2010). Taken together, these findings suggest that although there is substantial heterogeneity among aging individuals, overall categories of functioning could be distinguished in concordance with successful aging (Rowe and Kahn, Reference Rowe and Kahn1997) and variability in normal and pathological aging (Fried et al., Reference Fried2001). Future research is needed to examine whether individuals who fail to maintain high levels of positive aging become physically and cognitively frail or whether positive aging and frailty are two independent psycho-physiological processes rather than opposite ends of a continuum.
More than 70% of these older community-dwelling women were classified as either High or Mid-High Maintainers of PSF over 9 years of follow-up. This finding greatly exceeds the 8% estimate of “thrivers” reported by Kaplan et al. (Reference Kaplan, Huguet, Orpana, Feeny, McFarland and Ross2008) and falls within upper estimates of successful aging prevalence reported by Depp and Jeste (Reference Depp and Jeste2006). In contrast to other studies that defined successful aging as absence of disease, disability, or cognitive impairment or, alternatively, as an aggregate of high neurocognitive, psycho-emotional, and functional status, this study relied on finer-grained conceptual indicators of positive aging that allow one to distinguish between its physical-social and emotional mechanisms. In addition, the prospective nature of the current study allowed an examination of longitudinal dynamics in high- or low-functioning individuals over up to 9 years of follow-up.
We also demonstrated that the impact of high and stable EF on PSF might be greater than the effects in the opposite direction. There is ample evidence that negative emotional affect is associated with functional decline over time (Lenze et al., Reference Lenze2001; Mehta et al., Reference Mehta2007); however, only a few studies have explored the longitudinal effects of disability on EF among older adults (Kurland et al., Reference Kurland, Gill, Patrick, Larson and Phelan2006). Independence of the emotional from the physical-social functional dimensions of positive aging may exemplify transcendence of mind over body as one accumulates age-related physical and social limitations. These distinctions are consistent with a positive aging paradigm (Strawbridge et al., Reference Strawbridge, Wallhagen and Cohen2002; Phelan et al., Reference Phelan, Anderson, LaCroix and Larson2004) and have important clinical implications in that the effects of interventions to promote sustainable EF might diffuse to other domains of positive aging.
Consistent with other studies (Strawbridge et al., Reference Strawbridge, Cohen, Shema and Kaplan1996; Minicuci et al., Reference Minicuci, Marzari, Maggi, Noale, Senesi and Grepaldi2005; Kaplan et al., Reference Kaplan, Huguet, Orpana, Feeny, McFarland and Ross2008) and systematic reviews (Depp and Jeste, Reference Depp and Jeste2006), this analysis showed that high-functioning trajectories of positive aging were closely linked to demographic factors, personal characteristics, health and health-related behaviors, and social factors. Unlike other studies that suggested that socioeconomic factors were related to successful aging (Strawbridge et al., Reference Strawbridge, Cohen, Shema and Kaplan1996; Kaplan et al., Reference Kaplan, Huguet, Orpana, Feeny, McFarland and Ross2008), the final models in our study did not find these variables to be significant predictors of PSF or EF trajectory groups. There is strong evidence that education, income, and other socioeconomic characteristics are important determinants of health (Braveman et al., Reference Braveman, Cubbin, Egerter, Williams and Pamuk2010), but their effect on these positive aging longitudinal trajectories was attenuated, presumably due to the multidimensional nature of the phenotype that extends beyond physical health and emphasizes functioning.
The strong positive associations between baseline behavior-related variables (greater amount of physical activity, mild/moderate alcohol consumption) and a woman's membership in high-functioning trajectories of positive aging might hold promise for developing behavioral interventions that could help elderly people maintain optimal physical and social functioning. This deserves further longitudinal analyses modeling the effects of time-varied covariates on indicators of integrated human functioning. Consistent with our findings, the positive effect of moderate alcohol consumption has been reported over time in initially cognitively intact older cohorts (Wang et al., Reference Wang, van Belle, Kukull and Larson2002). Of note, health behaviors were significant predictors of the Physical-Social dimension of positive aging but not the Emotional dimension. Interventions that focus merely on health-related behaviors might have limited potential for promoting optimal functioning in older adulthood, given that other predictors were closely linked to both the PSF and EF indexes (see Figure S1, published as supplementary material online attached to the electronic version of this paper at http://journals.cambridge.org/ipg). For instance, interventions aimed at managing pain and other symptoms, as well as fostering higher optimism and fewer depression symptoms, would simultaneously benefit both functional dimensions of positive aging.
Limitations of this study should be considered. First, older women with low levels of physical, social, and EF were less likely than women with higher levels of functioning to be interested in or eligible for the WHI or to complete follow-up occasions once they joined. Loss to follow-up may underestimate the proportion of older women at risk of being in low-functioning trajectories. However, rather than determining the prevalence of positive aging, the aim of this analysis was to describe its heterogeneity over time, based on the recently developed phenotype. Generally speaking, the trajectory groups identified in our study represent one analytic approach to summarizing longitudinal patterns in aging individuals. Although we measured many traditional risk factors that would predict certain trajectories of positive aging, other unmeasured variables, such as cognitive status or physical capacity, may have affected this association. Inclusion of these other variables could increase our understanding of positive aging mechanisms and deserve consideration in future research.
Our study also had unique strengths. A robust statistical method of group-based trajectory modeling (Nagin, Reference Nagin2005) was used to identify subgroups with distinct trajectories of change over time. Traditional growth-curve modeling is generally useful for investigating research questions with an underlying assumption that most individuals follow similar patterns of change (Nagin and Odgers, Reference Nagin and Odgers2010). However, some phenomena, such as depressive symptoms (Ferro et al., Reference Ferro, Avison, Campbell and Speechley2011) or disability (Gill et al., Reference Gill, Gahbauer, Han and Allore2010), demonstrate a multinomial pattern. In such circumstances, traditional growth-curve modeling can mask significant differences and lead to erroneous inferences about change over time. Therefore, assuming population heterogeneity in longitudinal trajectories of positive aging dimensions, we implemented group-based trajectory modeling. To our knowledge, this is the first study that uses a data-driven approach to quantify the heterogeneity of positive aging indicators over time. Other strengths include the analysis of demographic, personal, social, and health-related predictors of longitudinal patterns of change in a large and ethnically diverse sample of older American women, as well as the prospective design and relatively long follow-up period.
Conclusion
Aging women are heterogeneous in terms of PSF and EF trajectories of positive aging over up to 9 years of follow-up. Baseline characteristics that correlate with a woman's membership in these longitudinal trajectories included demographic characteristics, modifiable health factors (physical activity, alcohol consumption, BMI), psychosocial factors (life events, optimism, and social support), and health-related factors (pain, symptoms, and comorbidities). Interventions aimed at promoting sustainable EF seem to be a worthy investment in that benefits of such efforts might diffuse to other domains of healthy aging. These results suggest healthy aging promoting strategies that are appropriate in clinical and community settings.
Conflict of interest
The WHI program is funded by the National Heart, Lung, and Blood Institute, National Institute of Health, U.S. Department of Health, and Human Services through Contracts N01WH22110, 24152, 32100-2, 32105-6, 32108-9, 32111-13, 32115, 32118-32119, 32122, 42107-26, 42129-32, and 44221. The funding agency had no role in the design or conduct of the study; collection, management, analysis, or interpretation of the data; or preparation, review or approval of the manuscript.
Description of authors’ role
Drs. Zaslavsky, Cochrane, Woods, LaCroix, and Herting and Ms. Liu had full access to all of the data used in the study and take responsibility for the integrity of the data and accuracy of data analysis. Zaslavsky, Cochrane, and Woods: study concept, design, interpretation of data, and preparation of manuscript. Zaslavsky and Liu: data analysis and visualization. Goveas, Johnson, Kuller, Martin, Michael, Robinson, Stefanick, and Tinker: preparation of manuscript.
Acknowledgments
The authors thank the WHI investigators and staff for their dedication and the study participants for making the program possible. A listing of WHI investigators can be found at https://cleo.whi.org/researchers/Documents%20%20Write%20a%20Paper/WHI%20Investigator%20Short%20List.pdf