Introduction
Despite continuous warnings, tropical forests have been constantly transformed in the Brazilian Legal Amazon (BLA) due to human activities, mainly settlements, agriculture and cattle ranching, and hydropower generation (Silva et al. Reference Silva, Santilli, Sano and Laneve2021). Efforts towards forest preservation have increased since the re-democratization period in the mid-1980s when Brazilian authorities sought to monitor and control land occupation (Hecht Reference Hecht2011). Deforestation monitoring was systematically implemented and the Brazilian National Institute for Space Research (INPE) has been calculating deforestation rates annually since 1988 through the Program for Deforestation Monitoring (PRODES). Additionally, the Cadastro Ambiental Rural (CAR; Rural Environmental Registry) was implemented in the states of Mato Grosso and Pará in 2008 and 2009, respectively, which served as models for the National Rural Environmental Registry System (SICAR; Azevedo et al. Reference Azevedo, Rajão, Costa, Stabile, Macedo and dos Reis2017) that was effectively implemented in 2012 (Sturm et al. Reference Sturm, Cacciamali, Vieira, Freddo, Amaral and Ansarah2020). The SICAR obliged landowners to register their properties and any remaining forests through satellite images, allowing authorities to easily monitor forest changes on private properties (Nepstad et al. Reference Nepstad, McGrath, Stickler, Alencar, Azevedo and Swete2014, Azevedo et al. Reference Azevedo, Rajão, Costa, Stabile, Macedo and dos Reis2017).
The agribusiness sector reacted to these control measures by demanding changes in environmental and land policies and amendments to the Brazilian Forest Code (BFC) of 2012 (Law no. 12651; Saito & Azevedo Reference Saito and Azevedo2017). Changes included amnesty for illegal deforestation that occurred before 2008, a reduction in riparian buffer sizes, allowing Permanent Preservation Areas (marginal strips with native vegetation; APP as the Brazilian acronym) to count towards the Legal Reserve, and reducing the environmental debt among landowners and their obligation to restore areas (Daugeard & Tourneau Reference Daugeard and Tourneau2018, Soares-Filho & Rajão Reference Soares-Filho and Rajão2018, Garret et al. Reference Garret, Cammelli, Ferreira, Levy, Valentim and Vieira2021). Other attempts, some of them successful, were made to lower environmental licensing requirements, suspend the ratification of indigenous lands, disqualify protected areas and facilitate obtaining the deeds of illegally deforested areas by land-grabbers (Soares-Filho & Rajão Reference Soares-Filho and Rajão2018). Some amendments were also made under President Michel Temer: the Constitutional Amendment Proposal PEC241 froze the budget of the Ministry of the Environment for 20 years, and PEC65 relaxed the environmental controls on construction; these changes have been linked to increasing land speculation and land-grabbing (Garret et al. Reference Garret, Cammelli, Ferreira, Levy, Valentim and Vieira2021).
These control instruments and law changes affected the array of landowner types in different ways. Thus, different landowner types played different roles in deforestation practices and demands for legislative changes, suggesting a need to understand the deforestation patterns associated with landowner types (Chomitz & Thomas Reference Chomitz and Thomas2001, Pacheco Reference Pacheco2009, Godar et al. Reference Godar, Gardner, Tizado and Pacheco2014). Studies of deforestation in the BLA by landowners have generally focused on one or two specific states, such as Mato Grosso and Pará (Roe et al. Reference Roe, Rausch, Munger and Gibbs2016, Assunção et al. Reference Assunção, Gandour, Pessoa and Rocha2017, Azevedo et al. Reference Azevedo, Rajão, Costa, Stabile, Macedo and dos Reis2017, Garcia et al. Reference Garcia, Rausch, Roe, Gibbs and Munger2018). It is now necessary to understand the deforestation patterns on broader spatial and temporal scales, as well as the impacts of different types of landowners on these patterns (Wang & Caldas Reference Wang and Caldas2014).
The present study aimed to investigate the role that each type of private landownership has played in deforestation in the BLA, using PRODES and the Brazilian Annual Land Use and Land Cover Mapping Project (MapBiomas) data at 2-year intervals during 2000–2020. Studies of deforestation on private properties (Landau et al. Reference Landau, da Cruz, Hirsch, Pimenta and Guimarães2012, Godar et al. Reference Godar, Gardner, Tizado and Pacheco2014, Assunção et al. Reference Assunção, Gandour, Pessoa and Rocha2017) suggest that landowner type can be characterized by the size of their properties, with each landowner developing their own logic of land exploitation. Thus, it was assumed here that property size is the main criterion and proxy of landowner type. Deforestation in protected areas and indigenous lands has been analysed by Cabral et al. (Reference Cabral, Saito, Pereira and Laques2018), so here only private properties outside of protected areas (except those where land-use activities were permitted) and indigenous lands were considered. We also characterized the distribution of landowner types and forests and analysed the importance of the CAR according to the trajectory of forest cover change processes.
Methods
The Brazilian Legal Amazon and the Rural Environmental Registry (CAR)
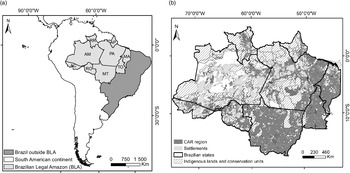
The study area encompassed all CAR-registered properties located inside the BLA, comprising an area of c. 1 918 995 km2, which is c. 37.7% of the total region, with most of the rest being made up of protected areas (Fig. 1a & b & Supplementary Appendix S1, available online).
(a) Location of the Brazilian Legal Amazon (BLA) on the South American continent and in Brazil, and the nine federal states within it: Acre (AC), Rondônia (RO), Amazonas (AM), Roraima (RR), Mato Grosso (MT), Pará (PA), Amapá (AP), Tocantins (TO) and Maranhão (MA). (b) Location of the Rural Environmental Registry (CAR) area within the BLA.

The CAR is the central territorial reference because it is an electronic public register that is mandatory for all rural properties, and it is the sole source of records capable of characterizing rural properties by size or landowner type. Implementing the CAR is the responsibility of each state government, and all state CAR registrations are integrated into a national system known as the SICAR (Azevedo et al. Reference Azevedo, Rajão, Costa, Stabile, Macedo and dos Reis2017). According to Chiavari et al. (Reference Chiavari, Lopes and de Araujo2020), all states have already begun property registration and validation in the CAR; however, they have been slow in its implementation.
CAR selection criteria
Private property boundaries were obtained from the CAR database (CAR 2021) provided by the Brazilian Forest Service (SFB) in December 2018. Since there was no information about the changes over the years, the CAR boundaries were considered constant during the studied period, and the inconsistencies and overlaps that have led to boundary disputes over land demarcation and ownership involving farmers, indigenous peoples and other traditional communities were resolved according to the following criteria:
-
(1) Where properties overlapped, those with the smallest area always remained intact.
-
(2) No distinction was made between temporary and permanent CAR registrations.
-
(3) Only properties classified as rural were used.
-
(4) All overlaps with indigenous lands and protected areas were excluded, except those protected areas where land-use activities such as agricultural and livestock use were permitted according to local management guidelines.
-
(5) Cancelled CAR registrations were removed.
The considered CAR area was smaller than the supposed entire CAR area because all suspect and irregular registrations were eliminated from the analysis.
Forest and deforestation datasets
PRODES data for forest-cover loss were chosen because PRODES is a national programme that continuously monitors deforestation in the BLA. Forest cover loss information in the CAR was analysed at 2-year intervals from 2000 to 2020 (Appendix S2).
We also decided to use MapBiomas (Appendix S2) to account for the area of preserved forest (data collection 3.1 for 2000–2018, data collection 5 for 2019 and data collection 6 for 2020). Only the natural forest formation class defined at level 2 in MapBiomas (2020) was considered for analysis. MapBiomas uses a unique unclouded image for each year’s land-cover mapping, resulting from unclouded pixels of all available images in the chosen period. MapBiomas therefore offered a forest map with a larger clean forest study area than the equivalent PRODES data. Forest changes in MapBiomas associated with each landowner were compared to the results obtained based on PRODES data.
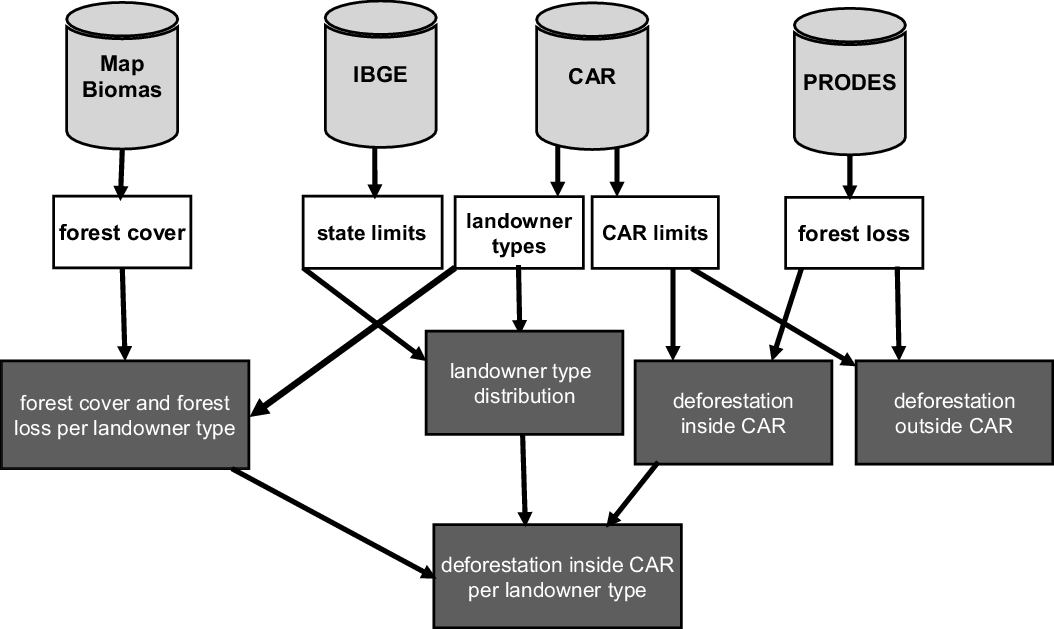
The datasets and the overall methodology, including the intermediate layers up to the final products, are presented in Fig. 2.
Data sources and general methodology. The light grey barrel-shaped forms represent the database sources. The white boxes represent intermediary products and processes. The dark grey boxes represent the final results for analysis. CAR = Rural Environmental Registry.

Classification of landowner types based on property size
The size (hectares) of each property registered in the CAR was calculated to help define the classes of landowners in the BLA, but there are different criteria for size categories (Chomitz & Thomas Reference Chomitz and Thomas2001, Pacheco Reference Pacheco2009, Landau et al. Reference Landau, da Cruz, Hirsch, Pimenta and Guimarães2012, Godar et al. Reference Godar, Gardner, Tizado and Pacheco2014). The BFC itself classifies rural properties based on the fiscal module (FM), a non-standardized land measurement unit implemented by Federal Law 8,629/1993. After establishing an arbitrary size of 100 ha corresponding to 1 FM for the whole area, following Pacheco (Reference Pacheco2012), landowners were grouped into five classes: (1) ‘very small landowners’ – rural properties smaller than 1 FM (up to 100 ha); (2) ‘small landowners’ – rural properties of 1–4 FMs (101–400 ha); (3) ‘medium landowners’ – rural properties of 4–15 FMs (401–1500 ha); (4) ‘large landowners’ – rural properties of 15–25 FMs (1501–2500 ha); and (5) ‘very large landowners’ – rural properties greater than 25 FMs (>2500 ha).
The distribution of landowner type was analysed in terms of the number of properties and percentage of area occupied in the whole CAR and the BLA area.
Deforestation accountability and trends
Annual forest-loss data were extracted from PRODES, at 2-year intervals from 2000 to 2020, and sorted into two different study areas (BLA/inside the CAR and BLA/outside the CAR) and the five landowner classes. Annual and cumulative changes for the five classes of landowners between all time intervals were quantified, as well as the corresponding net change rates (increases or decreases in spatial deforestation patterns), calculated using the Puyravaud (Reference Puyravaud2003) formula:
 $$r = \left( {{1 \over {\left( {{t_2} - {t_1}} \right)}} \times \ln \left( {{{{A_2}} \over {{A_1}}}} \right)} \right),$$
where A 1 and A 2 are the forest loss in the same region at two different times t 1 and t 2.
In addition, annual forest data extracted from the MapBiomas data at 2-year intervals from 2000 to 2020 were used to analyse the forest profile of each landowner type in the BLA. The net change rates were calculated using the same formula from Puyravaud (Reference Puyravaud2003) applied to the PRODES data. Both types of data were used to calculate the deforestation trajectory, corresponding to the accumulated deforestation (forest loss) in a given area over a given period (Brondizio & Moran Reference Brondizio and Moran2012). Using different datasets to study landowner behaviour made it possible to evaluate similarities and differences in the country between these datasets.
Results
Landowner type distribution
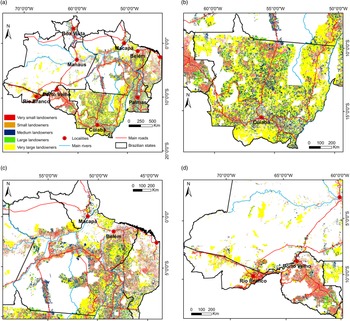
Very large landowners (>2500 ha) were predominant in the territory, occupying c. 17.5% of the total BLA area, followed by medium landowners (7.7%), small landowners (5.0%), large landowners (3.9%) and very small landowners (3.6%; Fig. 3 & Table S1). The remaining area was composed of different types of protected areas, including indigenous land. Considering only the CAR-registered area, very large landowners dominated the territory at 46.3%, followed by medium landowners (20.5%), small landowners (13.3%), large landowners (10.3%) and very small landowners (9.5%; Fig. S1 & Table S1).
(a) Landowner dominance in the Brazilian Legal Amazon (BLA) in 2018. (b–d) Enlargements of the distributions of landowners in (b) Mato Grosso, (c) Pará, Amapá and Maranhão and (d) Rondônia, Acre and part of Amazonas states. For a full-colour version of this figure, please see the online version of this paper.

Although very large landowners occupied most of the private land registered in the CAR, their properties made up just 1.7% of the total by number. In contrast, very small landowners, who only occupied a small proportion of all private land, accounted for 68.3% of the total number of properties, followed by small landowners (21.0%), medium landowners (7.5%) and large landowners (1.5%). There was thus great inequality in landownership in the region: the most numerous group (68.3% of properties) owned the smallest area, and the smallest group, which corresponded to less than 2% of the total number of landowners, held the largest area (c. 46.3% of the total; Fig. S1).
Very small landowners numerically outnumbered large and very large landowners in all of the states. Acre and Rondônia had the greatest numbers of very small landowners, accounting for over 80% of the total numbers of properties (which were 21.8% and 29.7% of the CAR-registered area in these states, respectively), and the lowest numbers of large and very large landowners, with values of 0.3% and 0.7%, and 0.4% and 0.2%, respectively (which correspond to 4.2% and 51.5%, and 8.3% and 19.0% of the CAR-registered area for Acre and Rondônia, respectively; Fig. S2 & Table S2).
Deforestation inside and outside the CAR-registered area
The PRODES dataset showed that for the 2000–2020 period annual forest loss showed the same trend inside and outside the CAR-registered area: forest area decreased from 6 566 334.4 to 995 276.7 ha (from 3.43% to 0.52%) and from 1 969 242.9 to 509 857.0 ha (from 1.03% to 0.27%) inside and outside the CAR-registered area, respectively (Fig. S3 & Table S3).
Forest-cover dynamics per landowner type
In 2000, c. 16.6% of the forests found in the BLA were located on private land, a value that fell to 9.4% in 2018 (Table S4). In 2019, forests covered an area of c. 12.8%, suggesting a possible recovery in relation to 2018 (Table S4), yet the MapBiomas data show that the change in the governance profile at the end of 2018 led to greater forest loss in that year than in 2019 (forest area increased in relation to 2018), in contrast to the PRODES data. In 2020, forests covered an area of c. 12.2% (Table S4), a small decrease in relation to 2019 but greater than in 2018, suggesting that the greater forest loss observed in 2018 might be a misclassification of the satellite images.
Assuming that the CAR boundaries were stable across the period, these numbers show the magnitude of deforestation in private areas: a reduction of almost 27% in forest cover on private lands between 2000 and 2020. Forest area inside the CAR-registered area decreased (from 84 414 439.2 ha in 2000 to 61 977 369.0 ha in 2020), with an annual net change rate of –1.5% (2000–2020; Tables S4 & S5c).
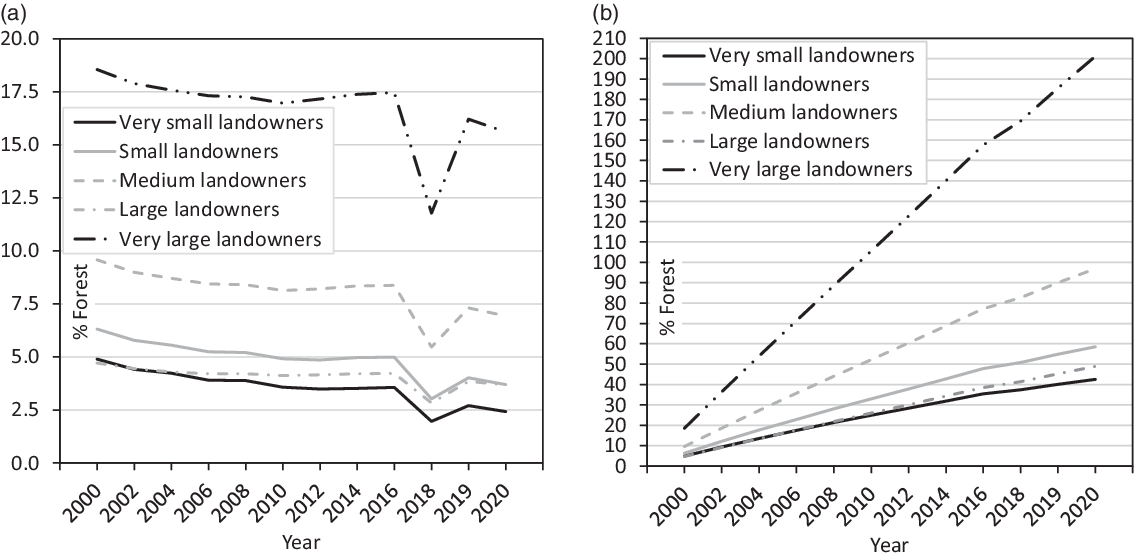
Forest dynamics on each type of property behaved similarly in every period, with forest cover decreasing until 2012, rising slightly in 2012–2016, falling significantly in 2016–2018 and increasing again in 2019, with a small decrease in 2020 (Fig. 4a & Table S5a–c). The greatest cumulative forest loss was observed among very large landowners, while the lowest values were observed among very small landowner and large landowner properties (Fig. 4b & Table S5a–c).
(a) Annual and (b) cumulative forest area in 2000–2020 inside the Rural Environmental Registry (CAR) area and per landowner type in the Brazilian Legal Amazon (MapBiomas data).

All the landowning classes had less forest area at the end of the period (2020) than at the beginning (2000; Table S5a–c). The highest rate of forest decline was observed among very small landowners (from 9 383 074.4 to 4 637 901.8 ha), corresponding to an annual net change rate of –3.7%, and the lowest rate was observed among very large landowners (from 35 555 416.0 to 29 917 226.2 ha), for whom the annual net change rate was –0.9% (Table S5a–c).
Deforestation analysis per landowner type using the PRODES and MapBiomas datasets
Both the PRODES and MapBiomas datasets showed a decrease in forest area inside the CAR-registered area in the BLA from 2000 to 2020. This decrease was greater in the PRODES dataset, with an annual net change rate of –9.4% (Table S3), than in the MapBiomas dataset, where the rate was –1.5% (Table S5c).
The same degree of forest decline per landowner was observed in all of the intermediate periods, with annual net change rates in 2000–2020 varying between –12.5% and –9.9% for the PRODES dataset (Table S6a–c) and between –3.7% and –0.9% for the MapBiomas dataset (Table S5a–c). Although both datasets use Landsat images, the observed differences can be linked to the methodologies they employ.
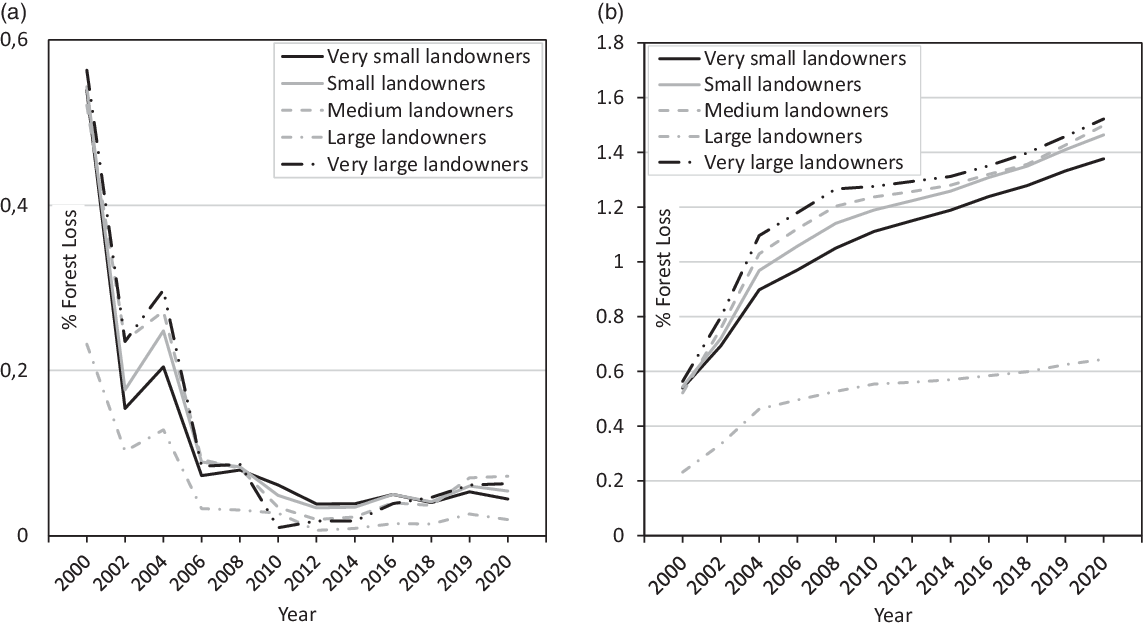
Using the PRODES data, all types of landowners displayed the same forest-loss trend for the period: an accentuated decrease until 2010, followed by small oscillations between 2010 and 2014 and a progressive increase from 2014 to 2020 (Fig. 5a & Table S6a–c). During 2018–2019, there was a dramatic increase in forest loss for all types of landowners. In 2019–2020, forest loss values increased slightly for small and medium landowners, while the other classes experienced small decreases in forest loss (Table S6a–c).
(a) Annual and (b) cumulative forest loss in 2000–2020 inside the Rural Environmental Registry (CAR) area and per landowner type in the Brazilian Legal Amazon (PRODES data).

The PRODES data revealed cumulative forest-loss increases in all periods and for all landowners (Fig. 5b & Table S6a–c) similar to the MapBiomas data (Fig. 4b & Table S5a–c). This means that forest loss increased overall, despite several decreases during the period. Considering the period from 2000 to 2020, very small landowners and large landowners experienced the greatest forest loss (from 1 033 038.2 to 85 105.9 ha, with an annual net change rate of –12.5%, and from 444 253.4 to 37 358.2 ha, with an annual net change rate of –12.4%, respectively), while medium landowners presented the smallest loss (from 998 771.8 to 137 979.3 ha, with an annual net change rate of –9.9%). The PRODES data showed greater forest loss values than the MapBiomas data. In the MapBiomas data, for example, ranking landowner types according to the net change rate in 2000–2020 (Table S5a–c) required an analysis of the amount of area involved in each net change rate; very small landowners had the highest annual net change rates (–3.7%) and were responsible for a total forest loss of 4 745 172.6 ha, whereas very large landowners had the lowest annual net change rates (–0.9%) and were responsible for a total forest loss of 5 635 189.5 ha. These numbers show that, in 2020, very large landowners were responsible for forest loss equal to more than 118% of that of very small landowners.
Discussion
Our analysis showed an unequal distribution of land in the BLA, with the very large landowners occupying the largest area of the territory and the very small landowners occupying the smallest area, although the former had fewer properties than the latter. This inequality is observed worldwide (Bui & Preechametta Reference Bui and Preechametta2016, Flower Reference Flower2018, Abubakar Reference Abubakar2021), but the level of inequality differs among countries (Adamopoulos Reference Adamopoulos2008). In the case of Brazil, this inequality was reported by Pacheco (Reference Pacheco2009), who stated that 83% of the small landowners held less than 100 ha and controlled just 11.3% of all agricultural land. Half a century ago, Dean (Reference Dean1971) addressed the highly skewed land distribution in Brazil, referring to an elite who were both the owners and responsible for the intense exploitation of agricultural commodities, a point later reinforced by Wilkinson et al. (Reference Wilkinson, Reydon and Sabbato2012).
The landowner dominance in the BLA (Figs 3 & S1 & Table S1) remains in place today at great social and environmental cost; indigenous peoples have been displaced from their traditional lands, and monoculture and cattle ranching have accelerated tropical deforestation (Robles Reference Robles2018).
During the pre-CAR implementation period, between 2006 and 2008, there was an increase in deforestation rates inside the CAR-registered area, which seemed to have been related to landowners’ accelerating the rate of deforestation because they were afraid of the consequences of the CAR or of the implementation of changes in the BFC (Table S3). Forest loss was greater inside than outside CAR-registered areas, and cumulative forest loss was consequently also greater (inside 3.43–10.21%, outside 1.03–3.70%; (Fig. S3 & Table S3), corroborating the role of private landowners in deforestation. Outside the CAR-registered area, most of the area is composed of protected areas that are already subject to several anti-deforestation measures that have helped reduce forest loss in spite of the existent human pressures (Cabral et al. Reference Cabral, Saito, Pereira and Laques2018).
The results showing a progressive reduction of deforestation from 2000 until 2012, mainly from 2004 to 2010 (Table S6a–c), can be explained by a combination of the expansion of protected areas and indigenous land networking, the implementation of a robust forest monitoring system, the moratoria on soy in 2006 and beef in 2009 and the implementation of a blacklist identifying municipalities with high levels of illegal deforestation (Nepstad et al. Reference Nepstad, McGrath, Stickler, Alencar, Azevedo and Swete2014, Soares-Filho & Rajão Reference Soares-Filho and Rajão2018). Our results are similar to what was reported by the INPE (2020) regarding the BLA: deforestation rates varied greatly over time, with peaks in 1988 (21 050 km2/year), 1995 (29 059 km2/year) and 2004 (27 772 km2/year), and there was a progressive reduction to a historical low of 4571 km2/year in 2012 (INPE 2020). In 2013, this downward trend was reversed, reaching the highest values in the last 10 years in 2019 (10 129 km2/year) and 2020 (11 088 km2/year; INPE 2020). The change in trend from 2013 is related to a series of controversial environmental setbacks in the Brazilian Forest Code in 2012 (Silva et al. Reference Silva, Santilli, Sano and Laneve2021).
The increase in deforestation after the introduction of the BFC in 2012 could also represent a delusion of control, in the sense that legalizing deforestation would reduce illegal deforestation, although the amount of legal deforestation (permitted by law but not undertaken until that moment) rose due to the ‘softening’ of the rules (Daugeard & Tourneau Reference Daugeard and Tourneau2018). The idea of legal deforestation is an outcome that is similar to that which occurred in Mato Grosso State some years before with the implementation of the System for Environmental Licensing of Rural Properties (SLAPR). By using remote sensing and geographical information systems (GIS) technology, it was argued that a licensing system could help identify each farm with its respective demarcation of the Legal Reserve and APP and thus monitor deforestation by classifying activities as legal or illegal. Legal deforestation would include all of those forests cut for economic purposes up to the limit of minimum preservation requirements (Legal Reserve and APP), as authorized by the government. The delusion of control mentioned above derives from the fact that what became emphasized was illegal deforestation, while ’legal’ deforestation was encouraged without exposing such data to the public. These separate ideas of illegal and legal deforestation were a smokescreen against drawing attention to the real increase in total deforestation of c. 32% of the total forest area lost in the 2000–2007 period in Mato Grosso State (Saito & Azevedo Reference Saito and Azevedo2017). On properties larger than 200 ha, 71% of the deforestation carried out that was detected was authorized by the Mato Grosso State Secretariat for the Environment (Sema-MT; Azevedo & Saito Reference Azevedo and Saito2013). In the new BFC (Law n. 12651/2012), 22 July 2008 was established as the reference date from which owners could ‘benefit’ from the easing of the rules. This relaxation of rules for consolidating rural areas is in Article 67 of the BFC for rural properties that on that reference date held an area of up to 4 FMs (very small and small landowners according to our classification) and remnants of native vegetation at percentages lower than that provided for in BFC Article 12. The Legal Reserve would constitute the area occupied by existing native vegetation on 22 July 2008 (and the environmental debt due to past deforestation would be forgiven). This date was taken as a reference because Decree n. 6.514 entered into force to determine administrative punishments for those who did not follow the environmental laws regarding forest conservation. Additionally, Article 61-A in practice reduced the obligation to recover native vegetation in APPs (which includes riparian zones, springs and hilltops; Biggs et al. Reference Biggs, Santiago, Sills and Caviglia-Harris2019) from the original 50 m to 5 m (riparian areas) for very small landowners and to 8, 15 and 30 m progressively according to increasing sizes of properties; this was another type of relaxation of the rules.
In sum, the combination of the relaxation of the rules by the new BFC and the smokescreen produced by the idea of legal deforestation (Saito & Azevedo Reference Saito and Azevedo2017) can help to explain the increase in deforestation after 2012. Nevertheless, it is necessary to see the bigger picture in terms of the role of different landowner types in this deforestation process.
The upward trend in deforestation accelerated due to pressure from rural lobbies to revise the BFC code in 2012, which contributed to a relaxation of the legislation on private land and the introduction of an amnesty for landowners who had previously engaged in illegal deforestation. The effect of this pressure can be seen in the fact that the deforestation rate was greater among the very small landowners (Table S5) after 2012. The delimitation of the APPs is independent of rural property boundaries; it is based on the width of the watercourse, but the relaxation of the rules caused the delimitation of the APPs to be returned to being based on the size of the rural properties. The increase in deforestation rates during the pre-CAR implementation period between 2006 and 2008 represents a collective strategy of this sector to guarantee the maximum amount of deforestation and thus consolidate areas until the reference date of 22 July 2008, when all of the environmental debts would be forgiven by law. The election of important agribusiness representatives to the Senate in 2010 to prepare this new BFC of 2012, with its relaxation of the rules, corroborates the role of ‘organic intellectuals’ (people dedicated to the maintenance of the hegemony of agribusiness) in this historical process (Saito & Azevedo Reference Saito and Azevedo2017).
While the CAR has certainly compelled landowners to comply with legislation, the deforestation process has continued. Nevertheless, if we consider the period after 2012, the net forest loss change rate has almost always been positive (i.e., deforestation is ongoing), with a major increase from 2018 to 2019 that is probably associated with a change in the governance profile and the weakening surveillance of law enforcement. In 2019–2020, deforestation fell slightly inside and outside the CAR-registered areas, but the values were not significant enough to define them as reversals of the trend (Fig. S3 & Table S3).
The largest portion of forest was owned by very large landowners, while the smallest forest areas were owned by large landowners and very small landowners (Fig. 4a & Table S5a–c). This corroborates Roe et al. (Reference Roe, Rausch, Munger and Gibbs2016), who found that in Pará State larger properties covered the largest registered forestland area. Given that small landowners have access to less land, they tend to deforest a larger proportion of their area for agricultural and grazing uses, whereas the other landowners with access to more land tend to keep a larger proportion of it as forest for future opportunities (Pacheco Reference Pacheco2012).
The very small landowners showed the highest rate of forest decline, suggesting that it is important to go beyond the dichotomies between environmental programmes and social programmes to simultaneously achieve both ecosystem protection and poverty alleviation (Pinho et al. Reference Pinho, Patenaude, Ometto, Meir, Toledo, Coelho and Young2014). This would demand an integrative approach, avoiding conflicts among the Sustainable Development Goal (SDG) targets (leading to mutual cancelation), as observed by Laques et al. (Reference Laques, Cabral, da Silva, Saito, Nhamo, Chikodzi and Dube2021) for the Bolsa Floresta Program, and considering the real effectiveness of this approach for reducing deforestation based both on environmental and productive cycles (Pereira et al. Reference Pereira, Camargo, Silva, da Silva, Saito, Cabral and Laques2021). This means that the time for recovering soil fertility and the time for manioc crop development and income generation should be synchronized and coordinated.
Analysing data based only on net change rates does not make it possible to characterize more or less forest-conserving groups, but both the MapBiomas and PRODES results offer a picture of this situation. To obtain a complete picture, rates would need to be interpreted considering the asymmetries in landownership and distribution. According to Openshaw (Reference Openshaw1981), if data do not support an ideological bias, then they should be analysed through considering a size effect, and it is thus necessary to remove the ‘noise’ caused by the size of the spatial units.
Landowners are characterized by different motivations and engage in different types of activity. Small landowners mainly participate in subsistence agriculture that is often dependent on cash crops (e.g., manioc and banana) and is practiced on small plots through intensive labour. This plays an important role in a family’s subsistence and in the local food supply through the sale of surplus produce at local markets, thereby helping to alleviate rural poverty (Pokorny et al. Reference Pokorny, de Jong, Godar, Pacheco and Johnson2013). In contrast, medium, large and very large landowners are often associated with extensive production systems and agribusiness, occupying large tracts of land where they mainly engage in cattle-ranching operations and in the intensive production of agricultural commodities. The expansion of these activities is economically dependent on the growing demand from domestic and global markets and on policy incentives (Pacheco Reference Pacheco2012). The possibility of associating these activities with an environmentally friendly market supported by increasing global awareness regarding the importance of forest conservation can help to control the deforestation caused by these types of landowners. The role of landowners in deforestation patterns reinforces the necessity of changing the fact that the majority of the policy instruments in the Amazon have focused on traditional/indigenous people, with far less attention being devoted to colonists and agriculturalists (Pinho et al. Reference Pinho, Patenaude, Ometto, Meir, Toledo, Coelho and Young2014).
According to Assunção and Rocha (Reference Assunção and Rocha2016), innovative tools are necessary for forest conservation to support the livelihoods of small landowners and the economic choices of large and medium landowners. However, for such tools to be implemented, strong enforcement of environmental laws and different types of incentives that promote the sustainability of land-use practices are needed that do not curtail the local economy while simultaneously encouraging forest preservation.
To obtain a clearer picture of who is truly responsible for the most deforestation, the annual net change values must be interpreted in the light of the framework of asymmetric landownership and distribution. In terms of the area of forest loss, most of the time the very large landowners’ properties represent the greatest level of deforestation, but this has not been adequately reflected in the annual net change rates.
Conclusions
Deforestation rates in the BLA have both increased and decreased over time due largely to the influence of the various existing landowner types. The overall historical trends show that different landowner types have made distinct contributions to the total amount of deforestation, so property size as the main criterion and proxy of landowner type was the correct choice for this study, being capable of distinguishing the different landowner types, the different logics underlying their land-use exploitation and their behaviours. The size effect should be considered because although very large landowners may appear to have implemented a lower deforestation rate on their lands than the other landowner types, these landowners have been responsible for many environmental impacts because of the magnitude of their interventions. Additionally, these patterns and processes are strongly connected to socioeconomic conflicts.
The CAR data confirmed the concentration of large and very large landowners, and comparing this database with forest losses showed that these large and very large landowners maintained and expanded forest loss, reinforcing social inequalities through the expulsion of smallholders due to land concentration.
We can nonetheless see that landowners are capable of increasing deforestation in response to legal and policy changes or in anticipation and fear of expected changes. Government profiles and the political environment have rapid or even immediate impacts on the deforestation process, and the data may reflect the very recent political changes in Brazil (2018–2020).
Finally, considering this overall context of different landowner types and their responses to policies, it was necessary to address asymmetries in land ownership and distribution and investigate what policy instruments might be more effective for which type of landowner within a global sustainability framework. The Amazon region plays a very special role in regional and global ecosystem services, inspiring the development of policies and instruments for forest resource conservation within both the present context of climate change and the search for a transition to a low-carbon society that can achieve the goals of the 2030 Agenda for Sustainable Development.
Supplementary material
To view supplementary material for this article, please visit https://doi.org/10.1017/S0376892922000297.
Acknowledgements
None.
Financial support
This work was supported by the INCT/Odisseia project (MCTI/CNPq/CAPES/FAPs n.16/2014) and CEF, a research unit funded by Fundação para a Ciência e a Tecnologia I.P. (FCT), Portugal (UIDB/00239/2020). This study received funding from the European Union’s Horizon 2020 Research and Innovation programme under Marie Skłodowska-Curie grant agreement No. 691053 (H2020-MSCA-RISE-2015 ODYSSEA project), from the Conselho Nacional de Desenvolvimento Científico e Tecnológico (CNPq) under grants 465483/2014-3 and 301537/2018-6, and from CAPES (Coordenação de Aperfeiçoamento de Pessoal de Nível Superior) and FAP-DF (Fundação de Apoio à Pesquisa do Distrito Federal) under grants 23038.000776/2017-54 and 193.001.264/2017, respectively.
Competing interests
The authors declare none.
Ethical standards
None.