A major obstacle to progress in paediatric heart surgery is the limited experience of any individual surgeon with any one particular lesion. In 1984, Drs. John Kirklin and Eugene Blackstone proposed that the Congenital Heart Surgeons’ Society surgeons pool their experience. The seminal study involved enrolling newborns less than 2 weeks of age with complete transposition of the great arteries. This “diagnostic inception cohort” was designed to answer the question of whether the emerging, then high-risk, arterial switch operation was a suitable surgical strategy to replace the established, low-risk, atrial switch operation. Within 4 years, 985 newborns (equivalent to over 30 years experience at any large single institution) had been enrolled and entered into a database in Birmingham, Alabama (the Data Center). This seminal Data Center cohort demonstrated the surgical learning curve and clarified long-term outcomes following atrial and arterial repairs.Reference Castaneda, Trusler, Paul, Blackstone and Kirklin1–Reference Culbert, Ashburn and Cullen-Dean7 The Data Center has subsequently studied 8 rare congenital cardiac diseases and 1 procedure with datasets totalling over 4,700 infants.
Research databases should not be confused with the growing number of registries,Reference Williams and McCrindle8–Reference Mavroudis, Gevitz, Elliott, Jacobs and Gold10 which are distinct entities with different objectives. Central to the Data Center are several key features. First, all are inception cohorts based upon diagnosis or specific procedure, independent of subsequent intervention or outcome. Consequently, the full spectrum of diagnostic lesions and management protocols is incorporated. Second, children undergo annual cross-sectional follow-up, so the database is constantly updated with each child’s progress. This contrasts with the acquisition of data only at specific “events” (death or intervention, for example) and not during the intervening period.Reference Jacobs, Jacobs and Maruszewski9, Reference Maruszewski and Tobota11 Third, all data are temporally linked to the individual child, allowing for longitudinal analysis of outcomes with repeated measures. Fourth, data entry is performed at the Data Center using documents submitted by the participating institution. This ensures uniform definition and adjudication of data entry. Fifth, data entry undergoes systematic quality control to maximise both completeness and accuracy, which is proving difficult and laborious in large registries.Reference Maruszewski, Lacour-Gayet, Monro, Keogh, Tobota and Kansy12 Lastly, numerous patient-specific baseline characteristics are extracted, allowing for sensitive data-driven risk-adjustment (as opposed to by consensus or categorical risk-stratificationReference Lacour-Gayet13, 14). We describe the mechanics of the Data Center and outline several aspects of the analytic process that characterise our work. We provide analytical examples that illustrate the value of research databases in an era biased towards randomised, hypothesis-based clinical trials.
A. Operations of the Data Center
Inception and participation
New project proposals by Congenital Heart Surgeons’ Society members are critically appraised before design of approved proposals is finalised. New proposals have historically not required securing external funding sources, although there is now increasing pressure to obtain external funding. Inclusion criteria are intentionally broad in order to simplify enrolment and provide an all-inclusive morphologic spectrum.
All Congenital Heart Surgeons’ Society members are informed of study cohorts and invited to participate. Presently, participation is entirely voluntary and non-remunerated. Some institutions have specific research interests and will therefore invest more energy into one cohort than another. Alternatively, institutions may already be committed to collaborative investigations with alternative initiatives (for example the Pediatric Heart NetworkReference Sleeper, Anderson and Hsu15) and therefore defer involvement with a particular Congenital Heart Surgeons’ Society study. A drawback of voluntary multi-institutional participation is the potential for selection bias. It is difficult to verify that all known eligible patients within each participating centre have been approached. We are therefore currently auditing enrolment within centres in order to improve completeness of representation of patients.
Data extraction and quality control
For each enrolee, a log is created to document the dates of all procedures, investigations and consultations. The Data Center requests copies of reports from all these “episodes”. Once reports are received, data are extracted using a standardised uniform protocol for each study and entered into hierarchical electronic data forms (Microsoft Access) stored on a central, secure Data Center server. The work-load has been exacerbated by the large increase in variable fields in recent years. For example, cardiac imaging data fields have increased from 16 for the transposition of the great arteries cohort (1985) to 126 for the latest left ventricular outflow tract obstruction cohort (presently open to enrolment). Quality-control mechanisms ensure that “missing” clinical reports are periodically re-requested.
Centralisation of data has proved one of the most important tools assisting quality control. Storing submitted medical records on-site enables us to refer back to original operation notes, echocardiography reports and clinic letters at any point. A recent attempt to delegate data entry to local institutions (via online data entry forms) compromised accuracy and completeness of data accrual and was therefore abandoned. As an example, a minority of institutional ethics boards insist on de-identified data, which mandates local institutional follow-up. Completeness of follow-up is less than 10% when delegated to local institutions, in contrast with more than 80% when undertaken by the Data Center.
The importance of quality control cannot be over-estimated. Misreporting of early mortality in the European Association of Cardiothoracic Surgery Congenital database is estimated to be as high as 10%.Reference Maruszewski, Lacour-Gayet, Monro, Keogh, Tobota and Kansy12 We recently explored the impact of error rates on calculating survival outcomes by intentionally inducing errors in recoding of events at fixed rates. Error rates as low as 5% significantly affect analysis of outcomes, especially for low-mortality procedures.
Follow-up
Annual cross-sectional follow-up is undertaken centrally by Data Center staff. Families are contacted by mail and subsequently by telephone if necessary. The general status and progress of the child is documented and their log of clinical episodes is updated with all consultations, investigations, admissions and procedures undertaken in the intervening year. The goal is a complete longitudinal patient record to provide the substrate for repeated-measures and time-related outcomes analytical methods.
We have several mechanisms to minimise loss of patients to follow-up. Contact details of a close friend or relative are obtained to provide a link to re-establish contact if lost through re-location. Attempts are otherwise made via the local institution, and rarely the Social Security number may be used to confirm a child’s death via national death registries.
B. Analytical strategies
1. Principles of analysing time-related outcomes
Three principles underpin the analysis of time-related events: 1) starting with a time-point where all subjects are “at risk”, 2) ending with a time-point where no subjects are at “risk” and 3) defining an “event” precisely. For survival analyses, death is obviously both a precise event and a time-point at which no subject remains at risk. However, for other outcomes, defining these time-points may be less clear. For example, a child cannot be considered at risk of requiring repair of tetralogy of Fallot until they have received a diagnosis of tetralogy of Fallot. Therefore in this circumstance, “date of diagnosis” is an appropriate time zero, but “date of birth” is not. Similarly, a child is at risk of surgical death after the date of operation but not before.
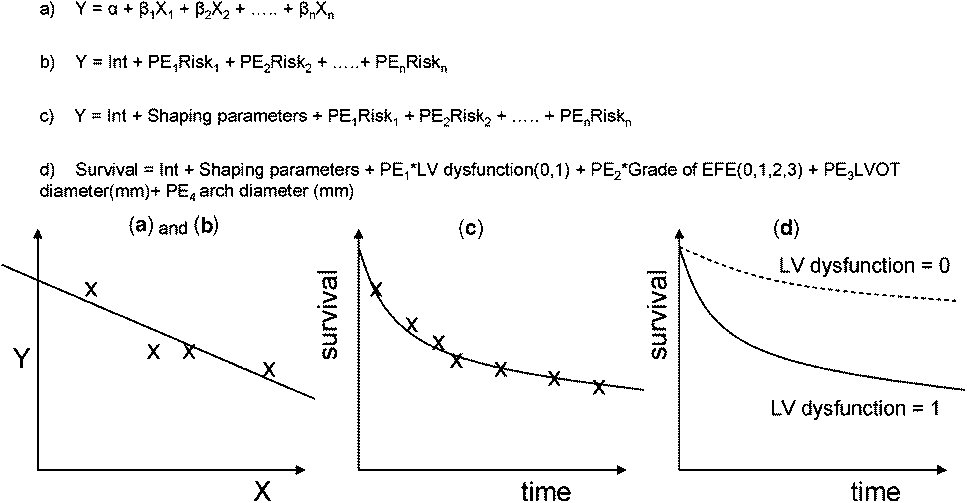
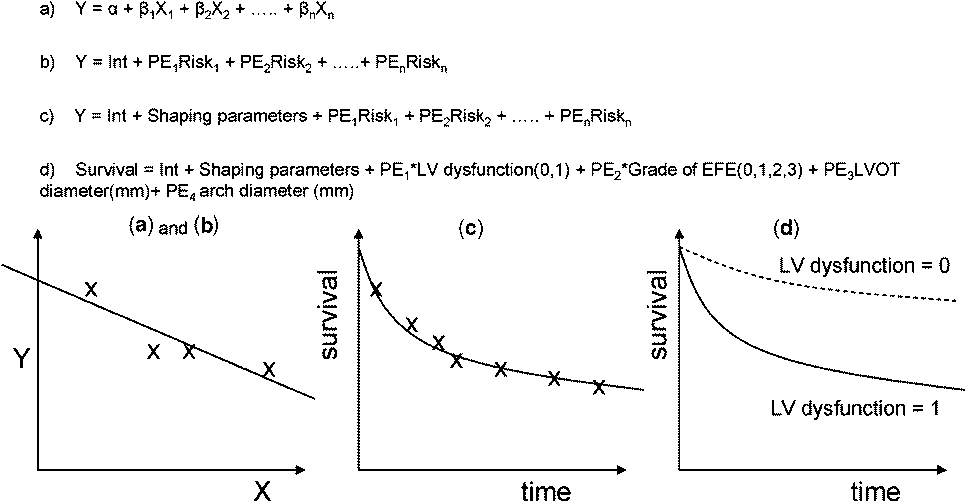
Creating parametric regression models. We employ parametric methodology for risk-hazard analyses of time-related events.Reference Blackstone16, Reference Blackstone, Naftel and Turner17 “Parametric” means that the model of time-related outcome is in the form of a mathematical equation. Numerical constants (parameters) estimate underlying instantaneous risk of death (hazard function) and weigh the contribution of statistically significant risk factors (covariables) by “parameter estimates” (Fig. 1). Inclusion of covariables in the parametric equation means that the effect of varying one risk factor can be examined while holding values for the remaining covariables constant (stratification). Alternatively, hypothetical covariate values can be inserted into the model to generate outcome predictions or simulations. These two properties – stratification and prediction/simulation – are key advantages to the use of parametric techniques over non-parametric (Kaplan-Meier) or semi-parametric ones (Cox’s proportional hazards) – for a historical perspective, see Appendix.
A simple linear regression equation (model) involves solving an equation to generate a line that “best fits” the data (a). This equation involves an intercept (α), and the slope is represented by one or more covariables (X), each with its own parameter estimate (β). In a multivariable risk-hazard analysis, each covariate (X) represents a risk factor being tested (b). If the risk factor is not significant, then the parameter estimate is zero. If the risk factor is significant, then the parameter is a number greater than or less than zero – and the polarity dictates whether the risk factor is protective or hazardous. Parametric analyses of time-related outcomes involve modelling the distribution of survival intervals within the sample population. In multi-phase techniques, computer-generated algebraic shaping parameters independently model the distribution of survival intervals in more than one phase (c). The survival curve generated by the parametric model may be super-imposed on Kaplan–Meier estimates to demonstrate the model “goodness-of-fit”. Once the equation (model) is solved, stratified curves can be created by altering particular covariate values, with the remainder set at their mean (d). Alternatively, a set of hypothetical data can be entered for the covariables to generate predictions. Multi-phase parametric survival curves incorporate several sets of shaping parameters, each representing a distinct hazard phase (and each phase will have distinct covariables with their parameter estimates).
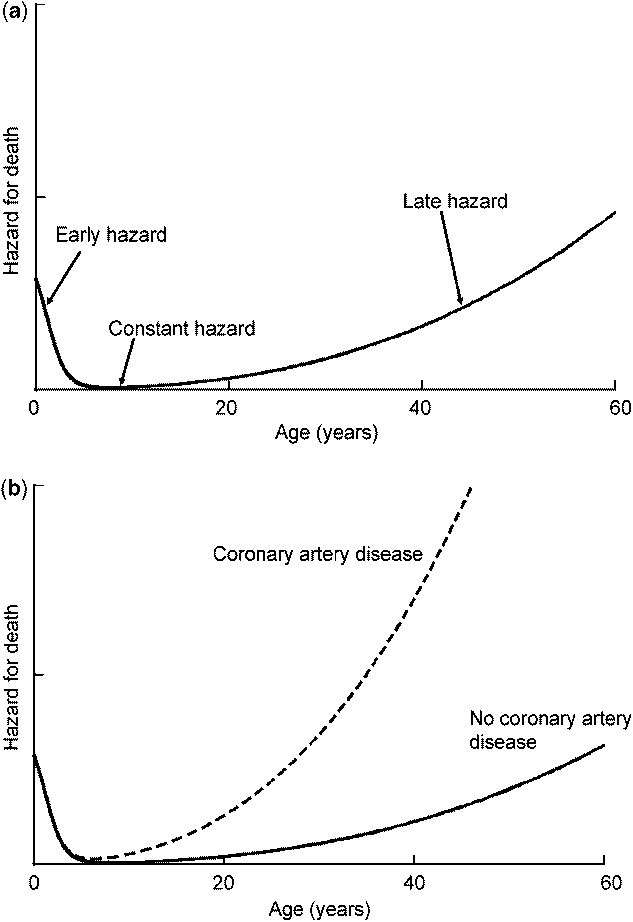
A third advantage of parametric methodology is the decomposition of the time-related risk into “hazard phases”.Reference Blackstone, Naftel and Turner17 The “hazard” is the instantaneous risk of an event occurring, which typically varies with time. Consider the hazard for “death” (Fig. 2a). Following birth, there is a declining risk of death during infancy (early hazard phase), which then stabilises at a very low level of risk during teenage years and early adult life (constant hazard phase). Gradually the risk of death starts to increase again, especially toward the latter years (late hazard phase). Risk factors for death are clearly different in each of these different hazard phases (the definition of non-proportional hazard).
Multi-phase hazard analysis: schematic representation of the hazard for “death”. Immediately after birth there is reducing hazard for death in the neonatal period and infancy (early hazard phase). Thereafter, there is a low and constant risk of death during adolescence and early adulthood (constant hazard phase). Subsequently, the hazard for death begins to rise progressively with advancing age (late hazard phase). The hazard following surgical intervention frequently mirrors this hazard for death, with a pronounced early hazard phase (early mortality), a subsequent constant hazard phase (slow and constant rate of attrition) followed by an elevated risk of late hazard (related to a need for repeat operation, for example). The advantage of considering outcomes in distinct hazard phases is that risk factors can be sought that influence each distinct phase. For example, coronary artery disease is a risk factor for death in the late phase of “life”, but not a risk for the early and constant phases (Fig. 2b). Other methods of analyzing survival outcomes include non-parametric (simple Kaplan-Meier stratifications of actual survival) and the commonly used Cox’s proportional hazards. Cox’s proportional hazards assumes that the ratio of hazard for any given risk factor is constant over time. The technique therefore cannot distinguish between the influences of various risk factors at different stages in time (non-proportional hazards).
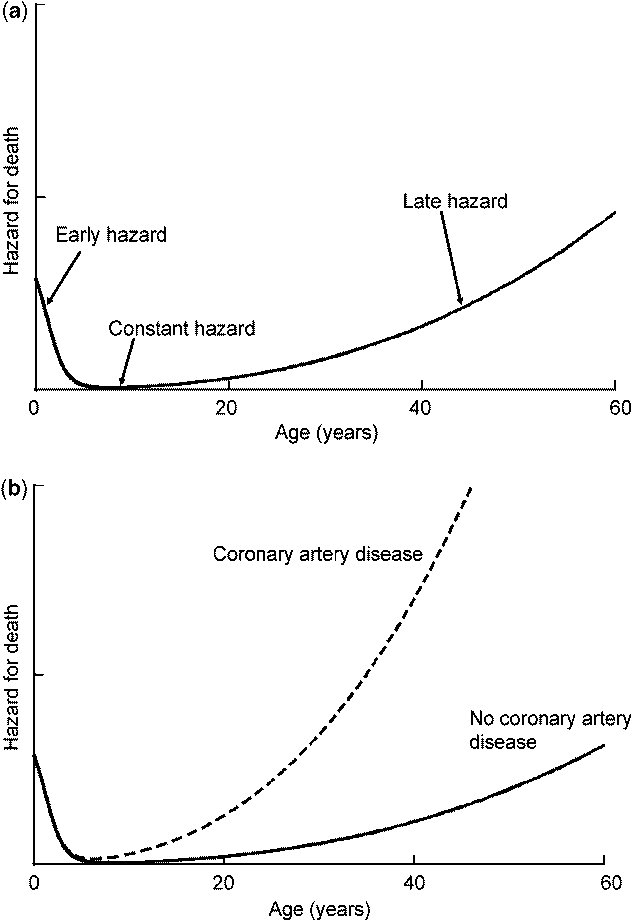
The hazard for an event following surgery (for example, death or re-operation) often mirrors the hazard for death, with distinct early, constant and late phases. Multi-phase parametric techniques involve generating models that incorporate each phase separately. Separate risk factors can then be identified that influence one particular phase or another (Fig. 2b).
2. Statistical process
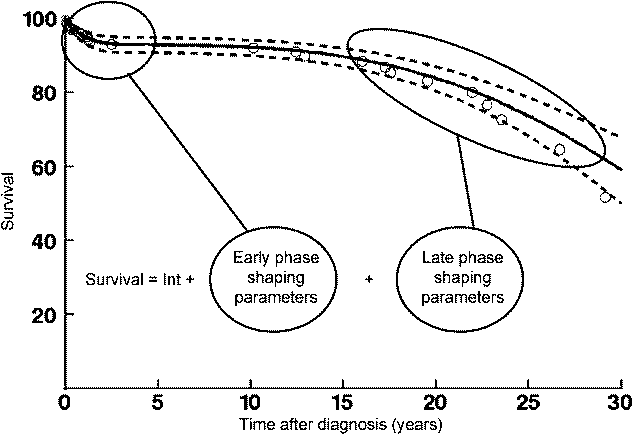
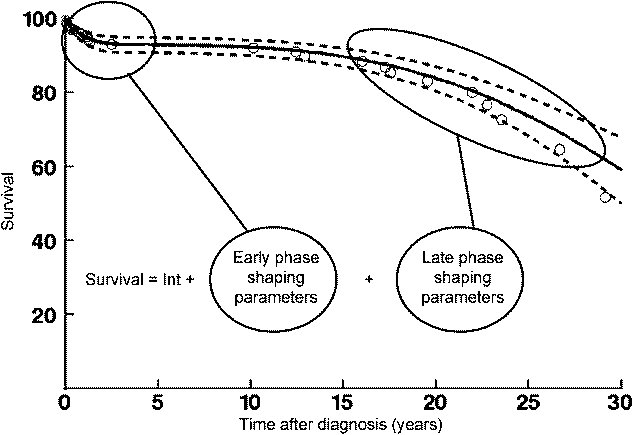
The first step involves generating an “overall model” that represents the characteristics of our data. It is derived using computer programs that estimate “shaping parameters” to “fit” the model as closely as possible to the time-related changes in hazard function of the data. Graphically, however, the model is seen as a curve that overlies the Kaplan-Meier estimates closely (Fig. 3). When the best possible fit to raw data is obtained, the shaping parameters are “fixed” and the model is now subjected to risk-hazard analysis. Modelling the hazard function is the only hurdle to those unfamiliar with parametric techniques. However, this is not a great hurdle, and assistance can be found at www.clevelandclinic.org/heartcenter/hazard.
A parametric survival model (solid line) super-imposed on Kaplan-Meier estimates (circles). The model demonstrates distinct early and late hazard phases. Within hazard phases, the distribution of survival intervals has been modelled using computer-generated shaping parameters derived for that phase (www.clevelandclinic.org/heartcenter/hazard). The parametric survival curve can then be subjected to risk-hazard analysis to identify risk factors that influence one particular phase or another. Dashed lines enclose 70% confidence intervals.
Managing data and transformation of variables for analysis. Risk-hazard analysis involves the identification of demographic, morphologic, functional and procedural variables that exhibit association with one or more of the parametric hazard phases. A sequence of processing steps takes place to prepare variables before multivariable risk-hazard analysis.
For instance, in the case of baseline variables, either the inception imaging study or the last echocardiogram prior to intervention (or both) might be selected. All potential variables are assessed for accuracy (i.e. inappropriate negative values, incorrect decimal places) and missing values. Variables with more than 75% missing values or associated with less than 5 events are excluded from analysis. Biological systems may have different scales to clinical recordings (for example, the pH scale is the logarithmic transformation of [H+]). Therefore, all continuous variables are tested for transformations (logarithmic, inverse, square-root, etc) that improve linear calibration with the logit probability of the event occurring. Sizes of cardiovascular structures are then standardised according to body size or normative data. For dimensions that have published normative data, z-scores are calculated.Reference Daubeney, Blackstone, Weintraub, Slavik, Scanlon and Webber18 Indexing is otherwise performed to body surface area (or height for cardiac lengths). Finally, missing values are imputed with mean values. Rarely, the fact that a recorded variable is missing is itself a predictor for death (for example, the absence of a systolic blood pressure recording in extreme hypotension). Therefore, a missing-value “indicator” is created and subsequently tested as a covariable, to adjust for or exclude any influence of “missing-ness”.
After all potential variables have been processed and checked, they are tested for significance within the overall parametric model. We usually use forward stepwise regression with a retention threshold of p<.1. Colinearity amongst variables can be identified by examining each iteration step and also by testing correlation between variables.
Reliability of analysis: bootstrap bagging
“A statistician is a man who believes figures don’t lie, but admits that under analysis some of them won’t stand up either.”
Evan Esar 1899–1995.
Bootstrap aggregating (“bagging”) is a method for assessing which variables are more likely to “stand up” in clinical practice. Risk-hazard analysis will identify important variables within the “sample” dataset (the Data Center cohort). However, the research aim is typically to identify variables that are important across the wider “population” (all children with the condition being investigated). Although increasing sample size is the most obvious method of improving the reliability of risk-factors within the sample, bagging is a technique that tests the reliability of risk factors within the “sample” cohorts across the wider “population”.Reference Breiman19
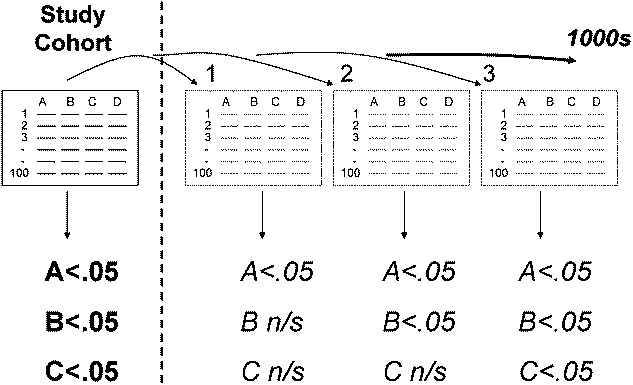
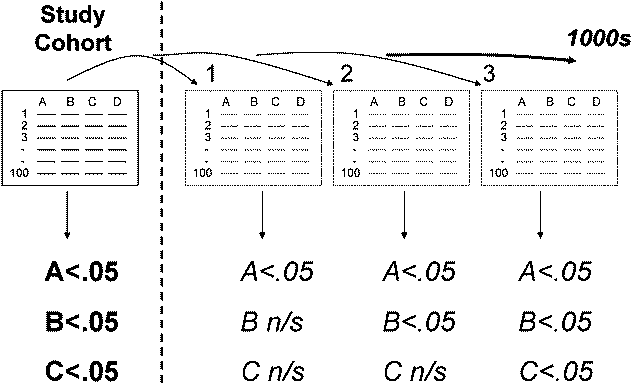
Bagging involves mimicking a population by randomly creating “training” sets” from the sample cohort, against which the covariables are tested for inclusion in risk-hazard analyses. Many thousands of random training sets can be tested rapidly in automated programs. The proportion of training samples in which a particular variable is selected for inclusion in the regression equation indicates the reliability of that variable (Fig. 4). We typically bootstrap in excess of a thousand times and include in final multivariable models only those variables that are selected in more than 50% of training sets.
The aim of “bagging” is to determine the reliability of risk factors that have been identified within the analysis (“sample”) dataset (significant risk factors identified are “A”, “B” and “C”). Patients within the sample dataset are randomly re-sampled to produce “training datasets” of equal size to the original. The risk-hazard analysis is undertaken on each training dataset to identify statistically significant variables. Automated computer programs can perform many thousand bootstrap re-samplings. In this hypothetical example, variable “A” is also significant in all training sets. The inference is that there is 100% likelihood that the p value is less than or equal to the value chosen for the threshold for significance in the model (e.g. p ⩽ .1 or p ⩽ .05). Variable “B” is significant in 50% of training sets, and the inference is that there is at least a 50% likelihood that the p value is less than or equal to the chosen threshold for significance. Although variable “C” was identified as a significant risk factor in the sample dataset, it is only significant in 30% of the training sets. Because this is below our accepted threshold of 50%, we infer that variable “C” is not a reliable risk factor.
Absence of bagging is a limitation of the majority of clinical research studies. Variables identified during risk-hazard analysis frequently fail to withstand bootstrapping. To quote Leo Breiman, who developed the technique in the late 1980s: “…bagging is a step towards making a silk purse out of a sow’s ear, especially when the sow’s ear is twitchy”.Reference Breiman19 It improves accuracy and reliability of the risk-factors identified, and ought to form part of every modern clinical risk-hazard analysis.
3. Transition to competing endstates
Problem: How should you accurately investigate outcomes other than survival?
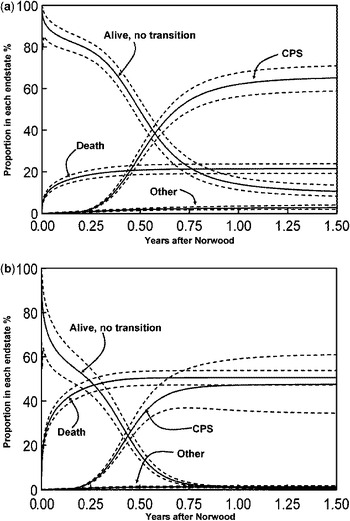
Example:After undergoing Norwood palliation, a child may subsequently transition to cavo-pulmonary shunt. However, the rate of transition to cavo-pulmonary shunt is always competing with the risk of death. At any point, the child may either have: 1) died without transition, 2) transitioned to cavo-pulmonary shunt, or 3) transitioned to some other endstate. Alternatively, the child may be “none of the above” and is therefore: 4) alive without having transitioned (Fig. 5).
Competing risks analysis of transition to endstates. Babies who undergo Norwood palliation will assume one of several mutually exclusive endstates including: 1) either death without receiving further transition to cavo-pulmonary shunt (CPS), 2) transition to cavo-pulmonary shunt or 3) transition to some other outcome. Any child not in any of these categories is actually in a fourth endstate: 4) alive, with no transition. By creating separate parametric models of each of these time-related outcomes, a competing risks model can be constructed. At “time zero”, all children are alive with no transition. Gradually, as time progresses, children will assume each different endstate at different rates, as shown by each individual curve. At any time point, the sum of all curves is 100%. Any outcome other than death (for example “freedom from re-operation”) should ideally be analyzed using competing risks methodology because that outcome will always be competing with death. Parametric competing risks analyses can be used like any other parametric model to create stratifications and make predictions. For example, the competing risks plots have been stratified for: a, a neonate with favourable characteristics (3.6 kilograms with 4.7 millimetre ascending aorta, mitral valve z-score −4.3, undergoing Norwood on day 4 of life); b, a neonate with unfavourable characteristics (2.8 kilograms with 2 millimetre ascending aorta, mitral valve z-score −7.4, undergoing Norwood on day 9 of life).Reference Ivanov, Borger, David, Cohen, Walton and Naylor24

If a child dies before transitioning, then they are no longer at risk of undergoing cavo-pulmonary shunt. Therefore a key principle of survival analyses has been broken: not everyone is “at risk” of the “event” for the duration of follow-up. One frequently adopted approach is to remove all the “deaths before intervention” from the analysis or otherwise use a composite event outcome. This approach is both ill-conceived and derived from poor logic.
Competing risks methodology uses parametric and non-parametric modelling to consider instead the simultaneous time-related risk of a patient reaching any one of previously defined mutually exclusive outcomes.Reference Ashburn, McCrindle and Tchervenkov20 Each outcome is independently modelled, and patients reaching an alternative endstate before the event are censored in that particular model. The competing endstates can be viewed together by examining the proportion of the population in any given endstate at any given time. At time zero, all are alive and free from transition to any endstate (including death), but infants will gradually assume one of the endstates (Fig. 5a). Competing risks methodology therefore provides a true representation of the time-related risk of assuming competing endstates. These analyses behave like any other parametric model and can be used to make predictions and stratifications (Fig. 5b). In practice, almost any time-related event other than death should be analysed using a competing risks concept, because death is always a mutually exclusive competing endstate with its own hazard function and associated risk factors.
4. Predictive models
Problem: Few groups have amassed large experiences with rare, complex problems. How can we use the Data Center to aid in clinical decision management?
Example:Critical left ventricular outflow tract obstruction is managed by either of two dichotomous strategies: univentricular repair or biventricular repair. A decision to pursue either strategy must usually be made within the first few days of life, is difficult to reverse, and is potentially fatal if incorrect.
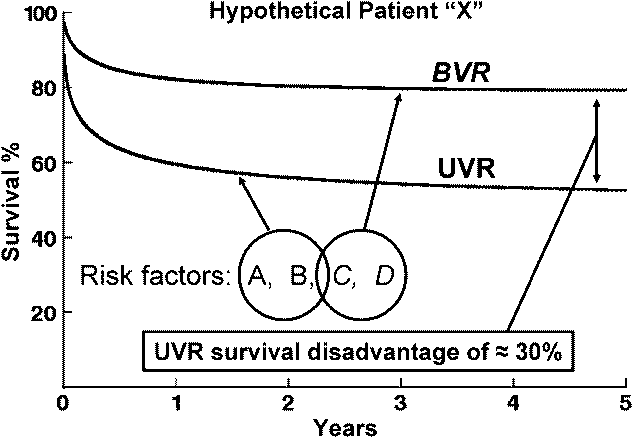
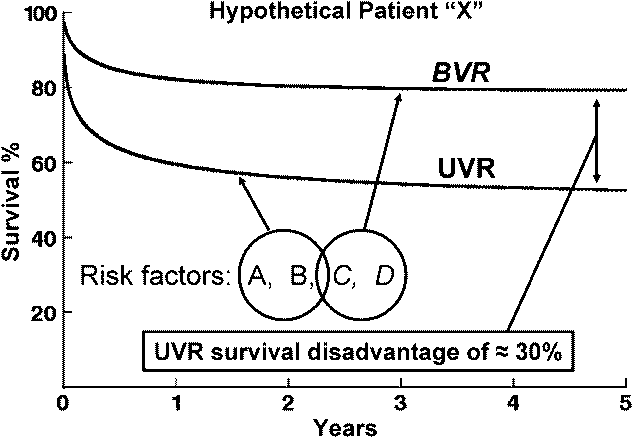
We employed parametric risk-hazard analysis to generate a prediction model to aid in the decision-management in critical left ventricular outflow tract obstruction.Reference Lofland, McCrindle and Williams21 For any given patient, the presence or absence of certain risk factors determines the magnitude by which biventricular or univentricular repair is favoured (Fig. 6). The model (available at www.chssdc.org) was derived from 362 infants across 26 institutions and covers the entire morphological spectrum of left ventricular outflow tract obstruction.
Concept of the Congenital Heart Surgeons’ Society prediction model for critical left ventricular outflow tract obstruction. For all 362 children enrolled with critical left ventricular outflow tract obstruction, 139 underwent biventricular repair and 223 underwent univentricular repair. Parametric survival models were created for those who received either biventricular repair or univentricular repair, and risk-hazard analysis was then undertaken for each management strategy. Subsequently, for any given patient “X”, that patient’s constellation of univentricular repair risk factors (risks A and B) enables survival to be predicted with univentricular repair. For the same patient’s constellation of biventricular repair risk factors (risks C and D), survival can be predicted with biventricular repair. The magnitude in difference between predicted survival for either management strategy therefore indicates the magnitude by which one strategy is favoured over the other.
The medical literature is over-flowing with (usually expert- or consensus-based) algorithms to assist practice: do we really need mathematical decision aids to assist in the management of congenital heart disease? Unfortunately, the human brain is not an especially reliable tool for computing precise quantitative predictions based on a multitude of concomitant information.Reference Liao and Mark22 Provided with detailed case summaries, cardiologists perform significantly worse at predicting prognosis than computer regression models based on data.Reference Kong, Lee and Harrell23 Operative mortality following coronary artery surgery is predicted more accurately by logistic regression models using parsimonious characteristics, than by surgeons using a full abstract of clinical information. Interestingly, even when the surgeons were provided with the predictive rule, they placed greater trust in their own intuitive judgement, despite its being less accurate.Reference Ivanov, Borger, David, Cohen, Walton and Naylor24
Several barriers exist to clinical adoption of decision aids. Implicit in their use is an acknowledgement that expert clinical opinion and experience is fallible. Regression models are complicated to use, as they require solving a complex equation. In addition, a regression model will only function when provided with all the necessary clinical information, and in the correct form. Lastly, an assumption under-pinning all models is that their use translates into improved clinical outcome. This latter point is merely speculation without model validation (for example, through retrospective examination of concordant and discordant practice).
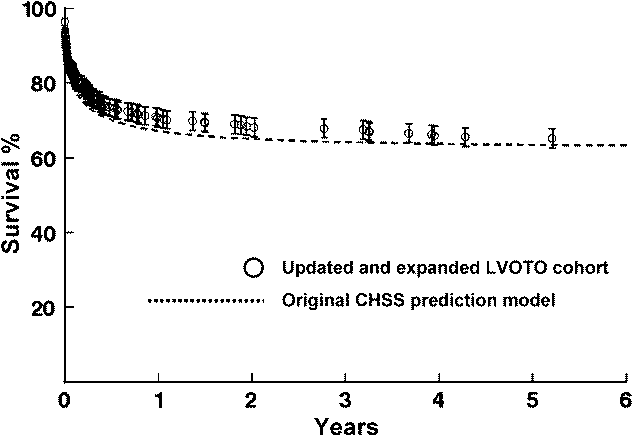
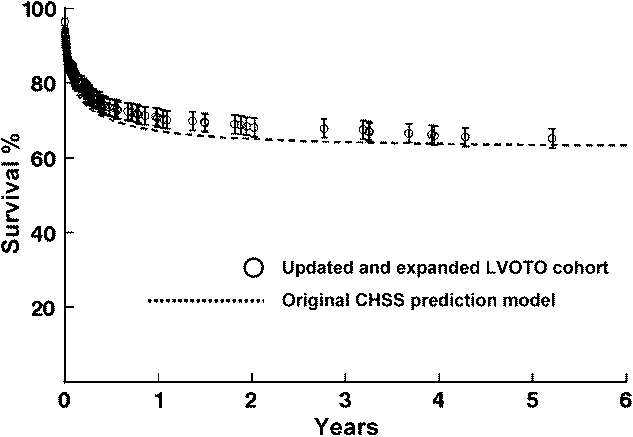
We (and othersReference Colan, McElhinney, Crawford, Keane and Lock25) believe that decision-making regarding critical left ventricular outflow tract obstruction is ideally suited to the benefits of a prediction model. Few single individuals have amassed large personal experiences, and decision management is therefore likely to be obscured by anecdote. Our regression tool has been derived from the experiences of hundreds of infants in 26 institutions and the full spectrum of critical left ventricular outflow tract obstruction. All the variables can be discerned from a baseline echocardiogram, and the internet offers a ubiquitous platform for efficiently performing the computation. In our latest re-evaluation of the model,26 survival was accurately predicted by the Congenital Heart Surgeons’ Society model in an expanded cohort of infants (Fig. 7).
The Congenital Heart Surgeons’ Society prediction model for critical left ventricular outflow tract obstruction was initially reported in 2001 and derived from a cohort of 295 infants. During revision of the model in 2006, the original Congenital Heart Surgeons’ Society prediction model (2001) was tested against the larger and updated cohort of 362 infants. Survival predictions generated by the original model (dashed line) closely match actual survival (circles) of the expanded and updated cohort, serving to validate the predictive accuracy of the methodology.
5. Comparisons in the absence of randomised controlled trials
Problem: How do we make appropriate comparisons of clinical management options when randomised controlled trials would be impractical or prohibitively expensive?
Example:The reduced availability of paediatric allograft conduits is driving the search for safe alternatives. However, are we satisfied that the performance of bovine jugular vein (Contegra) matches that of allograft conduits in neonates?
Observational studies from individual institutions have been the main source of data on functional performance of specific conduits.Reference Brown, Ruzmetov, Rodefeld, Vijay and Darragh27–Reference McMullan, Oppido, Alphonso, Cochrane, d’Acoz and Brizard29 Crude comparisons can therefore be undertaken, but are clouded by case-mix and institutional bias. A randomised controlled trial to compare conduits would be the ideal scenario, but seems unlikely and would be expensive. A multi-institutional, non-randomised, propensity-adjusted approach is instead a useful alternative method of comparing treatment arms in a risk-adjusted retrospective fashion, mimicking a randomised trial. The Data Center has recently employed propensity-adjusted methodology to compare Contegra and allograft performance in patients with common arterial trunk, otherwise known as “truncus arteriosus”. This analysis illustrates how a large indiscriminate inception cohort (all patients receiving any form of prosthetic right ventricle to pulmonary artery conduit) has subsequently been used to answer additional questions driven by clinical need.
Numerous baseline patient-specific features (diagnosis subtype, demographics, anatomical dimensions, functional and morphological variables) are included in a logistic regression analysis predicting the likelihood (or “propensity”) of a patient belonging to one group or the other. Using this soup of information, the propensity is therefore an indicator of the “distance” in one patient’s characteristics from that of another. During the longitudinal analysis of conduit function, the propensity score is included in the regression models in order to adjust for baseline differences between the experimental groups.
6. Continuous outcome analysis
Problem: How do we undertake longitudinal analysis of functional outcomes in the most cost-effective manner?
Example:Emphasis in congenital heart disease is now shifting from early survival and re-intervention to long-term quality of life and functional outcomes. In order to understand time-related progression of cardiac functional performance, we need to be able to undertake longitudinal analysis of patients within large cohorts, often using numerous repeated measures.
Longitudinal analysis requires temporal data to be linked to the individual patient. Because every intervention, investigation, or clinic consultation is documented for cohorts of the Data Center, we have been able to acquire data for longitudinal analysis relatively efficiently and at minimal cost. For example, the progression of right ventricle to pulmonary artery conduit attrition in 329 infants was investigated by studying reports for all 1534 echocardiograms known to have been undertaken on every child in the cohort.Reference Karamlou, Blackstone and Hawkins30
In addition, because we remain in contact with the families, acquiring consent for participation in additional outcome assessment is facilitated. For example, in order to study long-term functional outcomes after repair of pulmonary atresia with intact interventricular septum, the Data Center is embarking on an analysis of late functional assessment using exercise-testing and quality of life questionnaires. The denominator cohort is well known to us, their baseline morphology is fully characterised, and we are in regular consensual contact with them. The logistical and financial challenges involved in recruiting for functional assessment have therefore been minimised.
C. Managing ethics and consent in the modern era
Ethics
The Data Center has endured radical changes in attitudes towards the requirements of research ethics boards, confidentiality, and privacy of protected health information. Seeking approval from the institutional ethics board was not required (or even thought of) at the time of recruitment for the study of patients with transposition of the great arteries in 1985. By contrast, approval is now universally necessary. This task has become onerous, because in North America, multi-institutional studies require institutional approval at all local centres and the Data Center. The implementation of a central application processReference Slater31 or national committees with jurisdiction over local ethics boards – as exists in other countries – would greatly facilitate multi-institutional work. In addition, different legal interpretations of who has ethical jurisdiction can be problematic, particularly where follow-up care has involved numerous institutions. Frequently, parent institutions insist that they hold jurisdiction, despite patients having previously consented to central Data Center follow-up and data accrual.
Recruitment and consent
Until ethical jurisdiction issues are resolved on a national and international level, we are exploring avenues to cement a consensual relationship between family and Data Center from the outset. Presently, individual members are responsible for obtaining consent, which is then forwarded to the Data Center. Therefore, written consent is not obtained directly by the Data Center (although consent is subsequently “legally implied” by families returning follow-up information by mail).
An alternative model we are pursuing is for the member to instead instigate contact between family and Data Center – who then obtain consent for participation. Consent by telephone is both legal and feasible. We contend that direct consent with the Data Center will supersede certain constraints imposed by individual institutional ethics boards,Reference Kalra, Gertz, Singleton and Inskip32 for example, “pseudonymisation”.Reference Noumeir, Lemay and Lina33 For example, if a family has consented to central data accrual and follow-up, a local ethics institution cannot over-ride their consent and insist on de-identified data. In addition, a model of telephone consent will allow for repeated consent during follow-up, thereby easing the transition from parental assent to patient consent. The transition of patients to adulthood is presenting an important obstacle to continued follow-up, because if contact is lost, it has been difficult or impossible to re-establish. However, repeated telephone consent for patient-tracing during this transition may significantly simplify the re-location of young adults “lost-to-follow-up”.
Summary
Multi-institutional observational analyses have provided much of our present understanding of congenital cardiac procedures and outcomes. We believe the Data Center – and similar other observational research enterprises – will become an ever more valuable commodity in the future. Now that overall survival after paediatric cardiac surgery is over 95% (and as high as 98% in selected centres), attention is shifting towards long-term quality of life. Data Center cohorts undergo annual cross-sectional follow-up for life and will offer ideal opportunities for assessing long-term functional outcomes.
Acknowledgement
We thank The Children’s Heart Foundation (http://www.childrensheartfoundation.org/) for financial support of the publication of this research.
Appendix
Cox Versus temporal decomposition
Commentary by Dr Eugene H Blackstone
Over the years it has been a source of great amusement to me that the development of a parametric decomposition model at the University of Alabama, Birmingham by myself, David Naftel, and Malcolm Turner is often pitted against Cox modelling as being more complex (harder to use) while noting that Cox models are now so much more flexible with time-varying aspects and so forth. I agree that Cox models are simpler to use because they have become ubiquitous in statistical software. However, the temporal decomposition method has only a single hurdle as its disadvantage and no other; namely that the underlying – usually very simple – hazard function must be modelled. With little experience, this is not a great hurdle. However, compared with the 1960s, 70s, and 80s, the level of biomathematical training of statisticians has recently declined enormously. Therefore, even graduates of advanced statistical programs, with a lot of mathematical background, have zero appreciation of biological – particularly compartmental – models. This then becomes a hurdle and is the one drawback to temporal decomposition methods.
However, once the hurdle of biomathematics is overcome, everything else becomes far easier and more intuitive than any kind of Cox modelling, including its extensions. Time-varying covariables are handled in a natural way, whereas in Cox modelling they are instead handled in a rather stereotypical and not necessarily biological fashion. Prediction still uses the baseline survival function in Cox modelling, and I see few reports where statisticians using Cox models have been willing to predict survival for a series of patients and compare their predictions based on their multivariable models (with or without time-varying covariables) against observed data.
Arguments about left censoring are specious because all this has to do merely with how one sets up the likelihood. In the meantime, ever since 1983 we have included interval censoring, analysis of repeated events, and weighted-events analyses, which have been useful in industrial situations (but for some unknown reason have not yet made it into medicine). The point is, there is absolutely nothing that Cox modelling can do that cannot be done with a temporal decomposition model after the hurdle of modelling the generally simple, low-order underlying hazard is done.
Why then should we be amused? We are amused because all these features of our temporal decomposition models were developed in direct response to challenges from Dr D. R. Cox himself when David Naftel and I spent time with him in London in either the late 1970s or very early 1980s. He reviewed with us many of the survival curves we had stratified in multiple ways for congenital cardiac disease and valvar cardiac disease. He immediately pointed out the problem of the early hazard phase, which he believed very likely indicated non-proportional hazards and predicted would be a function of different types of variables from those of late hazard. He said, “You boys ought to be smart enough to figure out how to model this.” Up to that time we had been using time-segregated Cox models, which he thought was suboptimal because they required an arbitrary temporal cutoff point. He also expressed opinion that he was surprised at how the so-called Cox or proportional hazard model had caught on with all its simplistic assumptions, when it would be so easy to go the next steps. He challenged us to go those next steps. At that same time, we also collaborated with Dr Wayne Nelson, a statistician at General Electric, who was focused on industrial applications of time-to-event analysis. It was really Dr Nelson who directed our attention to the cumulative hazard function to help us begin to understand what the underlying hazard might be. He was also the one who challenged us to incorporate repeating and weighted events into any attempts we made at bettering the state of time-to-events models.
We, of course, have not been alone in attempting to develop better models than Cox models in cardiovascular medicine. Dr Keaven AndersonReference Anderson, Odell, Wilson and Kannel34 developed some similar models for the Framingham heart study. Dr R Clifton Bailey, at what was known as Health Care Financing Administration and now Centers for Medicare and Medicaid Services, actually took a temporal decomposition approach to modelling mortality among Medicare recipients stratified by institution in the early 1980s.Reference Hartz, Krakauer and Kuhn35 The Health Care Financing Administration actually supported some of the development of our parametric models, particularly certain features that were important to them, such as interval censored data and certain variable selection features. Our program for testing goodness-of-fit is essentially unchanged from the specification given to us by the Health Care Financing Administration, and I suppose some day we ought to update it.
Thus, over the years it has been hard for us to escape Dr Cox’s admonition that we should be smart enough to be doing something better than using Cox regression!