1 Introduction
Phonetic and phonological similarity in spoken languages has been a topic of exploration for linguists for quite some time (see, for example, Miller & Nicely's Reference Miller and Nicely1955 seminal study, as well as much subsequent work). Signed languages, however, have seen much less research. This paper is a further contribution, in an effort to change that. We propose a novel, theoretically driven, method of quantifying similarity between handshapes. We then test this method against signers’ subjective similarity ratings, and find that it is significantly correlated with signers’ intuitions about similarity in form. Although fingerspelling has not generally been considered in previous work, we use it to isolate handshape similarity from other aspects of American Sign Language (ASL). The reason for this will be discussed further in §2.
At the beginning of systematic research into signed languages, there were a number of attempts to quantify handshape similarity within signs (Locke Reference Locke1970, Weyer Reference Weyer1973, Lane et al. Reference Lane, Boyes-Braem and Bellugi1976, Stungis Reference Stungis1981, Richards & Hanson Reference Richards and Hanson1985). Most of these studies relied on signer judgements of similarity or confusion between two stimuli. Researchers then identified clusters of handshapes based on this data. In this way, they were using psycholinguistic data to produce a linguistic model of similarity, rather than using psycholinguistic data to confirm the validity of a linguistic model. The lack of a theory-driven similarity metric, which makes it impossible to use psycholinguistic data to test linguistic models, is mentioned explicitly by Lane et al. (Reference Lane, Boyes-Braem and Bellugi1976: 267) as a gap, because there simply were not appropriate linguistic models to test: ‘the present study, then, undertakes to see what sort of featural analysis for ASL results when, using certain specific statistical techniques, we proceed from psychological data to a linguistic model, rather than the reverse’.
All of the studies mentioned above came to the conclusion that there are (at least) two distinct categories of handshapes: open handshapes with the fingers of the hand extended, and closed handshapes with the fingers of the hand flexed. Individually, each study developed more finely grained distinctions. For example, Lane et al. (Reference Lane, Boyes-Braem and Bellugi1976) found clusters of handshapes that they used to separate handshapes into groups defined by distinct features. Moreover, Stungis (Reference Stungis1981) proposed that this clustering could be turned into a continuous feature space. He found that handshapes could be decomposed along two dimensions: extension (open or closed) and uniform breadth (simplistically, this is whether or not all of the fingers have the same configuration).
There has been much more work on phonological models of signed languages (e.g. Mandel Reference Mandel1981, Liddell & Johnson Reference Liddell and Johnson1989, Sandler Reference Sandler1989, van der Hulst Reference van der Hulst1995, Brentari Reference Brentari1998, Eccarius Reference Eccarius2002, Sandler & Lillo-Martin Reference Sandler and Lillo-Martin2006), and more recently on phonetics (Tyrone et al. Reference Tyrone, Nam, Saltzman, Mathur and Goldstein2010, Johnson & Liddell Reference Johnson and Liddell2010, Reference Johnson and Liddell2011a, Reference Johnson and Liddellb, Liddell & Johnson Reference Liddell and Johnson2011, Whitworth Reference Whitworth2011, Mauk & Tyrone Reference Mauk and Tyrone2012, Keane Reference Keane2014). Of these, Tyrone et al. (Reference Tyrone, Nam, Saltzman, Mathur and Goldstein2010), Mauk & Tyrone (Reference Mauk and Tyrone2012; for location and contact) and Keane (Reference Keane2014; for handshape) adopt the framework of articulatory phonology, which explicitly links phonological representations of signs with articulatory gestures that produce those signs, which are phonetic in nature.
The models that have been proposed are exactly the kinds that Lane et al. (Reference Lane, Boyes-Braem and Bellugi1976) observed were lacking at the time of their studies on handshape similarity. Most of these models divide the hand into subcomponents, each of which can take categorical values (via binary features, dependency models, etc.). For example, the Prosodic Model (Brentari Reference Brentari1998) represents handshapes using a branching feature system. It consists of specifications indicating which fingers are active (selected) and which are inactive (non-selected), as well as what the flexion-extension configuration is of the base (metacarpophalangeal (MCP)) and non-base (proximal interphalangeal (PIP) and distal interphalangeal (DIP)) joints.
Keane's (Reference Keane2014) Articulatory Model of Handshape extends Brentari's model by developing an explicit connection between the phonological specification for a handshape and target angles for each joint of the (phonetic) hand configuration. The model can produce continuous (as well as categorical) measures of hand configuration which have been shown in previous studies to better match data on handshape similarity and confusability (Stungis Reference Stungis1981). Additionally, these continuous measures provide a straightforward way to compare two handshapes. Other phonological models could, in principle, be used, although each would require the development of a translation from categorical phonological features to continuous joint angles, or an independent method of comparing the categorical features directly to each other. For these reasons, we will use Keane's model as a basis for our theory-driven measure of phonetic similarity. The nature of this similarity will be described in detail in the next section, and then tested with psycholinguistic evidence in §3.
2 Metrics for similarity for ASL fingerspelling
Handshapes in sign languages do not occur in a vacuum: they are just one component that makes up lexical signs, along with the other major parameters: location, movement, orientation and non-manual markers (Stokoe et al. Reference Stokoe, Casterline and Croneberg1965, Battison Reference Battison1978). In ASL, fingerspelling is a loanword system used to borrow (written) English words. In the fingerspelling system, each orthographic letter is mapped onto a set of 22 unique handshapes, plus, in a limited number of cases, a non-default palm orientation or an added movement. These handshapes are executed in quick succession, in the sequence of the letters of the written word. Broadly speaking, fingerspelling has been found to conform to many aspects of the ASL phonological system (Brentari Reference Brentari1998, Padden Reference Padden1998, Brentari & Padden Reference Brentari, Padden and Brentari2001, Cormier et al. Reference Cormier, Schembri and Tyrone2008).Footnote 1 Because the main contrast between letters in fingerspelling is for the most part only a handshape contrast, fingerspelling is a perfect place to test theories of the representation of handshape independently of the possible confounds of movement or location that would be inherent in using lexical signs or nonce signs that conform to the phonological structure of lexical signs. Similarity across these three parameters was studied by Hildebrandt & Corina (Reference Hildebrandt and Corina2002), who found that signs that had identical movements (or identical locations, for (sign-naive) hearing subjects only) were rated as more similar than signs that had identical handshapes, both by native signers and by hearing subjects. Late learners of ASL, on the other hand, rated signs that had identical handshapes as much more similar than signs that had identical locations or movements. However, Hildebrandt & Corina did not compare (and did not purport to compare) the relative similarities between different handshapes. Rather, they asked subjects to compare a target pseudo-sign with four other pseudo-signs. The target and the other pseudo-signs had one or two identical parameters (movement, location, handshape), but all other parameters were different. They then asked signers to pick one pseudo-sign as most similar to the target, in order to determine which parameter affected similarity the most. Our study, on the other hand, delves into the relative similarities of handshapes, rather than looking only at identical or non-identical handshapes.
Keane's (Reference Keane2014) model provides joint-angle targets for each handshape used in ASL fingerspelling. This allows for a straightforward comparison of individual handshapes, by taking the difference between the two sets of joint-angle targets. This difference can then be thought of as the similarity between any given pair of handshapes. This difference is further refined by weighting each joint on the basis of how proximal (or how close to the centre of the body) it is. This weighting is supported by work that shows that movement of more proximal joints generates larger visual differences, which has been linked to visual sonority for signed languages (Brentari Reference Brentari1998). Additional support for this kind of sonority in sign languages can be found in Hildebrandt & Corina (Reference Hildebrandt and Corina2002). Movement and location are parameters that in general use more proximal joints than handshapes, which results in larger visual differences. It is exactly those parameters for which identical movements and locations were rated as more similar than identical handshapes (this pattern is found in general, and specifically with native signers).
2.1 Comparing two handshapes
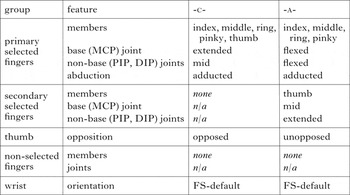
To make this comparison explicit, consider the ASL fingerspelling handshapes -c- and -a-. Each handshape is made up of phonological features for each part of the hand that has been found to be phonologically contrastive, as shown in Table I, which is a notational variant of the phonological features from Brentari (Reference Brentari1998), which are modified slightly in Keane (Reference Keane2014). For further details about these specifications, we refer readers to these works.
Phonological specifications for -c- and -a- handshapes. Examples of these can be found as the first two letters of the first word (c-a-t) in Fig. 1. The groups are the levels of selection. If a group has no members, the features for those members are not applicable. FS-default is the default wrist orientation for fingerspelling.

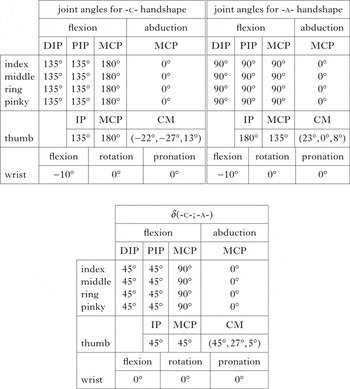
The next step is to move from these phonological features to joint angles which represent the phonetic target for the handshape. To do this, the Articulatory Model of Handshape (Keane Reference Keane2014) uses translations to (canonical) joint-angle targets for each phonological feature. For example, the following joint angles can be used for the extension values of the base and non-base joints: full extension (although not hyperextension) is 180°, full flexion (for most individuals) is 90° and, finally, the position between full extension and full flexion, often labelled mid, is 135°. For more details about this translation mechanism, see Keane (Reference Keane2014). It should be noted that these angles are the angles formed by the bones on either side of the joint, rather than involving deviation from the standard anatomical position or any other position (e.g. full extension). Using the computational implementation of the Articulatory Model of Handshape,Footnote 2 we can calculate joint-angle targets for our two example handshapes, -c- and -a-, as shown in Table II.
Phonetic joint-angle targets for each joint of the hand and wrist for the -c- and -a- handshapes, as well as the difference (δ) between each joint angle for -c- and -a-. Each of the interphalangeal joints (DIP and PIP) has a single degree of freedom: flexion–extension. The MCP joint has two degrees of freedom: flexion–extension and abduction–adduction. For the thumb, there is only one interphalangeal (IP) joint, the MCP joint only has one degree of freedom (flexion–extension) and the abduction column triplet of numbers is for the three degrees of freedom of the thumb's CM (carpometacarpal) joint. The wrist has three degrees of freedom: flexion–extension, rotation and pronation–suppination. The differences in degrees represent the magnitudes of the differences between the -c- and -a- handshapes, so there are no negative values.

Using the joint-angle targets in Table II, it is simple to compare two handshapes. Each joint angle from one handshape can be subtracted from the corresponding joint angle of the other handshape. For example, the index DIP for -a- (90°) is subtracted from the index DIP for -c- (135°), resulting in a difference of 45°, the index PIP for -a- (90°) is subtracted from the index PIP for -c- (135°), resulting in a difference of 45°, the index MCP for -a- (90°) is subtracted from the index MCP for -c- (180°), resulting in a difference of 90°,Footnote 3 and so on, for each joint angle.
Although it is possible to have a degree difference that is negative, the values which our models produce are always positive. For example, in the case of the thumb IP joint in our example, subtracting the -a- (180°) from the -c- (135°) gives −45°. However, we use the absolute value of the difference in degrees (i.e. the magnitude of the change, ignoring direction) when calculating our similarity metrics. Additionally, it should be noted that each degree of freedom, for joints that have more than one, is added to the score as if it were a separate joint. For example, the CM joint of the thumb in our example contributes 45 + 27 + 5 = 77 degrees of difference (before the weights are applied). Other possible approaches include dividing the contribution of each degree of freedom difference by the number of degrees of freedom for each joint, or using the simple angle between the two bones rather than decomposing into degrees of freedom. These methods will make slightly different predictions from each other, and determining which most closely matches signers’ perception is left for future work. It should be noted that the vast majority of the differences in the scores comes from joints on the hand that have a single degree of freedom, where this problem does not arise.
Finally, to get a single number that represents how different the handshapes are from each other, we sum all of the joint differences together.Footnote 4 But first, we multiply each cell by a weighting factor: DIPs and IPs have a weight of 1, PIPs have a weight of 2, MCPs and CMs have a weight of 3 and the wrist has a weight of 4.Footnote 5 It is known that joints that are more proximal will result in larger parts of the body moving. Additionally, there is evidence from other research that shows that these larger visual differences are a type of visual sonority for signed languages (Brentari Reference Brentari1998). For this reason, we weight the scores for similarity such that a 1° difference at the MCP joint will be quantified as more different than a 1° difference at the DIP joint. After weighting, we can sum each joint-angle difference to arrive at a single number that is a quantification of the difference between the -c- and -a- handshapes: 2031.
Now that we have a quantification for the difference between two individual handshapes, we need to extend this method to account for handshape sequences.
2.2 Handshape sequences, including fingerspelling
The proposal above for individual handshape similarity must be extended to account for fingerspelled words which are composed of sequences of multiple handshapes. All models of fingerspelling perception, except for the Initial Cipher model of Blasdell & Clymer (Reference Blasdell and Clymer1978), posit that fingerspelling perception is not simply the identification of each handshape individually. Rather, transitions play some role in perception (Wilcox Reference Wilcox1992). The Movement Envelope Theory for fingerspelling (Akamatsu Reference Akamatsu, Stokoe and Volterra1985) goes further, establishing that it is the overall shape of the hand opening and closing within a word that aides perception. Akamatsu (Reference Akamatsu1982) shows that children acquiring fingerspelling first identify and mimic the overall movement of fingerspelling, and then master full execution. The movement envelopes of two words could be thought of as a proxy for similarity: if two words share similar or the same movement envelopes, they will be more similar than two words that have very different movement envelopes. The movement envelope can be interpreted in two different ways.
The first interpretation is that the crucial aspect of fingerspelling that generates the perception of an overall movement envelope is the transition between different handshapes (or letters). This view is supported by work on sonority and local lexicalisation of fingerspelling (Brentari Reference Brentari1998). In local lexicalisation, a fingerspelled word is reduced during a single discourse from the full fingerspelled version to a reduced version that looks more like a loan sign. Which letters are preserved and which omitted is not random: the transitions between letters that preserve the largest movements are retained, first those with a non-default orientation or movement, then, if there are not enough of those letters, those that preserve an overall alternation of open and closed handshapes. This pattern has been linked to sonority, which is the relative strength (or salience) of a specific sound or syllable in spoken languages or of a specific movement or syllable in sign languages (Brentari Reference Brentari1998). As she shows, when the word s-y-n-t-a-x is being locally lexicalised, the output is s-y-t-x, with an additional movement of the wrist downward between the -s- and -y-, and an additional movement of the wrist sideways between -t- and -x-. The -n- and -a- are deleted, because both n-t and t-a are transitions between closed handshapes, adding no salient twisting movements of the wrist or opening/closing movements of the fingers.
The second interpretation is that the crucial aspect of fingerspelling that generates the perception of an overall movement envelope is the overall shape of the whole word, including the position in which each of the different levels of openness or closedness of the hand occurs. Under this interpretation, it is not only the overall extension of the fingers that is important, but where within the word each class of handshape is. To make this concrete: consider the two fingerspelled sequences a-b-a and b-a-b. In the first, the word starts with a closed handshape (-a-), then has an open handshape (-b-), and then ends with a closed handshape (-a- again). In the second, the word starts with an open handshape, then has a closed handshape and ends with an open handshape. Using just the contours between the handshapes as a guide (as with the first interpretation), these words look similar: they each have the same sequence of transitions (just in a different order): a-b and b-a. In the second interpretation, despite the fact that there are the same transitions, the position of each open or closed handshape is important in distinguishing these two sequences.
Based on these two disparate interpretations of the movement envelope, there are two possibilities for comparison. The first method, what we call the contour difference method, follows directly from the first interpretation of the movement envelope, and the second method, the positional similarity method, follows directly from the second interpretation. It should be noted that although these different methods were inspired by these two different interpretations of the Movement Envelope Theory, they are fully independent of it. The contour difference method emphasises the overall contour of fingerspelled words, i.e. how one letter transitions to the next. The positional similarity method, however, looks at the position of each letter within the word, and determines how similar the handshapes in that position are to handshapes in the same position of other words.
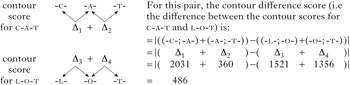
The first method results in what we call a contour difference score; this score is based on the general finding that there are (at least) two classes of handshapes (open and closed). In this method, each handshape in the word is compared to the one that follows it, i.e. the differences between each sequential pair of letters is calculated and then summed together. Under this metric, a word that has a sequence of all open or all closed handshapes will have a low score, and a word that has a sequence of open–closed handshapes will have a high score. In order to arrive at a similarity score for a pair of words using this method, a contour score for each word is calculated, and then the difference between them.Footnote 6 Figure 2 exemplifies this for the pair of words in Fig. 1.

Calculation of the contour difference score for the words c-a-t and l-o-t. Under this metric, a sequence of all open or all closed handshapes will have a low score, and a word with a sequence of open–closed handshapes will have a high score.

The contour difference method is based on an extension of Hanson et al. (Reference Hanson, Liberman and Shankweiler1984), who found that individual letters that are more closed (e.g. -a-, -m-, -s-) are more easily confused with each other (because of greater similarity) than more open letters (e.g. -b-, -c-, -w-). If we extend this to fingerspelled sequences, words that include more closed handshapes are considered more similar to one another, and words with more open handshapes are more dissimilar. Although to our knowledge, this extension has never been published in this level of detail, it has been used by sign linguists. In fact, the first experiment described here (see §3) was run using exactly this distinction.Footnote 7 When the ratings using this binary measure didn't align with expectations, we began our collaboration on the work that led to this article, and designed both the contour difference method (to match as closely as possible this first method with a continuous measure) and the positional similarity method described below.
The second method results in what we call a positional similarity score. In this method, the members of each pair of letters in the same position within the two words are compared, and their difference is calculated. The differences for each position in the word are then summed together. Using this metric, words with the same or similar handshapes in the same positions will be scored as more similar than those with dissimilar handshapes in the same positions. Words that are similar will have a low score, and words that are dissimilar will have a high score, as shown in Fig. 3 for c-a-t and l-o-t.
Calculation of the positional similarity score for the words c-a-t and l-o-t. Under this metric, words that have similar handshapes in corresponding positions will have a low score, and words that are dissimilar will have a high score.

Although the contour difference score can easily compare two words of different lengths, the positional similarity score is limited to words that have the same number of letters. In the experimental data described below, words with either three or four letters were compared in pairs of the same length, as well as in pairs that differed in length. In order to attain a positional similarity score, a composite metric was developed: the shorter word was held constant, but then compared to all possible strings of the longer word where one of the letters was deleted. The mean of this score resulted in the final positional similarity score for mismatched lengths. For example, to generate an overall positional similarity score for the pair of words l-o-t and l-e-a-n, scores were calculated for each of the pairs (l-o-t; e-a-n), (l-o-t; l-a-n), (l-o-t; l-e-n) and (l-o-t; l-e-a). The mean of these four individual scores was taken as the positional similarity score for δ(l-o-t; l-e-a-n). Though there are other methods that could be used to compare words with mismatched lengths, this method is a first step.
3 Psycholinguistic experiments
Previous studies relied on data from psycholinguistic experiments to develop clusters of similar handshapes, and then proceeded from their psycholinguistic data to a linguistic model of handshape similarity, rather than the reverse. The two methods proposed here for calculating the similarity of two fingerspelled words, the contour difference method and the positional similarity method (which could also be applied directly to any sequence of handshapes), are the opposite: they use a linguistic model of the phonetics–phonology interface for handshape (the Articulatory Model of Handshape) to generate a theory-driven metric of similarity. We conducted two separate fingerspelling similarity judgement studies to determine which of the two methods of similarity estimation better predicts signers’ subjective ratings of similarity. For the first rating study, manually similar words contained compact handshapes (following Hanson et al. Reference Hanson, Liberman and Shankweiler1984). For the second rating study, similar and dissimilar word pairs were selected, based on a theory-driven handshape similarity metric (Keane Reference Keane2014). Subjects’ scores were then fitted and compared, using several hierarchical linear regressions.
3.1 Methods
3.1.1 Participants
Twenty-four Deaf ASL signers participated in two separate online rating studies. In the first study there were 11 Deaf ASL signers (7 female, mean age = 32.4, SD = 9.8) and in the second study 13 Deaf ASL signers participated (11 female, mean age = 36.2, SD = 13.6). All participants acquired ASL before age 7, and reported using ASL as their primary and preferred language. All participants were congenitally deaf, and had severe (71–90 dB) to profound (90–100 dB) hearing loss. The experiment was administered online, and all participants received gift certificates upon completion.
3.1.2 Stimuli and procedure
In the first rating study, 214 pairs of manually similar and dissimilar fingerspelled words were selected, based on psychological theories of handshape similarity; the manually similar words contained consonant handshapes that have been argued to be confusable by native signers (e.g. -m-, -n-, -s- and -t-; Hanson et al. Reference Hanson, Liberman and Shankweiler1984, Richards & Hanson Reference Richards and Hanson1985) and vowel handshapes that use the same compact hand configurations and are easily confusable (e.g. -a-, -o- and -e-; Lane et al. Reference Lane, Boyes-Braem and Bellugi1976), as in m-e-a-t, s-o-n, t-e-n and e-a-s-t. Examples of dissimilar words from these previous studies are k-i-n-g, f-a-r-m, b-u-g and t-a-x. The stimuli presented were either both from a list of words with more closed handshapes (e.g. c-a-t, l-o-t, v-a-n, d-a-m) or both from a list of words with more open handshapes (e.g. s-l-o-w, o-w-l, b-a-r-n, h-a-n-d). One participant completed only half of the experiment, so we removed all of their responses (although including them does not affect the results). There were four cases where participants reported difficulties viewing the videos, and thus did not report a similarity. No other data was removed for the analysis.
In the second rating study, 132 word pairs were selected, based on our theory-driven handshape similarity metrics (Keane Reference Keane2014), i.e. the manually similar words all proceeded from open to closed (one movement open to closed), there was one change in selected fingers between letters, and no orientation changes (e.g. to or from -h-), as in c-a-t, v-a-n, r-e-n-t and l-e-a-n. The dissimilar word pairs contained more than one movement and change in selected fingers and orientation; examples included l-o-v-e, s-i-c-k, b-o-x and h-a-t. Words in the similar and dissimilar groups were matched for length (three or four letters), frequency (from CELEX; Baayen et al. Reference Baayen, Piepenbrock and van Rijn1995) and concreteness, and all had an ASL translation equivalent and no phonological or orthographic overlap. All participants responded to all the stimuli and no data was removed for the analysis.
For both studies, the stimuli were grouped as similar or dissimilar in order to create the stimuli for the experiment, giving a range of words which we expected would vary in relative similarity. However, our measures are continuous, and can measure small as well as large differences in similarity. We therefore used all stimuli pairs in our models regardless of their starting classification, calculating similarity using the contour difference and the positional similarity methods as predictors (detailed discussion of the models is in the following section).
In the first study, fingerspelled word pairs were produced by a deaf native ASL signer, who was filmed at a frame rate of 29.97 frames per second. The edited video clips were uploaded to an online survey tool for rating, and were divided into two blocks containing 107 pairs each, to allow for a break. In the second study, participants were presented with the orthographic forms of word pairs. In both studies, participants were asked to rate all word pairs for manual similarity, based on how similar the words in the pair felt to each other when they fingerspelled them to themselves on a 1–5 scale (1: did not feel similar at all; 5: felt very similar). Ratings from the online surveys were exported as a comma-separated text file for further analysis.
3.1.3 Analysis
It should be noted that our two experiments were conducted independently. The second experiment was conducted to directly test whether the contour difference and positional similarity methods were quantifying something that is psychologically real, and to see which method matched the data better. The first experiment, however, was run as subset of a separate experiment, well before the formulation of either method by our research team. Thus those ratings can be seen as independent verification, since they were collected in a kind of double-blind condition, where neither the subjects nor the experimenters knew the hypotheses being tested (and thus neither could influence the outcome of the experiment). Additionally, as described in the methods above, the two experiments used slightly different methodologies: in the first, signers were presented with videos of fingerspelled words, and asked to rate the similarity between the pair. In the second, signers were presented with printed words, and asked to think about fingerspelling them, and rate how similar they felt when fingerspelled. Thus, in the second experiment, pure visual similarity in the stimuli was not itself influencing the signers’ ratings. Models were fitted using both Subject and Experiment as hierarchical grouping variables, as well as using Experiment as a predictor variable. Although ratings in the second experiment were significantly lower (by about 0.4 points), there was no variation in which predictors were significant when the experiment was used as a predictor or grouping variable. Because using Experiment as a predictor variable or as a grouping variable (where the intercept and slope of the predictor variables are allowed to vary) does not change the results or interpretation of the other predictor variables, we will use Experiment as a grouping variable, as this accurately represents the hierarchical structure of the data (individual signers are nested within experiments).
In order to test which of the two methods of scoring (contour difference scores or positional similarity scores) predicts signers’ ratings, several hierarchical linear regressions were fitted and then compared. All models were fitted using the lme4 package (version 1.1-8; Bates Reference Bates2010) in R (R Core Team 2016). All scores were divided by the length of the words, in order to not unfairly penalise long words. In cases with mismatched word lengths, the scores were divided by 3, since the positional similarity score for mismatched pairs is the mean of the set of comparisons across the three-letter word and all combinations of the four-letter word minus one letter. For both scores, a higher score is less similar, and a lower score is more similar (i.e. perfect similarity is zero). If the scores are predictive of the signers’ similarity ratings, we expect a negative correlation (this is because the signers rated on a scale where higher ratings are more similar, whereas both the contour difference and positional similarity scores are higher if the words are less similar). All scores were scaled to z-values, for comparison of effect sizes. In each model, the subject and the experiment in which the subject's data was collected were included as hierarchical grouping variables. This allows us to see whether there were systematic differences between the two sets of data collection. The models were:
(i) the null model, with no predictor variables, which had varying intercepts (i.e. mixed effects) for subject group, subject, first word of the pair and second word of the pair.
(ii) the contour difference model, with predictor variables of the contour difference score for the word pair, the length of the words (three or four letters, or mismatched) and the two-way interaction of these. There were varying intercepts and slopes for subject group, subject, first word and second word.
(iii) the positional similarity model, with predictor variables of the positional similarity score for the word pair, the length of the words (three or four letters, or mismatched) and the two-way interaction of these, with the same varying intercepts and slopes as the previous model.
3.2 Results
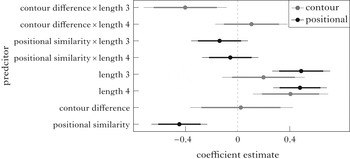
Each model will be discussed in detail below, but the predictor variable for positional similarity score was significantly correlated with signers’ ratings in the predicted direction in every model that it was included in. As the positional similarity score went up (with our model predicting that the word pairs were less similar), the ratings went down (meaning the signers thought these words were less similar). For model comparison, which will be discussed in detail in the next section, Fig. 4 shows predictor coefficients (except for the null model), with the coefficients for each predictor variable in the two models being plotted along with their confidence intervals. We can consider that the coefficient is a true effect, and not attributable to noise in the sample, when the confidence intervals do not overlap zero. This plot additionally allows us to determine not only if we have confidence that an effect is statistically significantly different from zero, but also in which direction: positive or negative (as well as the magnitude of the effect size; this kind of analysis of significance follows Gelman et al. Reference Gelman, Hill and Yajima2012, Gelman Reference Gelman2013 and Gelman & Carlin Reference Gelman and Carlin2014).
Coefficient plot for the contour difference and positional similarity models. Thick lines show 95% confidence intervals, thin lines 99% confidence intervals; dots are estimates of the predictor coefficients. If a particular predictor's confidence intervals do not overlap with zero, we can be confident that the effect of that predictor is statistically significant. This plot allows us to evaluate not just simple significance, but also the sign or direction of the effect (positive or negative), as well as to see the relative magnitudes of each effect.

The null model serves as a baseline of comparison to establish whether the complexity associated with adding predictors to the model is justified, given the data. Because there are no predictors in this model, there are no significant effects to report.
In the contour difference model, the contour difference score alone does not significantly predict the signers’ ratings. There is a significant effect of length, where four-letter words are more similar than mismatched words or three-letter words. The interaction of length and contour difference score is significant. When both words have three letters, then the smaller the contour difference score and the more similar the signers rated the pair. No other predictors had significant effects.
In the positional similarity model, the similarity score significantly predicts the signers’ ratings in the expected direction (the lower the similarity score, the higher the signers’ ratings). Additionally, word pairs that had the same lengths (either both three or both four letters) were rated significantly more similar than word pairs that were mismatched. No other predictors had significant effects.
It stands out that in no model does the contour difference score alone significantly predict signers’ ratings of the similarity of fingerspelled words. In contrast, the positional similarity score does significantly predict signers’ similarity ratings, in the predicted direction. See again Fig. 4 for the predictor coefficients for the two models.Footnote 8
We expect both the predictors that are the centre of this paper, the two different methods for comparing two fingerspelled words, to have a negative correlation, because the signers rated on a scale where higher ratings were more similar, whereas both the contour difference and the positional similarity scores are higher if the words are less similar. A negative coefficient in a hierarchical linear model shows exactly this negative correlation between predictor variables and outcome variables. As described above, the only metric that is significantly different from zero (and in the correct, negative, direction) is the positional similarity score in the positional similarity model. The contour difference score is not significantly different from zero (and thus we cannot assess the direction, or sign of the effect) in any model it is included in.
3.3 Model comparison
Although there is not a single, best method for model comparison, especially for hierarchical models like those used here, a number of methods have been proposed (see Gelman & Hill Reference Gelman and Hill2007 for an overview).
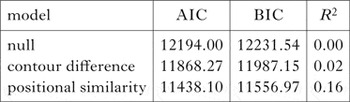
The first kind of comparison uses information-theoretic measures to determine whether the extra complexity of adding predictors is justified by the data. In other words, does adding a given parameter give us enough predictive power to justify the added complexity which it introduces to the model? There are two mainstream information-theoretic measures: the Akaike Information Criterion (AIC) and the Bayesian Information Criterion (BIC). Both methods can be fitted to different non-nested models applied to the same underlying data set, which is how we are using them here (Burnham & Anderson Reference Burnham and Anderson2004, Anderson & Burnham Reference Anderson and Burnham2006). For both AIC and BIC, lower numbers indicate a better fit of the model to the data. In the most conservative recommendations, a difference of 10 or more indicates that the models differ significantly and that the model with the lower score should be preferred (all differences between the AIC and BIC for our models were larger than this threshold). As shown in Table III, using the AIC, the simplest model that is justified given the data is the positional similarity model (AIC = 11438.10), which is significantly more supported than the contour difference model (AIC = 11868.27). Using the BIC, the simplest model that is justified given the data is also the positional similarity model (BIC = 11556.97).
Model comparison.

The second kind of comparison uses a new method for calculating R2, or the variance of the data explained by the model. Traditionally, calculating R2 for hierarchical models has not been straightforward. However recent work (Nakagawa & Schielzeth Reference Nakagawa and Schielzeth2013, Johnson Reference Johnson2014) has developed a method that gives a marginal R2, which corresponds to the R2 of the predictors alone, and a conditional R2, which corresponds to the R2 of the predictors along with the varying intercepts and slopes. With both the traditional approach and this new calculation, R2 ranges from zero (no variance of the data is explained by the model) to one (all of the variance of the data is explained by the model). We will only discuss marginal R2 here, because we are concerned with the variance explained by the predictors, and not the varying intercepts or slopes. Under this metric, the model that explains the most variance of the data is the positional similarity model (R2 = 0.16). Both the contour difference model and the null model explain very little variance in the data (R2 = 0.02 and R2 = 0 respectively).
It is clear that one model stands out: the positional similarity model (the simplest model, given the data using AIC, BIC and marginal R2). Additionally, even when the contour difference score is included in a model that is not selected (either alone, or together with positional similarity), this does not significantly predict signers’ similarity ratings.
4 Conclusion
We have demonstrated that positional similarity is the theory-driven description of handshape similarity that best matches signers’ intuitions when asked to rate the similarity of fingerspelled words. The similarity metric proposed here is exactly the kind of theory-driven metric that was recognised as missing from similarity research in the 1970s and 80s, which has also been independently confirmed with signers’ intuitions of similarity.
It is clear that the positional similarity approach is a superior fit to the data when compared to the contour difference approach. In order to define similarity in sequences of handshapes (e.g. fingerspelling), it is more important to look at the positional configuration of handshapes than to concentrate solely on the transitions between handshapes. Similarity between stimuli (words, sentences, etc.) is known to affect many psycholinguistics processes (for example, form-priming effects and the phonological similarity effect in short-term memory; Wilson & Emmorey Reference Wilson and Emmorey1997). Our positional similarity metric is an easy-to-use way of evaluating and controlling for the similarity of stimuli in other experiments.
The positional similarity method is supported by our psycholinguistic data. This approach is one of the two possible interpretations of previous work on the perception of fingerspelling (i.e. the movement envelope), and it corresponds to signers’ ratings of similarity.
Although we have presented convincing evidence that the contour difference method is not supported by the data from signers’ similarity ratings, there might be other areas where handshape contours are important. As discussed above, signers display sensitivity to handshape contours in local lexicalisation (Brentari Reference Brentari1998). Additionally, they show a tendency to choose the variant of -e- (open or closed) in order to make a more contrastive (larger) contour difference with surrounding handshapes (Keane et al. Reference Keane, Brentari and Riggle2013, Keane & Brentari Reference Keane, Brentari, Marschark and Spencer2016).
In our studies we have used signers’ ratings of similarity, but previous methods, such as handshape confusion under visual noise (Lane et al. Reference Lane, Boyes-Braem and Bellugi1976, Stungis Reference Stungis1981), could also be used to test our positional similarity method. Because this method is a metric of phonetic similarity, i.e. a metric concerning the form of the hands making the handshapes, we predict that we would see similar results for other tasks. Confusion in visual noise might attenuate or magnify the differences between two handshapes, as quantified by our metric. However, there is no evidence that, when given a sequence of handshapes (e.g. fingerspelling) under visual noise, the positional similarity method would do worse than the contour difference method. This, however, needs to be tested empirically in future work.
This study has a number of limitations. In our work, we used target or canonical joint-angle measures, not actual joint angles measured while the signer was fingerspelling. There are methods for measuring these joint angles in some conditions with special equipment. As these techniques are perfected, they could be used to measure the difference in joint angles between actual handshape tokens. This would also allow researchers to test whether similarity judgements are consistent for within-type phonetic variation as compared to across-type phonological forms (in other words: are handshapes that are phonetically different variants of the same phonological handshape rated on the same scale as handshapes that are phonologically different?). Additionally, the proximity weights adopted from Keane (Reference Keane2014) should be refined using perceptual data to scale them appropriately to signers’ perception.
Finally, our positional similarity method answers a call made nearly forty years ago. The Articulatory Model of Handshape, combined with the positional similarity approach, is a phonetically and phonologically theory-driven similarity metric for comparing handshapes. This metric not only produces results that confirm intuitions from previous studies (Locke Reference Locke1970, Weyer Reference Weyer1973, Lane et al. Reference Lane, Boyes-Braem and Bellugi1976, Stungis Reference Stungis1981, Richards & Hanson Reference Richards and Hanson1985), but also produces results that match signers’ similarity ratings of fingerspelled words.