



I. INTRODUCTION
In past decades, mechanical alloying and milling were used for synthesis of various categories of nanostructured materials such as elemental powders, super saturated solutions, and amorphous compounds (Suryanarayana, Reference Suryanarayana2004). The main structural change during mechanical milling of pure metals is increase of the lattice defects. The reduction of crystallite size because of the application of mechanical energy goes along with the increase of volume fraction of grain boundaries (GBs). As a matter of fact, a noteworthy proportion of atoms is located inside or in the vicinity of GBs, triple junctions, and dislocation cells.
The augmentation of research in the field of nanomaterials and nanostructured materials caused a need for proper characterization methods. The common method for structural characterization of the mechanically milled (MM) metals is X-ray crystallography (XRD) analysis. The sample preparation is simple and the obtained characteristics are average of the entire sample. These can be empirical advantages over the powerful technique of transmission electron microscopy (TEM) (Tian and Atzmon, Reference Tian and Atzmon1999; Gubicza and Ungar, Reference Gubicza and Ungar2007). Therefore, several XRD analysis methods have been developed to calculate the crystallite size, microstrain, or dislocation density in different lattice structures.
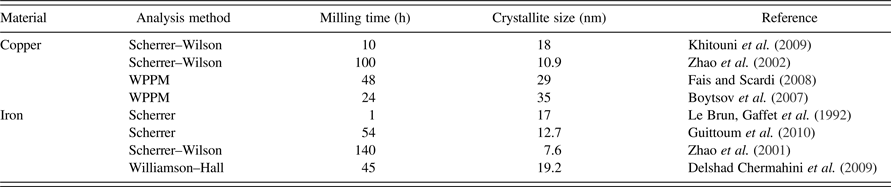
Copper (Cu) and iron (Fe) are among the most applicable engineering metals. Characteristics of nanostructural Cu and Fe powders are widely studied. However, dissimilar results are reported for MM powders. It is well established that the milling condition can affect the results, while the XRD analysis method should be considered as another possible reason of discrepancy. Some calculated crystallite sizes of the powders which were all produced by planetary ball mill are exhibited in Table I. It should be mentioned that despite the same milling apparatus, the milling energy can still be different. Nevertheless, a fraction of the observable disagreement of the literature data can be related to application of different diffraction analysis methods.
The reported crystallite sizes of Cu and Fe powders, which are calculated by various XRD analysis methods. The samples are all produced by planetary ball-mill.
On the other hand, the expansion of GB network and structural defects results in storage of a valuable amount of energy in MM metals and alloys. There have been attempts to calculate the stored energy using a combination of the results of XRD analysis and diffraction scanning calorimetry (DSC) (Zhao et al., Reference Zhao, Sheng and Lu2001; Zhao et al., Reference Zhao, Lu and Zhang2002). However, in the majority of efforts GBs were assumed as two-dimensional (2D) planes. In recent works on the analysis of the mechanically alloyed Cu alloys, a spherical (Sheibani et al., Reference Sheibani, Heshmati-Manesh and Ataie2010; Mula et al., Reference Mula, Bahmanpour, Mal, Kang, Atwater, Jian, Scattergood and Koch2012) or cubic (Aguilar et al., Reference Aguilar, Martínez, Navea, Pavez and Santander2009) shape was assumed for nanocrystallites. Therefore, the thickness and volume of boundaries were neglected, while in the case of nanostructured materials the interface volume and the proportion of triple junctions are notable parameters.
Efforts also have been made to consider the effect of boundary thickness on the interface volume fraction. A simple equation for estimation of the volume fraction of the boundaries is 3δ/D, proposed by Mütschele and Kirchheim (Reference Mütschele and Kirchheim1987) in which δ stands for the boundary thickness and D is the grain size. Later, Palumbo et al. (Reference Palumbo, Thorpe and Aust1990) proposed that the inter-crystalline fraction is equal to 1 − [(D − δ)/D]3. However, the effect of crystallites shape on the boundary volume still cannot be considered.
The aim of the present study is firstly to apply suitable XRD analysis methods for evaluating the microstructural characteristics of nanostructured Cu and Fe powders and secondly, to estimate the energy and thickness of crystallite interfaces in a three-dimensional (3D) approach. For this aim, a new geometrical model is derived for prediction of the volume fraction of interface and triple junctions in the nanostructured materials. Finally, the obtained results were combined with DSC experiments to estimate the average thickness of crystallite boundary in the nanostructural powders.
II. EXPERIMENTAL
A. Sample preparation
The nanostructured Cu and Fe powders were prepared using a planetary ball mill with hardened steel vials and balls. Each vial contained balls with diameters of 10 and 8 ml and were filled with argon gas before milling. The 99.8% purity Cu and Fe powders were subjected to 48 h of milling with the ball to powder weight ratio of 20:1 and the rotation speed of 370 RPM. Additionally, 1 wt% of Stearic acid was added to the powder mixture as lubricant. The samples are marked as Cu48 and Fe48. Finally, the contamination of Fe in the Cu powder because of milling apparatus was measured using wet chemical analysis, which was 0.4 wt%.
B. Characterization
The size and morphology of the milled powders were determined using scanning electron microscopy with secondary electron imaging. Afterward, XRD experiments were conducted at room temperature, using a PANalytical-Xpert diffractometer. Since the fluorescence of Fe powder under CuKα radiation has a detrimental effect on the quality of XRD profiles, the experiments were conducted using CoKα radiation (1.78901 Å). The 2θ step was set at 0.02° and the counting time per step was 4 s, in the range of 2θ = 40–120°. In addition to the newly milled metals, a milled Cu sample which had aged at room temperature for 9 months was also subjected to the XRD analysis (marked as sample Cu48-9).
To calculate the instrumental broadening, the Caglioti equation (Caglioti et al., Reference Caglioti, Paoletti and Ricci1958) was used:
 $${\rm FWHM}^ 2 = U\, {\rm tan}^ 2 \left(\theta \right)+ V\, {\rm tan}\left(\theta \right)+ W$$
FWHM is full width at half maximum of height of the peaks and U, V, and W are the indices which can be determined by the aid of a standard specimen. An annealed pure alumina sample was prepared as the standard sample. Afterward, the instrumental broadening and background were removed from the diffraction profiles using the software MarqX (Dong and Scardi, Reference Dong and Scardi2000), in which the background is calculated by a third-order polynomial function and the reflections are fitted using a pseudo-Voigt function. The refinement procedure is continued until a good agreement between the calculated and measured profiles is achieved. Afterward, determination of crystallite size and dislocation density was performed using the Williamson–Hall (WH) (Williamson and Hall, Reference Williamson and Hall1953), Warren–Averbach (WA) (Warren and Averbach, Reference Warren and Averbach1950), modified Williamson–Hall (MWH), modified Warren–Averbach (MWA) (Ungar and Borbely, Reference Ungar and Borbely1996), and Variance (Wilson, Reference Wilson1962; Mitra and Mukherjee, Reference Mitra and Mukherjee1981) methods. Finally, thermal analysis of the milled powders was performed in a Metler Toledo scanning calorimeter (DSC1); with a slow heating rate of 5 K min−1, up to 700°C. About 10 mg of powder was used for each run.
III. RESULTS
A. Particle size
The overall morphology of Cu and Fe powders after 48 h of milling are shown in Figures 1(a) and 1(b), respectively. The Cu powder contains flaky particles with generally uniform size, whereas the Fe particles are rather equiaxed and agglomerated. On the other hand, the diameter of the milled Cu flakes is mostly in the range of 15–30 µm; while the Fe particles show size deviation in the range of 1–10 µm. As can be seen in Figures 1(c) and 1(d), both the Cu and Fe particles are formed by cold welding of smaller particles. It is also well known that severe plastic deformation of metals results in the formation of subgrain boundaries. Therefore, each powder particle contains several cold-welded grains and each grain may contain thousands of crystallites. Therefore, since the particle size of both powders is in the micrometer scale, they should be considered as nanostructured materials not nanomaterials.
Secondary electron images showing: (a) morphology of Cu powder after 48 h of milling, (b) morphology of Fe powder after 48 h of milling, (c) typical shape of a single Cu particle, and (d) typical shape of a single Fe particle.

B. XRD analysis: crystallite size and dislocation density
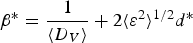
The XRD profiles of the samples are presented in Figure 2. According to the WH method, the volume-averaged crystallite size <D
V
> and lattice microstrain
 $\lt \varepsilon ^2\gt ^{1/2}$
are related via Eq. (2).
 $$\beta ^{\ast} = \displaystyle{1 \over {\langle D_V \rangle }} + 2\langle \varepsilon ^2 \rangle ^{1/2} d^{\ast}$$
In which β * is the integral breath in the reciprocal space and d * is the reciprocal lattice vector. The variation of β * versus d * for the sample Cu48 is plotted in Figure 3(a) and the resulted size and strain can be seen in Table II. However, the five data points do not have a linear trend and the parameter R 2 is just 0.54 for the fitted line. This can be caused by the effect of dislocations as a source of anisotropic strain broadening.
(Color online) The XRD profiles of Cu and Fe samples.

(Color online) The plots for the reflections of sample Cu48. (a) The WH plot. (b) The modified WH plot for edge dislocation type. (c) The modified WH plot for screw dislocation type.

The crystallite size, microstrain, and dislocation density of ball-milled Cu and Fe powders, calculated using different XRD analysis methods.
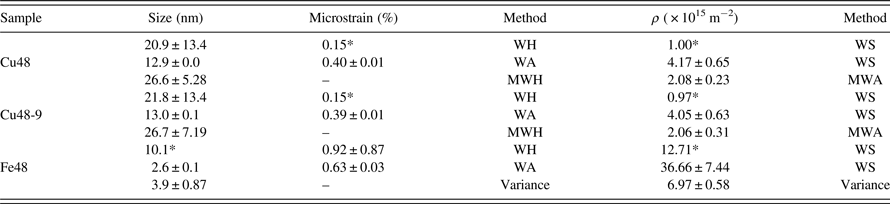
*The calculated deviation was higher than the data itself.
On the other hand, the crystallite size which results from the Scherrer equation (Langford and Wilson, Reference Langford and Wilson1978) in the <111> direction is near twice of the <311> direction. This may be interpreted as a sign of anisotropic size broadening. On the other hand, the strain anisotropy because of the formation of stacking faults in the (111) plane of face centered cubic (FCC) materials can affect the calculated crystallite size in the <111> direction. We have also calculated the crystallite size of Cu crystallites using Rietveld refinement (Mojtahedi et al., Reference Mojtahedi, Goodarzi, Aboutalebi, Ghaffari and Soleimanian2013), which were 13.5, 7.6, 9.5, and 9.6 nm for (111), (200), (220), and (311) diffractions, respectively. It should be mentioned that the crystallite size in the <200 > , <220 > , and <311> directions are not significantly different. Therefore, the difference of calculated size in the <111> direction can be caused by a combination of crystallite shape and stacking faults.
A very common method for the estimation of the dislocation density in materials science is the equation of Williamson and Smallman (WS) (Williamson and Smallman, Reference Williamson and Smallman1956):
 $$\rho =\displaystyle{{ 2\sqrt 3 \langle \varepsilon ^2 \rangle ^{1/2}} \over {D b}}$$
where b and ρ are the Burgers vector length and the dislocation density, respectively. The effect of dislocations is also considered in the modified WH method, in which Eq. (2) is adjusted to the form of Eq. (4), where A is a factor related to the outer cut-off radius of dislocations (Re) and
 $\overline C _{hkl}$
is the average dislocation contrast factor.
 $$\beta ^{\ast} = \displaystyle{{0.9} \over {\langle D_V \rangle}} + \left({\displaystyle{{\pi A^2 b^2 } \over 2}} \right)^{1/2} \rho ^{1/2} d^{\ast} \overline C _{hkl} \hskip-0.5pt^{ 1/2} + O\lpar d^{\ast} \overline C _{hkl} \rpar$$
The crystallite size can be calculated by plotting β
*
versus
 $d^{\ast} \overline C _{hkl} \hskip-0.5pt^{1/2}$
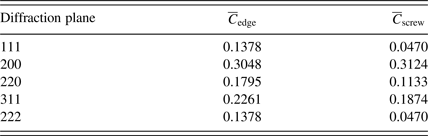
and fitting a second-order equation. For this aim, the contrast factors of the edge and screw dislocations of Cu were calculated using the program ANIZC (Borbely et al., Reference Borbély, Dragomir-Cernatescu, Ribarik and Ungar2003) (Table III). As can be seen in Figures 3(b) and 3(c), in the case of edge dislocations the variation of β
*
versus
 $d^{\ast} \overline C _{hkl}$
is irregular and the fitting quality is poor, whereas in the case of screw dislocations a second-order polynomial equation can be well fitted to the data points. This indicates that the screw dislocation type has the main fraction among dislocations in the milled Cu powder. Finally, the crystallite sizes for samples Cu48 and Cu48-9 were calculated using the intercept of the corresponding curves (Table II).
Contrast factors of the edge and screw dislocations for the diffraction planes of Cu.
The microstrain or the density of dislocations cannot be calculated via the MWH method. According to the WA method, the intensity of the diffraction peaks can be expressed via Eq. (5), in which A(L) and B(L) are the Fourier coefficients and L is the Fourier length.
 $$I\left(s \right)= K\left(s \right) \sum\nolimits_{L =- \infty }^{L = + \infty } {A\left(L \right)\cos \cos \left({2\pi Ls} \right) + B\left(L \right)\sin \sin \left({2\pi Ls} \right)}$$
On the other hand, the microstrain, the diffraction vector and the Fourier coefficient of crystallite size [A S (L)], are related to each other via Eq. (6).
 $$lnA\left(L \right)= lnA^S \left(L \right)+ 2\pi ^2 d_{hkl}^{\ast \,\;2}, L^2\lt \varepsilon ^2 \left(L \right)\gt $$
On the basis of the works of Krivoglaz (Krivoglaz and Ryaboshapka, Reference Krivoglaz and Ryaboshapka1963; Krivoglaz, Reference Krivoglaz1996) and Wilkens (Wilkens, Reference Wilkens1976), it is stated that in the case of anisotropic broadening, Eq. (6) should be modified to the following form (Ungar and Borbely, Reference Ungar and Borbely1996):
 $$\ln A\left(L \right)= \ln A^S \left(L \right)- {1/2} \rho b^2 L^2 \pi \ln \left(\displaystyle{\hbox{R}_e/L} \right)d^{\ast} 2 \overline C _{hkl} + O\lpar d^{\ast}\rpar ^4 \lpar \overline{C}_{hkl} \rpar ^2 $$
Now the dislocation density can be calculated by plotting the variations of lnA( L ) versus
 $d^{\ast \;2} \overline C _{hkl}$
for various quantities of L. The variations are plotted for the edge and screw dislocation types in Figures 4(a) and 4(b), respectively. Again the data for screw dislocations can be well fitted to a second-order equations; therefore the MWA method confirms the result of the MWH method about the principal dislocation type in the MM Cu powder.
(Color online) The variations of lnA(L) versus
 $d^{\ast} 2 \overline C _{hkl} $
for (a) edge dislocation character, (b) screw dislocation character, related to sample Cu48 for L = 1 nm to L = 10 nm.

The MWA method can be applied as a method for calculation of the dislocation density, which is more reliable than Eq. (3). For each of the assumed amounts of L in Figure 4(b), an equation in the form of A(L)x 2 + B(L)x + C = 0 can be resulted. Afterward, by plotting the variations of the term B(L)/(πb 2 L 2 /2) versus L, the dislocation density can be calculated.
The results of the WH, MWH, WA, and MWA methods for the milled Cu powders are collected in Table II. It can be seen that the WA method resulted in smaller crystallite size and higher microstrain than the WH method. As can be seen in Table II, deviation of results in the conventional WH method is too high. As previously mentioned, this inaccuracy is attributable to the application of linear fitting. The mathematical deviation becomes essentially smaller by application of the Modified form of WH plot.
The density of dislocations is calculated using the WS equation, as well as the MWA method. For this aim, the crystallite size and microstrain of Cu powders which are calculated from both of the WA and WH methods are inserted in Eq. (3). The estimated amounts of dislocation density are highly correlated to the XRD analysis method. It seems that more research is required to evaluate the precision of the results of various analysis methods for non-equilibrium nanostructured materials.
The obtained microstructural characteristics of the MM Fe powder by means of the WH and WA methods are also imbedded in Table II. There were just three reflections of (110), (200), and (211) available in the diffraction range; therefore the calculated results may not be precise enough. Consequently, to obtain the crystallite size and dislocation density of Fe, the momentum method is applied despite the MWH and MWA methods. This method can provide adequate accuracy in the case of insufficient reflections. According to the works of Wilson (Wilson, Reference Wilson1962) and Groma (Groma, Reference Groma1998), the kth-order moment of the intensity distribution I(q) can be defined as:
 $$M_k \lpar q\rpar = {{\int_{ - q}^q {q^k I\lpar q\rpar dq} } / {\int_{ - \infty }^\infty {I\lpar q\rpar dq} }}$$
In which q = 2/λ(sinθ − sinθ 0), where θ 0 is the Brags angle. The different order moments and the Fourier transform of the intensity distribution are in the following relation:
 $$M_k \lpar q\rpar = \lpar i\rpar ^k \displaystyle{1 \over {A\lpar 0\rpar }}\displaystyle{{d^k } \over {dL^k }}A\lpar L\rpar \left\vert {_{L = 0} } \right.$$
Groma has calculated the second- and fourth-order moments as Eqs (10) and (11), respectively, in which
 $ {C}_{F}$
is the crystallite size and
 $\Lambda = {\pi}/2g^2 b^2 \overline C$
(Borbély and Ungar, Reference Borbély and Ungar2012), where g is the diffraction vector. The amounts of
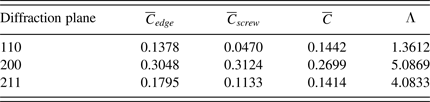
 $\overline C $
and Λ for the diffraction peaks of Fe are expressed in Table IV. It should be noted that the dislocation character is unknown; therefore the dislocations are assumed to be half-edge and half-screw (Ungar et al., Reference Ungar, Ott, Sanders, Borbély and Weertman1998a, Reference Ungar, Révész and Borbély1998b). Borbely and Groma (Reference Borbely and Groma2001) have indicated that if the crystallite size causes notable broadening, the dislocation density could not be calculated from M
2(q). In fact, evaluation of the dislocation density from M
4(q) is more accurate.
 $$M_2 \lpar q\rpar = \displaystyle{1 \over {\pi ^2 {C}_{F} }}q - \displaystyle{L \over {4\pi ^2\, K^2 {C }_{ F} {^2} }} + \displaystyle{{\Lambda \left\langle \rho \right\rangle \ln \lpar {q / {q_0 }}\rpar } \over {2\pi ^2 }}$$
 $$\displaystyle{{M_4 \lpar q\rpar } \over {q^2 }} = \displaystyle{1 \over {3\pi ^2 \varepsilon _F }}q + \displaystyle{{\Lambda \left\langle \rho \right\rangle } \over {4\pi ^2 }} + \displaystyle{{3\Lambda ^2 \left\langle {\rho ^2 } \right\rangle } \over {4\pi ^2 q^2 }}\ln ^2 \lpar {q / {q_1 }}\rpar$$
Contrast factors and the parameter LambdaΛ for the diffraction planes of Fe.
To utilize the Variance method, a pseudo-Voight function was fitted to each reflection profile. In this way, the FWHM and the fraction of Lorentzian function were obtained for each peak and then the fourth moment of each reflection was calculated. The variations of M
4(q)/q
2 versus q are plotted in Figure 5. Finally, a linear function is fitted to the first linear zone of each curve and
 ${C}_{F}$
is calculated from the slope of the lines. On the other hand, to calculate the dislocation density,
 $\overline C _{hkl}$
is calculated for each of the reflections of Fe. Afterward, the parameter of Λ is determined and Λ 〈 ρ 〉 is plotted versus Λ. The dislocation density is then calculated by a linear fit. As can be seen in Table II, the dislocation densities of Fe which are calculated using the WS method are too high, while the result of the Variance method is in a reasonable range.
(Color online) The plot of M 4 (q)/q 2 versus q for the three diffraction peaks of Fe48. The fitted line to the first linear part of (200) curve is shown as an example.

III. DISCUSSION
A. Geometrical modelling of a nanostructured material
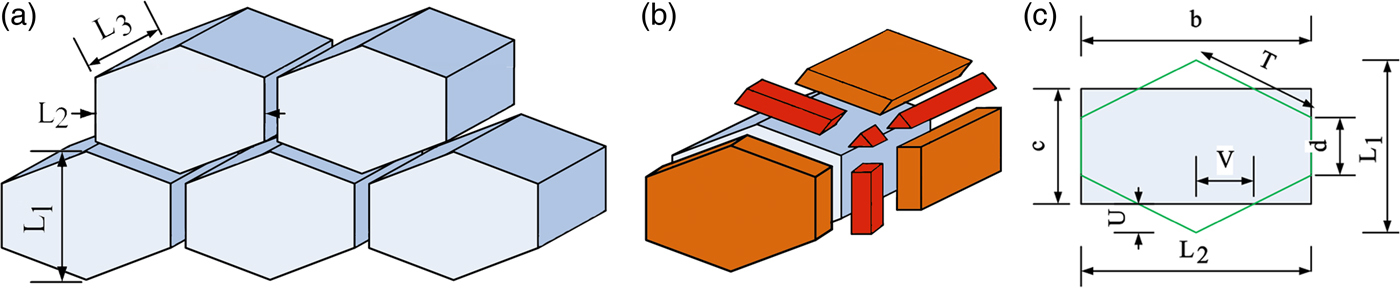
The truncated octahedral (TO) is widely applied as a representative of the 3D geometry of grains and cellular structures (Aste et al., Reference Aste, Boose and Rivier1996; Pari and Misiolek, Reference Pari and Misiolek2008). In this study, we also considered the boundaries between TO grains as 3D spaces. Schematic illustration of the crystallites and the related interface volumes are shown in Figures 6(a) and 6(b), respectively. The 2D or 3D hexagonal shapes are also used for modelling the microstructural behaviour of nanostructured materials (Yamakov et al., Reference Yamakov, Wolf, Phillpot and Gleiter2002; Shimokawa et al., Reference Shimokawa, Nakatani and Kitagawa2005). Here, 3D prisms with hexagonal base are applied, which are presented in Figure 7(a). As can be seen in Figure 7(b), the thickness of GB boundary is presented by m. Flaky and columnar crystallites will be modelled by changing the ratio of dimensions of the prism.
(Color online) (a) Schematic illustration of TO crystallites with a boundary thickness of m at the hexagonal sides, (b) four kinds of interfacial spaces.

(Color online) (a) Schematic illustration of crystallites as prism with hexagonal base, (b) the seven shapes of boundary volumes which exist in this geometry, and (c) the applied dimensions.
In the next step, it is necessary to assume a reasonable amount for the interface thickness. It is common to assume m = 0.5 nm, while the inter-crystalline disordered regions may be wider in the deformed materials. Some available data about GB width of elemental metals can be seen in Table V. It can be seen that the diffusional width is normally about 0.5 nm, while the reported structural widths show more variations. The presence of a layer with internal stress around GBs (Guo et al., Reference Guo, Xu and Li2013) can be the source of this variation. The relaxation of boundaries under low-temperature annealing of Fe powder is proved by HRTEM imaging (Jang and Atzmon, Reference Jang and Atzmon2006). It is also shown that far from equilibrium interfaces can have various thicknesses (Li et al., Reference Li, Ping, Huang, Yu and Ye2000). However, it would be possible to consider a larger average boundary width in the deformed nanostructured metals. Therefore, the boundary width of the MM metals is stated as a variable in the following calculations.
Comparison of the literature data about GB width of metals with various grain sizes and preparation methods.
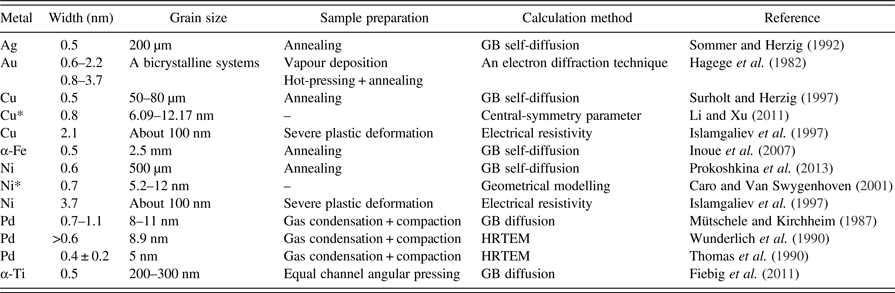
*The boundary width is result of computer simulation.
1. Truncated octahedral
The volume of a TO in Figure 6(a), with the edge length of s, is equal to:
 $$V_{\rm TO} = 8\sqrt 2 s^3$$
As is displayed in Figure 6(b), four kinds of space exist around each TO: the spaces between two square sides (six pieces), the spaces between two hexagonal sides (eight pieces), the spaces between three edges (36 pieces) which can be representative of triple junctions, and the spaces between four corners (24 pieces), which can illustrate the vortex points. To calculate the interface volume which belongs to each crystallite, the volume of each of the mentioned spaces should be multiplied to its total number around a single TO, and then to the fraction of that space which is related to each crystallite. Therefore, the relation of interface volume for each TO crystallite and the interface thickness is:
 $$V_{\rm TO}^{IS} = 2\sqrt 3\, s^2\, m + 6\sqrt 3\, s^2\, m + 3.266\sqrt 3\, m^2\, s + \sqrt 3/2 m^3 $$
The number of crystallites in one mole of milled materials can be calculated via Eq. (14), in which V m is the molar volume.
 $$n_{{\rm TO}} = \displaystyle{{V^m } \over {8\sqrt 2 \lpar s+\displaystyle{m \over {\sqrt 6 }}\rpar ^3 }}$$
Finally, the total volume of interface in one mole of material can be calculated:
 $$V_{{\rm TO}}^I = \lpar n_{\rm TO} \rpar \times \left({2\sqrt 3\, s^2\, m+6\sqrt 3\, s^2\, m + 3.266\sqrt 3\, m^2\, s + \sqrt 3/2 m^3} \right)$$
2. Hexagonal prism
As can be seen in Figure 7(a) the geometry of a prism with hexagonal base can be defined by three dimensions of L 1, L 2, and L 3. There are seven shapes of space at the interfaces of each crystallite, which are shown in Figure 7(b). Calculation of the volume of these interfacial spaces using three dimensions of L 1, L 2, and L 3 is difficult; therefore additional dimensions are define in Figure 7(c). A section of a tetragon with the same area is also shown. The transformation of the dimensions is the same as in Eqs (16).
 $$\eqalign{L_ 1 &= c + 2U\comma \; d = c - 2U = L_ 1 - 4U\comma \; V = L_ 2 /4\comma \; \cr T &= \sqrt {4\, U^2 + 4\, V^2 }} $$
The volume of a single crystallite is V P S = L 2 L 3 c. Using the same approach as the TO geometry, the interface volume, which is related to one crystallite can be calculated via Eq. (17):
 $$V_P^{\rm IS} = 2TmL_3 + dmL_3 + \displaystyle{{\sqrt 3 } \over 2}m^2\, L_3 + cmL_2 + m^2 d + 2m^2 T + \displaystyle{{\sqrt 3 } \over 2}m^3 $$
Afterward, the number of crystallites and the volume of interface can be calculated via Eqs (18) and (19), respectively:
 $$n_P = \displaystyle{{V^m } \over {V_P^S + V_P^{I\, S} }}$$
 $$\eqalign{V_{\rm TO}^I = & \lpar n_P \rpar \times \bigg(2TmL_3 + dmL_3 + \displaystyle{{\sqrt 3 } \over 2}m^2\, L_3 + cmL_2 \cr & + m^2 d + 2m^2 T + \displaystyle{{\sqrt 3 } \over 2}m^3 \bigg)}$$
As a matter of fact, the accurate volume fraction of interfaces in each geometry can be derived using the concept of Eq. (20), in which V S is the volume of one crystallite and V IS is the related interface volume.
 $$V^I = 1 - \displaystyle{{V^S } \over {V^S + V^{IS} }}$$
A comparison of this approach with the equations of Mütschele and Palumbo is plotted in Figure 8. The crystallite size (D = 6 nm) is considered as the diameter of a sphere and then, equivolume TO and prism are applied. In the case of prismatic geometry, three kinds of crystallites with equiaxed (L 2 = L 3 = a), flaky (L 2 = L 3 = b = 2c), and columnar (L 3 = c = 2b, L 2 = b) shapes are modelled. It can be seen that the interface fraction which results from the equation of Mütschele is larger. Moreover, by increasing the boundary thickness, V I increases linearly and rapidly. Reaching the limit of 3δ = D, the interface volume fraction can increase to more than 100% which has no physical meaning. On the other hand, the model of Palumbo exhibits small volume fraction when the interfaces are rather thin; but also shows a high tendency to increase with the increase of boundary thickness. However, it will rise from 100% when the crystallite size is larger than boundary thickness. The interface volume fraction which results from the approach of this study exhibits a slower increase and would not rise from 100% in any situation.
(Color online) Comparison of the GB volume fraction predicted by the equations of Mütschele and Palumbo and the geometrical models of this study. The crystallite diameter is assumed 6 nm and the equivolume shapes are used.

B. The stored energy of defects
The stored energy can be divided into the interfacial energy and strain energy of dislocations. The GB energies (γ) of Cu and Fe at room temperature are reported to be 716 and 826 mJ m−2, respectively (Zhao, Reference Zhao2006). Assuming m = 0.5 nm for relaxed boundaries, the room temperature GB energies of Cu and Fe can be calculated as 1432 × 106 and 1652 × 106 J m−3, respectively. Now the increase of interface width in non-equilibrium boundaries, will result in higher interface volume and more stored energy.
The calculated interface stored energies of the milled powders are shown in Table VI. The crystallite sizes which are resulted from the MWH method (in case of Cu) and the Variance method (in case of Fe) are used as the finest approximations. For all of the prismatic shapes, U is assumed as 0.25c. Moreover, the average interface thickness in the nanocrystalline milled powders is assumed as 0.8 nm.
The calculated dislocation and interface energy of nanostructured Cu and Fe powders in various geometries, besides the released energy during DSC.

The dislocation energy for one mole of material can be calculated via Eq. (21), in which E D is the dislocation energy for unit length of dislocation line. E D can be calculated via Eq. (22) (Hull and Bacon, Reference Hull and Bacon2001), in which G is the shear modulus, R e and r o are the outer and inner radiuses of the dislocation strain field and α is equal to 1/4π for screw and 1/4π (1 − υ) for edge dislocations. υ is the Poisson's ratio.
 $$E_{{\rm dis}} = \rho E_D V^m $$
 $$E_D = \alpha Gb^2 \ln \lpar {{R_e } / {r_0 }}\rpar $$
Here, the internal radius is assumed to be equal to the Burgers vector and the external radius is assumed as half of the minimum distance between two dislocations. It is stated that the least distance between two edge dislocations can be calculated via Eq. (23) (Nieh and Wadsworth, Reference Nieh and Wadsworth1991), where h is hardness:
 $$L_{\min } = \displaystyle{{3Gb} \over {\pi \lpar 1 - \upsilon \rpar h}}$$
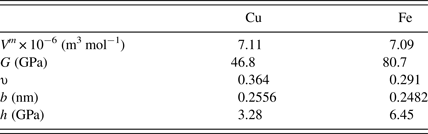
Using the material parameters in Table VII, the minimum distance between dislocations in Cu and Fe is calculated to be equal to 5.6 and 4.2 nm, respectively. On the other hand, the dislocation densities form the MWA method (in case of Cu) and the Variance method (in case of Fe) are applied.
The applied physical properties of Cu and Fe (Zhao et al., Reference Zhao, Sheng and Lu2001; Zhao et al., Reference Zhao, Lu and Zhang2002; Mohamed, Reference Mohamed2003).
As can be seen in Table VI, the main element in the stored energy is the proportion of interfaces. This result is in agreement with the works of Oleszak (Oleszak and Shingu, Reference Oleszak and Shingu1996) and Zhao et al. (Zhao et al., Reference Zhao, Sheng and Lu2001; Zhao et al., Reference Zhao, Lu and Zhang2002) on the ball-milled metals. Usage of various crystallite shapes changed the calculated interface energy about 10%. However, the main geometrical parameter, which affects the stored energy is the thickness of interface. For example, increase of m from 0.5 to 1.5 nm results in growth of the interface energy of Cu48 from 626 to 1733 J mol−1.
C. Estimation of the interface width of Cu
The crystallite size of milled Fe is drastically smaller than Cu. Therefore, the calculated stored energy in nanocrystalline Fe is superior. It may be concluded that the released energy during DSC annealing of Fe powder should be higher than Cu. But as can be seen in Table VI, Δ H DSC shows a reverse trend. On the other hand, the crystallite sizes of Cu48 and Cu48-9 are nearly the same, but the released energy of the sample Cu48 is about five times higher than that of Cu48-9.
The DSC curves of samples Cu48 and Cu48-9 can be seen in Figure 9. In the newly milled Cu sample, energy is released between 150 and 340°C via two connected broad peaks, while the first peak is disappeared in the aged powder. It can be concluded that the first exothermic peak was because of the recovery of far from equilibrium boundaries and this recovery was conducted during room temperature ageing. Fecht et al. (Reference Fecht, Hellstern, Fu and Johnson1990) claimed that the boundary energy of ball milled metals is larger than the energy of fully equilibrated GBs. Here, the difference between the released energy of samples Cu48 and Cu48-9 is 891 J mol−1, which can be considers as excess interface enthalpy. Therefore, this energy should be added to the calculated energies of Table VI. The increased interfacial enthalpy can be seen in Table VIII.
(Color online) The DSC scans for copper powder after 48 h of milling (Cu48) and subsequent room temperature ageing for 9 months (Cu48-9).

The total stored interface energy and the calculated energy and thickness of interface, in case of MM copper.
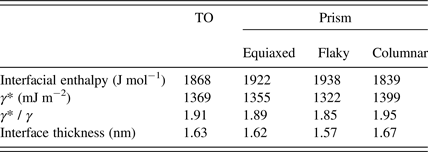
Using the presented geometrical model, the increased GB energy (γ *) of the milled powder can be calculated indirectly. As an example, the stored interface energy of sample Cu48 in TO geometry is calculated as 1868 J mol−1. Using an assumed boundary thickness of 0.8 nm, γ* of milled Cu can be calculated as 1369 mJ m−2. As can be seen in Table VIII, the GB energy increased about 1.9 times during mechanical milling. Assuming the GB energy of Cu as 613 mJ m−2, the proportion of γ* / γ for Cu after 15% deformation and recrystallization at 600°C is measured to be about 1.6 (Grabski and Korski, Reference Grabski and Korski1970). This is slightly smaller than the result of this study, which was predictable because the milled powder is not submitted to any thermal process.
On the other hand, the variation of energy in a constant crystallite size can be due to the difference in the thickness of GB. In this way, the thickness of the developed interface region of MM Cu is calculated about 1.6 nm (Table VIII). Further relaxation is possible in longer ageing times. Therefore these amounts should be considered as a minimum quantity for the energy and the thickness of the far from equilibrium boundaries of the ball-milled Cu.
V. CONCLUSION
The crystallite size and dislocation density of the Cu and Fe powders were determined via conventional and advanced XRD analysis methods. The results of WH, MWH, WA, and MWA methods are compared in the case of nanocrystalline Cu powder. The density of dislocations is also calculated via method of WS, besides the modified WA approach. It is clarified that the main dislocation type in the MM Cu powder is screw. In case of nanocrystalline Fe powder, the results of WH, WA, and WS methods are compared to the Variance method.
On the other hand, a geometrical approach is offered for calculation of the inter-crystalline volume using the obtained crystallite sizes. Crystallites with equiaxed, flaky, and columnar shapes are considered. The interface volume fraction is calculated via the expression 1 − V S /(V S + V IS ), in which V S is the volume of each crystallite and V IS the connected interface volume. The specified equations were stated for TO and prism with the hexagonal base. The assumption of various crystallite shapes changed the calculated stored energy almost 10%, while the main geometrical parameter was the GB thickness. The thickness is studied by application of differential scanning calorimetry on room temperature aged Cu powder. It is calculated that the thickness of GB is about 1.6 nm, whereas the interface energy is increased 1.9 times than equilibrium amount.
ACKNOWLEDGEMENT
The corresponding author thanks Dr. Amin Jafari Ramiani for his invaluable help during this research.



