Introduction
Pigeonpea (Cajanus cajan (L.) Millspaugh) ranks fifth in importance among legume crops (FAO, 2006) and is cultivated in the dry lands of South Asia, Africa and Latin America. Its seeds are rich in protein and form an important component of the vegetarian diet in South Asia. The crop also enriches soil nitrogen and provides animal fodder and fuel wood. Much progress has been made in developing pigeonpea lines with tolerance to biotic and abiotic stresses through conventional plant breeding and improved management practices. However, yields of pigeonpea in the farmer's fields have remained stagnant over the past four decades, largely due to insect pest damage – Helicoverpa armigera (Hubner) being one of the most important yield-reducing factors (Green et al., Reference Green, Stevenson, Simmonds and Sharma2002).
In the past, phenological and morphological characters have been used for the assessment of diversity among cultivated pigeonpea and their wild relatives. The advent of environmentally neutral molecular markers has allowed better quantification of genetic diversity (Clegg et al., Reference Clegg, Brown and Whitefield1984; Gepts, Reference Gepts, Hodgkin, Brown, Van Hintum and Morales1995). These technologies include restriction fragment length polymorphisms (RFLP; Botstein and White, Reference Botstein, White, Skolnick and Davis1980; Rafalski and Vogel, Reference Rafalski and Vogel1996), random amplified polymorphic DNA markers (RAPD; Bowcock, Reference Bowcock1994), amplified fragmented length polymorphisms (AFLP; Zabeau and Vos, Reference Zabeau and Vos1993) and simple sequence repeats or microsatellites (SSRs; Tautz, Reference Tautz1989). RFLPs have been used to characterize the genetic diversity among some cultivated crop species and their wild relatives (Beckmann and Soller, Reference Beckmann and Soller1983; Wang and Tanksley, Reference Wang and Tanksley1992; Sivaramakrishnan et al., Reference Sivaramakrishnan, Seetha, Kamala, Reddy, Rai, Reddy, Saxena and Paula2001, Reference Sivaramakrishnan, Kannan and Reddy2002). SSRs or microsatellites are highly polymorphic and are turning out to be the marker of choice in both animal and plant species (Condit and Hubell, Reference Condit and Hubell1991; Akkaya et al., Reference Akkaya, Bhagwat and Cregan1992; Morgante and Oliveri, Reference Morgante and Oliveri1993).
Among the 271 accessions belonging to 47 wild species of Cajanus, available in the collection maintained at Rajendra S Paroda Genebank at ICRISAT, Cajanus scarabaeoides is the most widely distributed. C. scarabaeoides can be easily crossed with cultivated pigeonpea and thus any of its useful genes can be utilized for the improvement of the latter. Cajanus sericeus and Cajanus reticulatus also posses certain useful genes that can be used in the genetic improvement of cultivated pigeonpea (Remanandan, Reference Remanandan, Nene, Hall and Sheila1988). Van der Maesen (Reference Van der Maesen1986, Reference Van der Maesen, Nene, Hall and Sheila1990) produced a morpho-taxonomical description of the species but there are no published reports on the variation within the species for economic traits and only limited assessments at the molecular level (Nadimpalli et al., Reference Nadimpalli, Jarret, Phatak and Kochert1993; Ratnaparkhe et al., Reference Ratnaparkhe, Gupta, VenMurthy and Ranjekar1995; Sivaramakrishnan et al., Reference Sivaramakrishnan, Seetha, Kamala, Reddy, Rai, Reddy, Saxena and Paula2001, Reference Sivaramakrishnan, Kannan and Reddy2002). The present study aimed to assess the intraspecific diversity at molecular level between C. scarabaeoides accessions using different molecular markers. In addition, the interspecific variation among the four species (C. scarabaeoides, C. sericeus, C. reticulatus and C. cajan) was assessed using RFLP of mtDNA, AFLP and SSR markers.
Materials and methods
Plant material and DNA extraction
The 42 accessions used included 31 C. scarabaeoides from six countries (India, Sri Lanka, Australia, Philippines, Indonesia and Myanmar), four C. sericeus from India and Australia, one C. reticulatus from Australia and six C. cajan (Table 1). The two other wild species were included to sample interspecific variation among wild species. There are only four accessions each of C. sericeus and C. reticulatus in the ICRISAT genebank. Although all four accessions of each species were included, repeated attempts to extract DNA from three of the C. reticulatus accessions failed. The six pigeonpea accessions are high-yielding cultivars, but are susceptible to pod borer. Plants were grown in the glass house and DNA was extracted with the CTAB method (Murray and Thompson, Reference Murray and Thompson1980) from 5 g of young leaf collected from ten 1-month-old plants per accession.
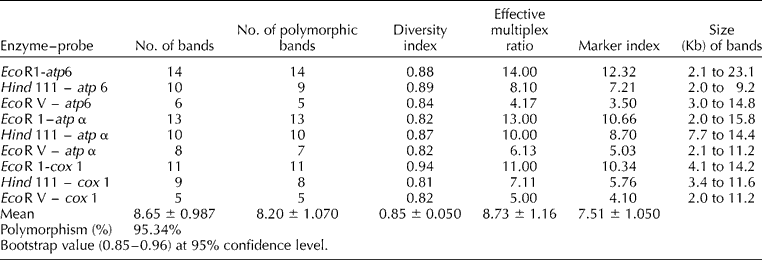
Polymorphism and range for band size in wild and cultivated pigeonpea genotypes with maize mt probes

Molecular marker diversity
Molecular marker diversity was assessed among the wild and cultivated pigeonpea using AFLPs, SSRs and RFLP.
RFLP analysis
About 15 μg DNA was digested with three restriction enzymes (EcoRI, HindIII and EcoRV; Amersham Pharmacia, Newcastle upon Tyne, UK), as per the manufacturer's protocols. Probes (the maize mitochondrial sequence atp 6 (Dewey et al., Reference Dewey, Levings and Timothy1985), cox I and atp α (Isaac et al., Reference Isaac, Jones and Leaver1985) were 32P labelled by random priming (Feinburg and Vogelstein, Reference Feinburg and Vogelstein1983), and the RFLP procedure followed Sivaramakrishnan et al. (Reference Sivaramakrishnan, Seetha, Kamala, Reddy, Rai, Reddy, Saxena and Paula2001).
AFLP analysis
AFLP analysis was carried out using a commercial kit (Life Technologies, Gaithersburg, MD, USA) following the manufacturer's protocols. Three EcoRI (+3) and three MseI (+3) primers were used in five combinations.
SSR analysis
Ten SSR primer pairs (Burns et al., Reference Burns, Edwards, Newbury, Ford-Lloyd and Baggot2001) were used for genotyping. Each 25 μl reaction contained 25 ng of genomic DNA, 1 × PCR buffer (50 mM KCl, 20 mM Tris–HCl (pH 8.4)), 10 pmol of each primer, 2 mM MgCl2, 200 nM dNTP, 50 μM dATP and 1U Taq DNA polymerase (Amersham Pharmacia). For labelling the PCR amplification products, 10 pmol of forward primer was radiolabelled by adding 1 μCi of [α32 P]-dATP to the reaction mix. The PCR programme was 94°C for 5 min, followed by 30 cycles of 94°C for 60 s, 55°C for 50 s, 72°C for 50 s, and ending with an extension step of 72°C for 5 min. PCR products were electrophoresed on a 6% denaturing polyacrylamide gel at 1500 V for 2 h.
Statistical analysis
For each accession, scoring for AFLP data was carried out according to Pangaluri et al. (Reference Pangaluri, Janaiah, Govil, Kumar and Sharma2006), RFLP data according to Sivaramakrishnan et al. (Reference Sivaramakrishnan, Kannan and Reddy2002) and SSR data according to Odeny et al. (Reference Odeny, Jayashree, Ferguson, Hoisington, Crouch and Gebhardt2007). The data were analysed using NTSYS-Pc version 2.1 (Rohlf, Reference Rohlf1997). Allele sharing (Ps; Bowcock, Reference Bowcock1994) or the proportion of alleles shared between two accessions averaged over the loci was used as measure of similarity for all marker types. This corresponds to the simple matching coefficient (Sokal and Micherner, Reference Sokal and Micherner1958) for the dominant marker (AFLP) and the Dice indices or Nei and Li coefficient (Nei and Li, Reference Nei and Li1979) for co-dominant markers (RFLP and SSR).
The distance matrix D generated using the genetic distance between individuals (u,v) was subjected to sequential agglomerative hierarchical cluster analysis using unweighted pair group method arithmetic average (UPGMA) (Rohlf, Reference Rohlf1997) and the relationship between accessions was visualized as dendrograms. Differences between the dendrograms were tested by generating co-phenetic values for each dendrogram and the assembly of the co-phenetic matrix for each marker type. The Mantel correspondence test (Mantel, Reference Mantel1967) was used to compare the similarity matrices and the degree of congruence for each marker type. Gene diversity (Hj; Anderson et al., Reference Anderson, Churchill, Autrique, Sollers and Tanskley1993), expected heterozygosity (Nei and Li, Reference Nei and Li1973) and the marker index (Powell et al., Reference Powell, Morgante, Andre, Hanafey, Vogel, Tingey and Rafalski1996) were calculated. The effective multiplex ratio (EMR = n pβ), where n p is the number of polymorphic loci in the germplasm and β (n p/(n p+n np)) is the polymorphic fraction, was calculated. A principal coordinate analysis (PCoA) was carried out on the distance matrix and the distance matrix D to visualize the genetic interrelationships among the accessions in two-dimensional PCoA plots, with the resultant scores for the samples on the first two components plotted pairwise for each marker type. Multidimensional scaling (MDS) plots were constructed on the distance matrix D and the stress values (s) calculated.
Results
Molecular marker diversity
In the RFLP studies, each combination, except Eco RV – atp α and Eco RV – cox 1, was able to uniquely fingerprint all the 42 accessions. The former two combinations could not distinguish the accessions of C. reticulatus from C. sericeus. The Eco R1 – atp 6 combination generated a maximum number of 14 hybridization bands ranging from 2.1 to 23.1 Kb and Eco RV-cox 1 combination was least polymorphic yielding only five bands (2–11.2 Kb), respectively (Table 1). Number of unique banding patterns/haplotypes ranged from 8 in Eco RV – atp α to 10 in Hind III – atp 6 combination. Eco RV – atp 6, Hind III – atp 6 and Hind III – cox 1 were the three combinations in which none of the 6, 10 and 9 patterns generated and were shared between any of the genotypes (Table S2). Details of EMR, MI and Hav as revealed from RFLP studies are given in Table 1. Pairwise similarities (Sij) among the C. scarabaeoides accessions ranged from 0.52 to 1.00 with an average of 0.71 ± 0.21.
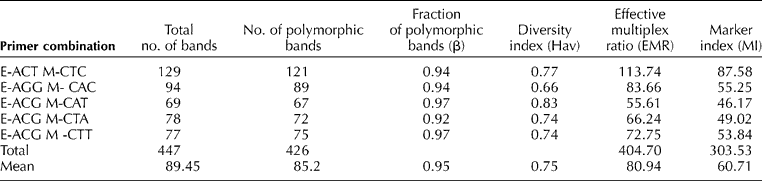
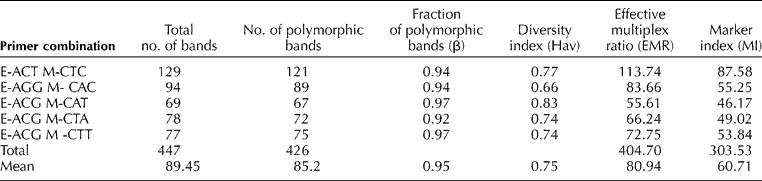
In the AFLP analysis, a total of 447 scorable bands with five primer pairs were detected across 42 accessions. Table 2 gives details of the EMR, HI and Hav. Pairwise similarity coefficient (Sij) for all the 42 accessions ranged from 0.24 to 1.00 with an average of 0.51 ± 0.26.
Polymorphism and gene diversity in wild and cultivated pigeonpea as revealed AFLP markers
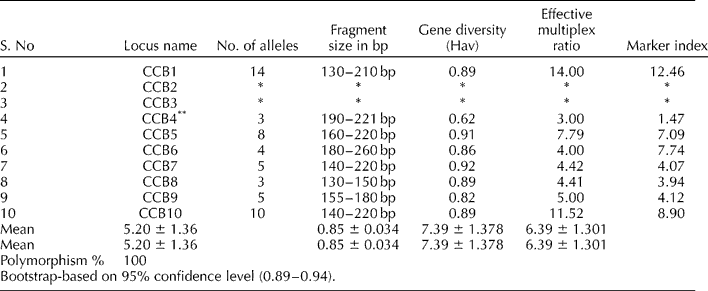
Ten SSR primer pairs were used to study the diversity, of which only eight primer pairs amplified the alleles in all the accessions. Higher polymorphism was observed among the C. cajan genotypes where all the eight primer pairs amplified the alleles, while among the wild species only seven out of the eight amplified the alleles. A total of 52 alleles were detected with an average allelic richness of 6.5 alleles per locus (Table 3). The number of alleles ranged from 3 for CCB4 to 14 for CCB1. Gene diversity was generally high, ranging from 0.62 to 0.92. When classified at the species level, the gene diversity was the highest for C. cajan (0.80) followed by C. scarabaeoides (0.71), C. sericeus (0.68) and C. reticulatus (0.41). Primer pairs CCB4 amplified only in C. cajan (3 alleles) and failed to amplify in all other species. Table 3 gives details of EMI, MI and Hav.
Polymorphism and gene diversity in wild and cultivated pigeonpea as revealed by SSR markers
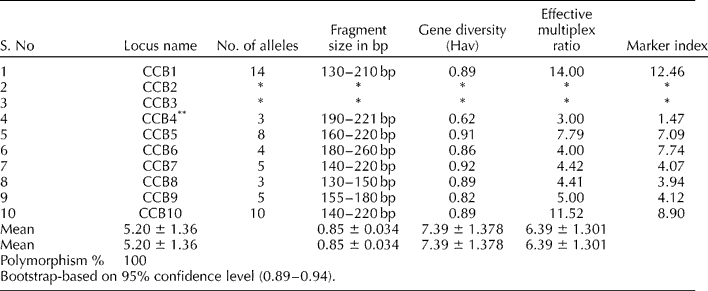
* No amplification.
** Amplified only in Cajanus cajan accessions.
Among the three markers, 100% polymorphism was observed for SSR markers, followed by 95.4% of AFLPs and 95.3% of RFLPs, but the highest effective multiplex ratio of 80.94 and marker index value of 60.71 were observed for AFLPs but diversity index was maximum for SSRs (0.89; Table S3).
Interrelationships among accessions
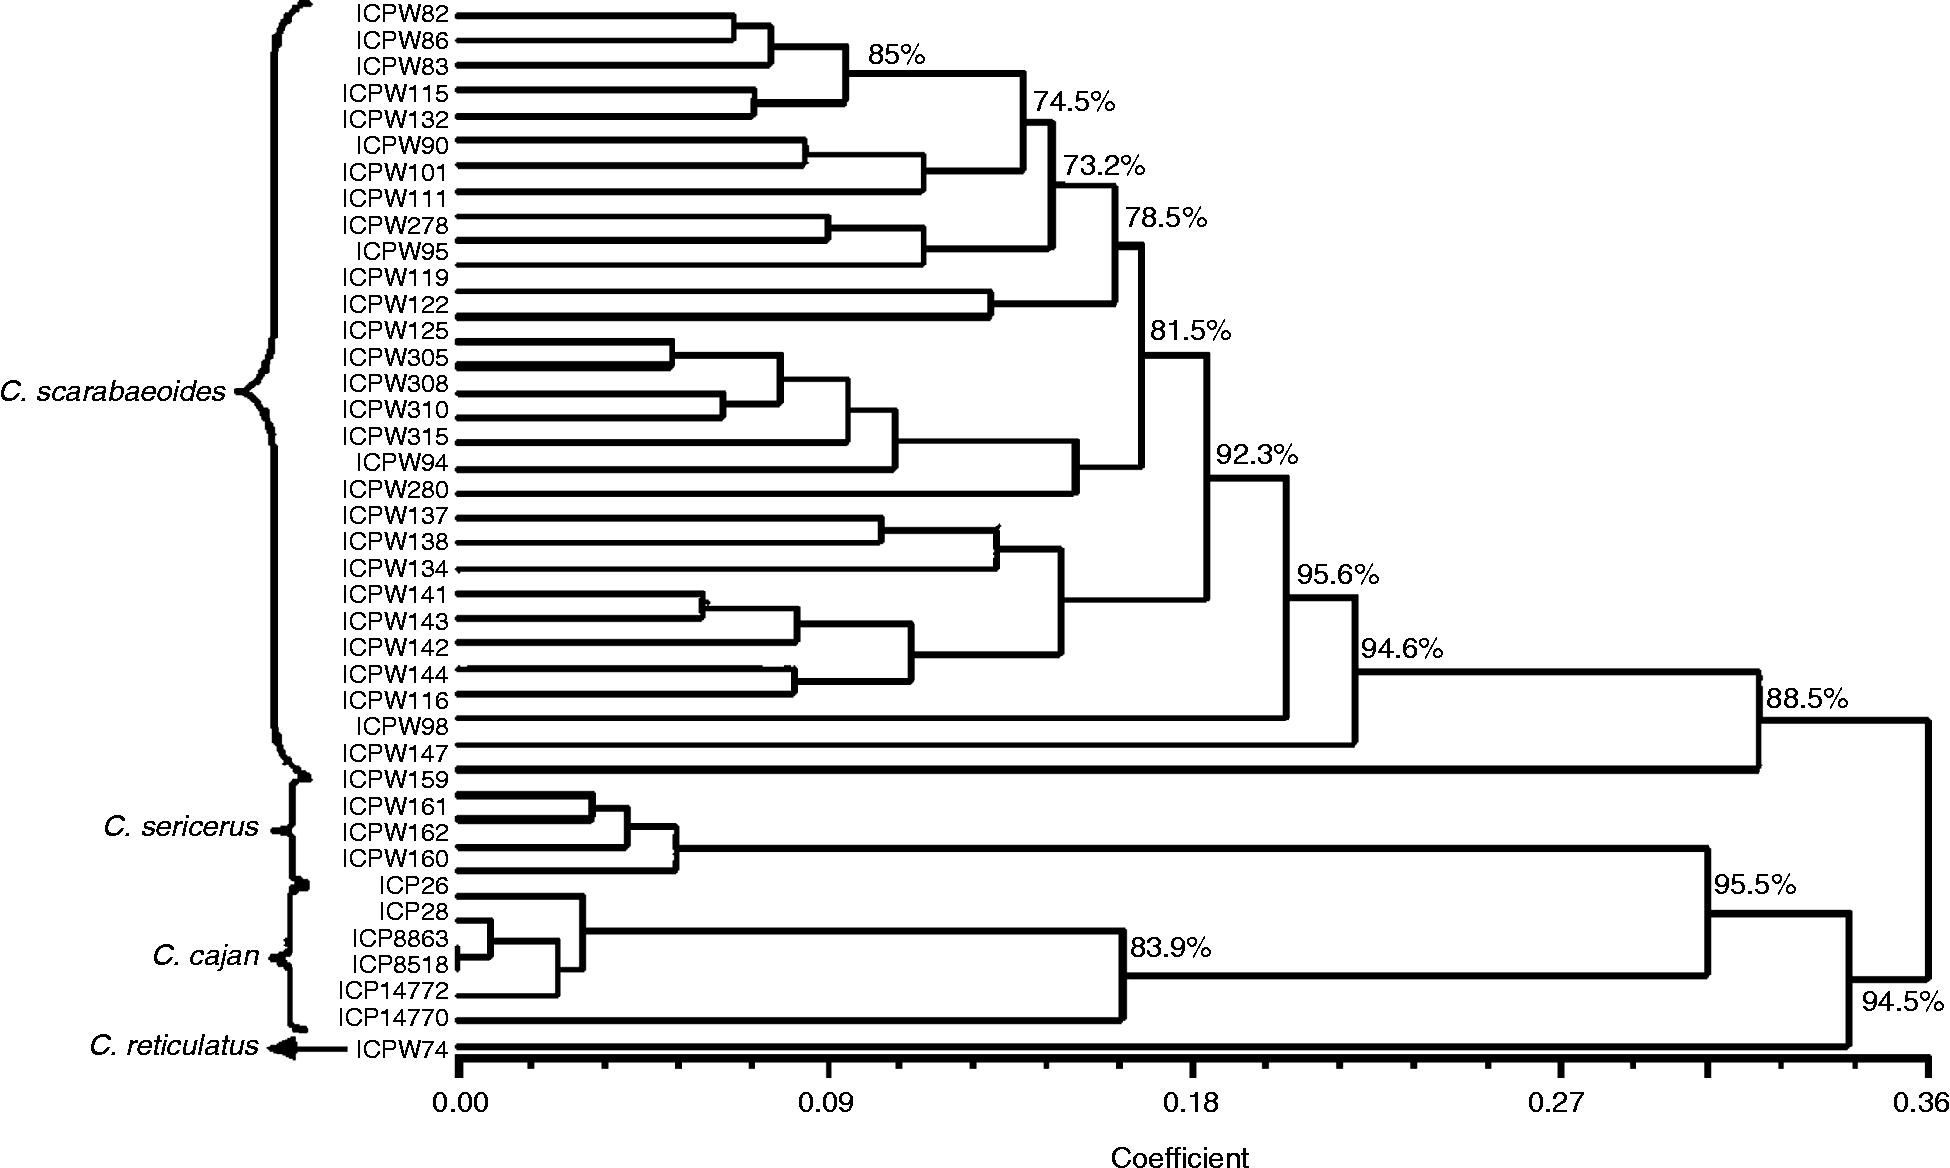
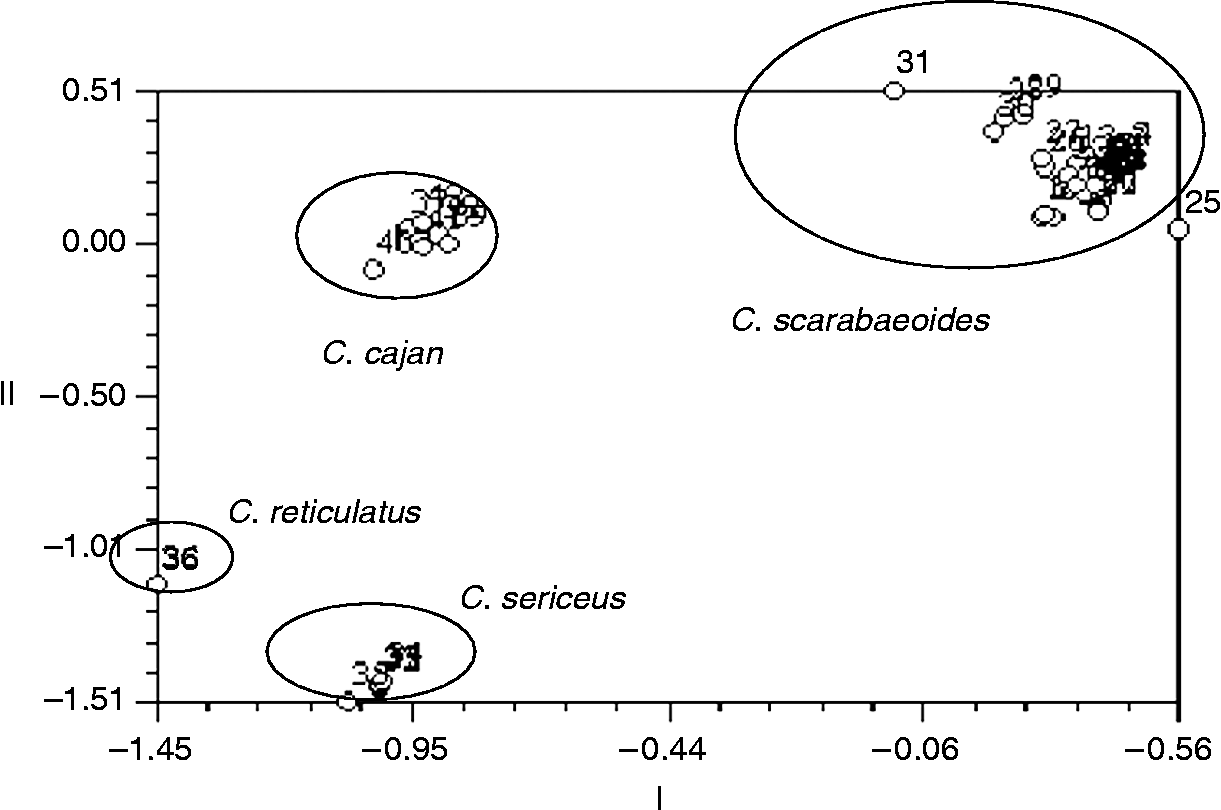
UPGMA dendrogram of wild and cultivated pigeonpea accessions for the combined data from RFLP, SSR and AFLP markers is given in Fig. 1. Thirty one accessions of C. scarabaeoides formed one cluster. These accessions further sub-clustered based on the geographical regions, India, Sri Lanka, Australia, and Myanmar and Indonesia. Mantel's test confirmed the congruence between the AFLP, RFLP and SSR genetic distances with stress (s) values of 0.91, 0.86 and 0. 89, respectively. PCoA and MDS analysis grouped the different accessions according to species and subgrouped them based on the different geographical regions. C. scarabaeoides accessions of Indian origin (both early and medium duration flowering) formed one group, separate from those originating from Sri Lanka, Australia, Indonesia and Philippines. All accessions of C. scarabaeoides originating from Sri Lanka were grouped together and those from Australia were in a different cluster. C. sericeus, C. reticulatus and C. cajan formed three different groups with no specific sub-clusters. C. sericeus accessions clustered into two different groups, one subgroup of Indian origin and the other of Australian origin. C. reticulatus was placed between C. cajan and C. sericeus (Fig. 2).
UPGMA dendrogram of wild and cultivated pigeonpea accessions for combined data from three markers (AFLP, SSR and RFLP).

Principal coordinate analysis plot based on the data from the three (SSR, AFLP and RFLP) markers. (Accessions list according to the Table 1).

Discussion
Molecular marker diversity
Marker diversity assessment using RFLP markers
The strong hybridization signals obtained with three maize mitochondrial DNA probes in all the 42 accessions reflect high homology between the maize and pigeonpea mitochondrial DNA. Different sizes of bands were obtained with all the three multi-copy probes. Different relative intensities observed in some bands of Eco R1 – atp α and Eco R1 – atp 6 combination suggest variation in the copy number of these genes. Sivaramakrishnan (Reference Sivaramakrishnan1999) and Sivaramakrishnan et al. (Reference Sivaramakrishnan, Seetha, Kamala, Reddy, Rai, Reddy, Saxena and Paula2001, Reference Sivaramakrishnan, Kannan and Reddy2002) in the assessment of genetic diversity with mitochondrial DNA probes among six wild Cajanus species observed similar results. Organelle genomes, such as mitochondrial genomes, were supposed to detect interspecific variations more efficiently than the intraspecific variations (Ennos et al., Reference Ennos, Sinclair, Hu, Langdon, Hollingsworth, Bateman and Gornall1999). However, in the present study apart from the interspecific variation, the intraspecific variation was also detected efficiently as exemplified in C. scarabaeoides. Use of maize mtDNA probes for diversity analysis among the cultivated and wild accessions suggests the conserved nature of mitochondrial genome between cereals and legumes (Sivaramakrishnan et al., Reference Sivaramakrishnan, Seetha, Kamala, Reddy, Rai, Reddy, Saxena and Paula2001).
Marker diversity assessment using AFLP markers
AFLP studies revealed higher levels of polymorphism among the wild accessions, C. scarabaeoides, C. sericeus and C. reticulatus (97%) compared with the cultivated genotypes of C. cajan (27%). Lower levels of polymorphism in cultivated pigeonpea revealed by AFLP markers in the present study is in contrast with the high levels of polymorphism observed using AFLP markers in the cultivated species of barley, maize and pearl millet (Cervera et al., Reference Cervera, Canbezas, Sancha, Martinez de Toda and Martinez Zapater1998; Law et al., Reference Law, Domini, Koebner and Reeves1998; Breyne et al., Reference Breyne, Rombaut, VanGysel and Gerats1999). In this study, the AFLP marker data revealed higher levels of genetic variation among the C. scarabaeoides accessions. Interestingly, the AFLP analysis indicated that accessions from different geographical locations with similar morphological characters such as days to flowering (Table S1) tend to cluster based upon their profiles, supporting the phenological classification of these accessions. One of the accessions, ICPW 147 (C. scarabaeoides, India), showed very unique AFLP banding pattern in all the primer combinations, and grouped separately from the other Indian accessions. Aruna et al., (Reference Aruna, Manohar Rao, Reddy, Upadhyaya and Sharma2005) reported that this accession has a unique mechanism (a combination of both antibiosis and antixenosis) of resistance to legume pod borer. Hence, the usefulness of AFLP marker in revealing the unique features of certain genotypes is particularly noteworthy and will be of immense use to pigeonpea breeders. The separation of C. reticulatus species from other wild species is in agreement with the fact that this wild species has distinct morphological and phenological characteristics distinct from other wild studied in the present investigation.
Molecular marker diversity using SSR markers
Seven out of ten microsatellites have amplified alleles in all accessions, of wild and cultivated, while two of the remaining three (CCB 2 and CCB 3) did not amplify alleles in any accessions, whereas CCB 4 amplified alleles in the cultivated genotypes. This might be because the microsatellites in Cajanus were designed based on the genome of cultivated accessions (Burns et al., Reference Burns, Edwards, Newbury, Ford-Lloyd and Baggot2001). Though the SSR markers were limited in number, they were highly polymorphic and revealed maximum diversity index in bringing out the diversity among accessions. High diversity index obtained with SSRs is consistent with their known characteristics, that they are more variable, and provide higher resolution and higher expected heterozygosity that RFLPs, RAPDs or AFLPs (Powell et al., Reference Powell, Morgante, Andre, Hanafey, Vogel, Tingey and Rafalski1996; Taramino and Tingey, Reference Taramino and Tingey1996; Pejic et al., Reference Pejic, Ajmone-Marsan, Morgante, Kozumplick, Castiglioni, Taramino and Motto1998).
High levels of polymorphism associated with SSRs are expected because of the unique mechanism responsible for generating SSR allelic diversity by replication slippage (Tautz and Renz, Reference Tautz and Renz1984) rather than by simple mutations or insertions/deletions. Some SSR primer pairs (CCB 5 and CCB6) revealed higher levels of polymorphism within the cultivated types than the wild genotypes. The possibility of using SSR markers developed for one species in genetic evaluation of other species greatly reduces the cost of analysis (Moretzsohn et al., Reference Moretzsohn, Hopkins, Mitchell, Kresovich, Valls and Ferreira2004). SSR markers convincingly brought out differences between the early, medium and late flowering C. scarabaeoides accessions (Table S1) of Indian origin, further confirming the congruence with morphological/phenological grouping (Aruna et al., Reference Aruna, Reddy, Chandra and Bramel2004).
Comparison of the three molecular markers used in diversity analysis
This study clearly demonstrated that all the three marker types could be used for studying diversity among the wild and cultivated pigeonpea. All three marker types yielded highly polymorphic bands. Similar results were observed in wild and cultivated Sorghum (Sorghum bicolor L.) species (Kamala, Reference Kamala2003), where the levels of polymorphisms ranged from 60% for AFLPs, 80% for RFLPs and 100% for SSRs.
RFLP markers were found to be more efficient in bringing out the variation among the wild and cultivated species of pigeonpea in contrast to AFLPs, which could differentiate between wild accessions more efficiently. Although, AFLPs do not offer high levels of polymorphism, they have the capacity to reveal many polymorphic bands in a single lane. This is also consistent with the findings of other studies (Powell et al., Reference Powell, Morgante, Andre, Hanafey, Vogel, Tingey and Rafalski1996; Russell et al., Reference Russell, Fuller, Young, Thomas, Taramino, Macaulay, Waugh and Powell1997; Pejic et al., Reference Pejic, Ajmone-Marsan, Morgante, Kozumplick, Castiglioni, Taramino and Motto1998) and probably reflects two major differences between the genetic markers. First, as typically dominant markers, AFLPs ordinarily detect only two alleles per locus, which reduces the maximum possible levels of heterozygosity possible to 0.5. Second, SSR regions are well known to exhibit much higher levels of mutation than other parts of the genome (Jarne and Lagoda, Reference Jarne and Lagoda1996; Goldstein and Schlotterer, Reference Goldstein and Schlotterer1999).
The three molecular markers revealed closer proximity of C. cajan with C. sericeus and C. scarabaeoides compared with that of C. reticulatus (originated from Australia). In earlier studies of RFLP analysis of ribosomal DNA, Parani et al. (Reference Parani, Lakshmi, Senthilkumar and Parid2000) had demonstrated that C. reticulatus was closer (95% similarity) to C. platycarpus (present in the tertiary gene pool) than to C. scarabaeoides (belonging to the primary gene pool). A close genetic relationship between these two species (C. scarabaeoides and C. cajan) has also been reported earlier by seed electrophoresis (Krishna and Reddy, Reference Krishna and Reddy1982; Kollipara et al., Reference Kollipara, Singh and Hymowitz1994). The present study also revealed closer relationship between C. cajan and C. scarabaeoides, which was also observed from the morpho-cytological, electrophoretic and molecular data (Pundir and Singh, Reference Pundir and Singh1985a; Nadimpalli et al., Reference Nadimpalli, Jarret, Phatak and Kochert1993; Ratnaparkhe et al., Reference Ratnaparkhe, Gupta, VenMurthy and Ranjekar1995). C. scarabaeoides is the most widely distributed wild species among all species of Cajanus, it has many important features like resistance to multiple disease and pest, high-protein content (Saxena et al., Reference Saxena, Singh, Reddy, Singh, Lateef, Sharma and Remanandam1990) and its hybrids with C. cajan are highly fertile with normal meiosis (Pundir and Singh, Reference Pundir and Singh1985b; Van der Maesen, Reference Van der Maesen, Nene, Hall and Sheila1990).
The results of this study have added further information about the intra- and interspecific variation among the different Cajanus species that would be very useful to the plant breeders in exploiting the wild germplasm. This information can be used in breeding programmes and for the conservation and management of genetic resources. Despite the small number of SSR loci used in this study, the general congruence between the AFLP, RFLP and SSR datasets and their broad agreement with the morphological groups suggest that either molecular marker method or a combination of both is applicable to the expanded studies in the wild germplasm of Cajanus. The results obtained in the present study can be used to design breeding strategies to expand the genetic base of pigeonpea. However, a detailed study with more numbers of molecular markers (especially SSRs) conducted with a larger set of genotypes can be further useful to make better conclusions. The study of intraspecific variation with a larger dataset will help breeders exploit the diversity available particularly with in C. scarabaeoides genotypes. This is first study where intraspecific variation has been studied with multiple markers and hence the study can be further improved a lot to provide useful material for the breeders. Furthermore, if collections are available in genebanks from different parts of the world, they also should be included in such study for better conclusions. The results of this study, together with results of other morphological-, biochemical- and resistance-related characters might help in the selection of the most diverse parents for pod borer resistance-related characters and greatly expand genetic variation pigeonpea improvement.
Acknowledgements
The first author expresses her gratitude to the APNL – Biotechnology unit for providing fellowship, Department for international Development for funds and ICRISAT for the infrastructure facilities. We gratefully acknowledge the valuable comments on the manuscript by Dr S. N. Nigam. We acknowledge the able valuable guidance by Ms K Seetha in laboratory, Mr Hari in statistical analysis and technical assistance of Mr Narsi Reddy and Mr R. Luke.