Background
The keyword in the title is ‘successfully’ – partially defined as getting cows pregnant when the farmer wants them pregnant, i.e. voluntarily, not because he could not get them pregnant at any other time. The other part of the definition refers to the appropriate use of genetic potential. A bull can successfully inseminate cows but there are few on-farm bulls available with the desired genes, and many adult bulls can be dangerous when running with a herd. Some farmers use a hand-mating bull system by which cows are selected by the herdsman to be introduced into the bull pen but this entails the many disadvantages involved in oestrus detection by humans.
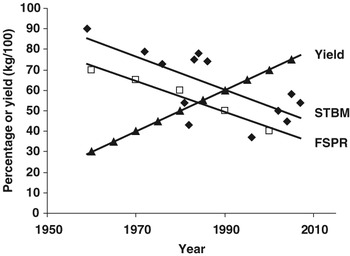
There is substantial evidence that fertility of the modern dairy cow is getting lower with increasing milk yields (Royal et al., Reference Royal, Darwash, Flint, Webb, Wooliams and Lamming2000; Butler, Reference Butler2003). Along with this documented decline, the literature over the recent past reveals a parallel decrease in the percentage of cows standing-to-be-mounted (STBM; Figure 1; Hall et al., Reference Hall, Branton and Stone1959; Williamson et al., Reference Williamson, Morris, Blood, Cannon and Wright1972; Esslemont and Bryant, Reference Esslemont and Bryant1976; Glencross et al., Reference Glencross, Esslemont, Bryant and Pope1981; Fonseca et al., Reference Fonseca, Britt, McDaniel, Wilk and Rakes1983; Stevenson et al., Reference Stevenson, Schmidt and Call1983; Hackett and McAllister, Reference Hackett and McAllister1984; Britt et al., Reference Britt, Scott, Armstrong and Whitacre1986; Pennington et al., Reference Pennington, Albright and Callahan1986; Van Vliet and Van Eerdenburg, Reference Van Vliet and Van Eerdenburg1996; LeBlanc et al., Reference LeBlanc, Leslie, Ceelen, Kelton and Keefe1998; Lyimo et al., Reference Lyimo, Nielen and Ouweltjes2000; Van Eerdenburg et al., Reference Van Eerdenburg, Karthaus, Taverne, Merics and Scenzi2002; Roelofs et al., Reference Roelofs, Bouwman, Dieleman, Van Eerdenburg, Kaal-Lansbergen, Soede and Kemp2004 and Reference Roelofs, van Eerdenburg, Soede and Kemp2005a; Walker et al., Reference Walker, Smith, Jones, Routly and Dobson2008).
Percentage of animals standing-to-be-mounted (STBM; ⧫), first-service-pregnancy-rate (FSPR; □) and average milk yield (▴) in Holstein Friesian dairy cows reported over the last 50 years (references in text).

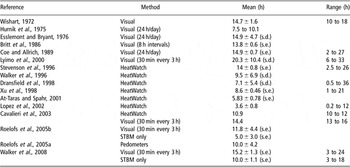
Thus, in research studies, although the duration of total primary and secondary signs of oestrus has not changed significantly over the past 30 to 50 years, the percentage of animals STBM (Figure 1) and the duration of STBM have both declined (Table 1). Furthermore, there is evidence that high milk production increases the number of silent heats (averages of 0.7 v. 1.6 silent heats for 28 and 36 kg/day, respectively; Harrison et al., Reference Harrison, Ford, Young, Conely and Freeman1990). So, in practical terms, it is not surprising that fewer herdsmen are seeing cows in oestrus. These observations have, of course, been associated with a marked decline in first-service-pregnancy-rate (FSPR; Figure 1). Coupled with the decline in farm labour on dairy units, it is no wonder that it is getting more difficult to successfully artificially inseminate (AI) dairy cows to get them pregnant when required.
Summary of the literature regarding the first and last sign (duration) of behavioural oestrus, or stood-to-be-mounted (STBM) event, within one oestrus period

HeatWatch refers to an electronic pressure recording device placed on the sacrolumbar region of cows to record STBM.
Factors predisposing to lower fertility and disrupted oestrus
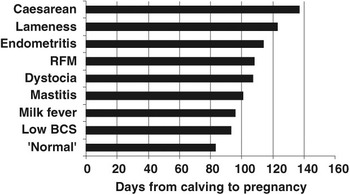
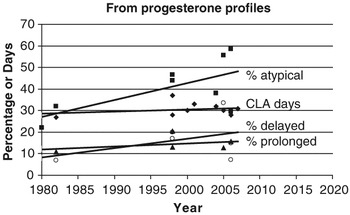
There are several (clinical) ‘production diseases’ associated with lower fertility. We know that low BCS in the early post partum period results in >10 extra days to establish a pregnancy (Lopez-Gatius et al., Reference Lopez-Gatius, Yanis and Madriles-Helm2003; Garnsworthy, Reference Garnsworthy2006), whereas cows that have had hypocalcaemia take 13 days longer to get pregnant (Parker, 1992). The calving-to-pregnancy interval is at least 18, 25 and 31 days longer in cows treated for mastitis, retained foetal membranes or endometritis, respectively, compared to healthy herd-mates (Borsberry and Dobson, Reference Borsberry and Dobson1989; Schrick et al., Reference Schrick, Hockett, Saxton, Lewis, Dowlen and Oliver2001). Lame cows are even less fertile, as it takes them up to an extra 40 days to get pregnant even after treatment (Collick et al., Reference Collick, Ward and Dobson1989; Melendez et al., Reference Melendez, Bartolome, Archbald and Donovan2003; Hernandez et al., Reference Hernandez, Garbarino, Shearer, Risco and Thatcher2005; Figure 2). Reviewing studies of milk progesterone profiles, but without detailed acknowledgement of production diseases, the percentage of atypical profiles tends to increase with time (P = 0.08), and also possibly the percentage of cows with delayed onset of luteal activity or with prolonged luteal phases (Figure 3; the observations are too few for rigorous statistical analysis; Bulman and Wood, Reference Bulman and Wood1980; Etherington et al., Reference Etherington, Christie, Walton, Leslie, Wickstrom and Johnson1991; Opsomer et al., Reference Opsomer, Coryn, Deluyker and de Kruif1998; Royal et al., Reference Royal, Darwash, Flint, Webb, Wooliams and Lamming2000; Veerkamp et al., Reference Veerkamp, Oldenbroek, Van Der Gaast and Van Der Werf2000; Fulkerson et al., Reference Fulkerson, Wilkins, Dobos, Hough, Goddard and Davison2001; Horan et al., Reference Horan, Mee, O’Connor, Rath and Dillon2005; Shrestha et al., Reference Shrestha, Nakao, Suzuki, Akita and Higaki2005; McCoy et al., Reference McCoy, Lennox, Mayne, McCaughey, Edgar, Catney, Verner, Mackey and Gordon2006; Petersson et al., Reference Petersson, Gustafsson, Strandberg and Berglund2006a; Patton et al., Reference Patton, Kenny, McNamara, Mee, O’Mara, Diskin and Murphy2007). A delay in the resumption of ovarian cyclicity after calving certainly contributes to the increased calving–pregnancy interval in diseased animals, for example, an extra 7 days in cows with mastitis and 17 days for lame cows (Huszenicza et al., Reference Huszenicza, Janosi, Kulcsar, Korodi, Reiczigel, Katai, Peters and de Rensis2005; Petersson et al., Reference Petersson, Strandberg, Gustafsson and Berglund2006b). However, this does not account for all the delay in getting mastitic or lame cows pregnant again. Once ovarian cyclicity has resumed, the ability to express oestrus is also important.
Days from calving to pregnancy in cows with different clinical production diseases (RFM retained foetal membranes; BCS body condition score; references in text).

Days from calving to commencement of luteal activity (CLA; ⧫), and percentage of atypical profiles (▪), of delayed onset of luteal activity (▴) and prolonged luteal phases (○) reported from milk progesterone studies over the past 30 years (references in text).

Oestrus, follicles and hormones in diseased cows
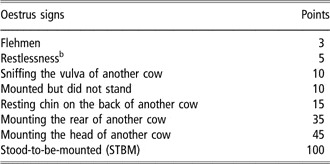
In view of our early observations that lame cows are less fertile than clinically ‘normal’ cows, we have been assessing the effects of this particular production disease on oestrous behaviour. Increasing severities of lameness (defined in Table 2) have no impact on the incidence of oestrus once ovarian cyclicity has been spontaneously resumed (oestrus observed per period of low progesterone: 20/32, 11/18, 12/17 for not lame, moderately lame and severely lame cows, respectively; Walker et al., Reference Walker, Smith, Jones, Routly and Dobson2008). However, the intensity of oestrus was lower in severely lame cows using a weighted scoring system to quantify the intensity of all signs (Van Eerdenburg et al., Reference Van Eerdenburg, Karthaus, Taverne, Merics and Scenzi2002; scoring system summarised in Table 3; normal n = 18: 583.1 ± 64.9 points; moderately lame n = 9: 657.8 ± 96.8 points; severely lame n = 9: 284.4 ± 42.7; P < 0.05).
Lameness scoring scaleFootnote a

a Modified after a previously described 5-point scale (Sprecher et al., Reference Sprecher, Hostetler and Kaneene1997) in which the above scores of 1, 2 and 3 are comparable to the scores of 1, 2 and ⩾3 on the Sprecher 5-point scale, respectively.
Point scoring scale for behavioural signs of oestrusFootnote a

a Each time an oestrus sign was observed, the assigned number of points were recorded (Van Eerdenburg et al., Reference Van Eerdenburg, Karthaus, Taverne, Merics and Scenzi2002).
b Can only be recorded once during a single 30-min observation period.
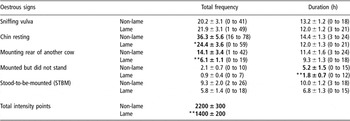
This prompted a more careful evaluation of oestrus behaviour by looking at the frequency of each component of behaviour in groups of eight to 12 cows that had been synchronized with GnRH, followed 7 days later with prostaglandin (GnRH + PG; to increase the number of cows simultaneously in oestrus; adapted from Pursley et al., Reference Pursley, Mee and Wiltbank1995). Table 4 shows that lame cows (score 1 v. 2 + 3) had a less-intense oestrus than non-lame cows (fewer total points), because the frequencies and duration of certain behaviours were lower in lame cows. Mounting the rear of another cow is an appetitive (courtship) behaviour and chin-resting plus being-mounted-but-not-standing can be construed as ‘testing’ behaviours to determine if cows will STBM. Daily milk progesterone concentrations 4 to 9 days before these oestrus observations were lower in lame cows but surprisingly oestradiol values in the same daily milk samples were not different between lameness groups (Walker et al., Reference Walker, Smith, Jones, Routly and Dobson2008). It is well known that prior progesterone exposure in ruminants has a marked effect on the intensity of oestrous behaviour (Fabre-Nys and Martin, Reference Fabre-Nys and Martin1991).
Mean ± s.e. (range) of the total frequency and duration of behavioural signs of oestrus in non-lame and lame cows (Adapted from SL Walker, personal communication)

Lower values in lame cows (n = 18) compared to non-lame (n = 15) are shown in bold (*P < 0.10, **P < 0.05).
In a subsequent study of ovarian follicular growth and ovulation after GnRH + PG synchronisation, we have recently established that fewer lame cows ovulate compared to non-lame animals (26/37 v. 17/18), although dominant follicles grow to a similar size (15 to 20 mm pre-ovulation). Milk progesterone profiles prior to the follicular phase were lower in lame cows, thus confirming our earlier observations, and oestradiol concentrations in plasma samples every 4 h were lower in non-ovulating lame cows compared to ovulating non-lame cows. In addition, all the lame cows that did not ovulate did not have a surge of luteinising hormone (LH; analysed in 2-hourly blood samples) and the LH pulse frequency in the late follicular phase was lower in non-ovulating lame cows than in ovulating cows (0.53 v. 0.76 pulses/h; P = 0.012). Thus, we suggest that the stress of lameness reduces LH pulsatility to drive oestradiol production by the dominant follicle; the consequent low oestradiol fails to initiate an LH surge and hence there is no oestrus behaviour and no ovulation.
During on-going studies, the ovaries of 52 cows treated by farmers for mastitis were scanned weekly by ultrasound and had dominant ovarian follicles on average 2 mm smaller than in paired healthy herd-mates (G Lloyd, personal communication). Furthermore, cows prone to mastitis, i.e. those with >100 000 somatic cells per ml milk (SCC), appeared to ovulate after GnRH + PG 1 day later than herd-mates with <100 000 SCC (5.5 ± 2.4 v. 4.6 ± 2.2 days, n = 16 and 15, respectively; K Kaneko and S Uppal, personal communication).
Experimental proof
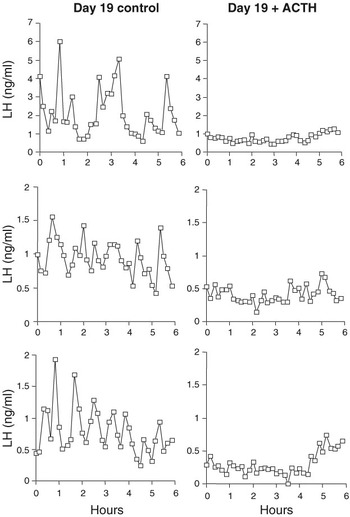
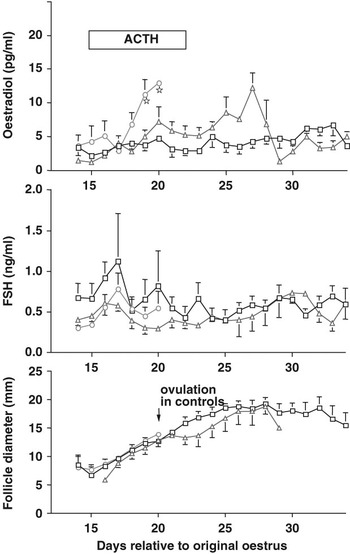
All our studies on the stress of lameness and mastitis have been observational; is there any supporting evidence from experimental studies in cows? There is none regarding long-term chronic activation of the hypothalamus–pituitary–adrenal axis. However, short-term administration of the synthetic corticoid, betamethasone, from day 10 to 19 of the oestrous cycle prevents the normal increase in oestradiol at the end of the cycle, thus inhibiting luteolysis that results in prolonged luteal phases and a 10-day delay in the occurrence of oestrus (Kanchev et al., Reference Kanchev, Dobson, Ward and Fitzpatrick1976). In addition, road transport or betamethasone reduces the amount of LH released by exogenous GnRH; and road transport delays and attenuates the LH surge induced by exogenous oestradiol (Dobson, Reference Dobson1987; Dobson et al., Reference Dobson, Alam and Kanchev1987; Nanda et al., Reference Nanda, Dobson and Ward1990). Furthermore, acute stimulation with adrenocorticotrophin hormone (ACTH) in the late follicular phase suppresses LH pulsatility, decreases oestradiol concentrations in peripheral plasma, eliminates the LH surge and results in very delayed or absent ovulation (Dobson et al., Reference Dobson, Ribadu, Noble, Tebble and Ward2000; Figures 4 and 5). All these studies substantiate our hypothesis that events activating the hypothalamus–pituitary–adrenal axis (i.e. stressful situations such as lameness or mastitis) interfere at both the hypothalamus and the pituitary level to disrupt LH and oestradiol secretion, and thus the expression of oestrus behaviour.
Peripheral plasma concentrations of LH in three control heifers on day 19 of the oestrous cycle (a) and in three heifers on day 19 during treatment with 100 IU ACTH every 12 h for 7 days from day 15 of the oestrous cycle (b). Dobson et al., Reference Dobson, Ribadu, Noble, Tebble and Ward2000: reproduced with permission.

Mean ± s.e. plasma oestradiol in the upper panel, FSH in the middle panel and follicle diameters in the lower panel for (○) six control heifers, (△) five heifers that formed a prolonged follicle and (□) six heifers that formed a persistent follicle after treatment with 100 IU ACTH every 12 h for 7 days from day 15 of the cycle. Stars indicate control oestradiol values different from prolonged and persistent follicle oestradiol values (P < 0.05). Dobson et al., Reference Dobson, Ribadu, Noble, Tebble and Ward2000: reproduced with permission.

Solutions
Hence, there lies the problem; what can we do about it now? One solution may be to treat lame cows with progesterone prior to a chosen insemination period, but this is throwing drugs at the effect, rather than addressing the cause.
Prevention of production diseases
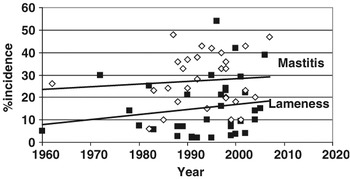
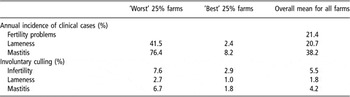
Extracting a variety of estimates concerning the incidence of lameness and mastitis in dairy herds throughout the world, there does appear to be an increasing trend (although not statistically significant) in spite of many attempts at prevention (Figure 6; Bigras-Poulin et al., Reference Bigras-Poulin, Meek, Martin and McMillan1990; Grohn et al., Reference Grohn, Erb, McCulloch and Salomiemi1990; Kaneene and Hurd, Reference Kaneene and Hurd1990; Tranter and Morris, Reference Tranter and Morris1991; Bartlett et al., Reference Bartlett, Miller, Lance and Heider1992; Lam et al., Reference Lam, Schukken, Grommers, Smit and Brand1993; Oltenacu and Ekesbo, Reference Oltenacu and Ekesbo1994; Chamberlain and Wassell, Reference Chamberlain and Wassell1995; Hemsworth et al., Reference Hemsworth, Barnett, Beveridge and Matthews1995; Clarkson et al., Reference Clarkson, Downham, Faull, Hughes, Manson, Merritt, Murray, Russell, Sutherst and Ward1996; Esslemont and Kossaibati, Reference Esslemont and Kossaibati1996; Etherington et al., Reference Etherington, Kinsel and Marsh1996; Enting et al., Reference Enting, Kooij, Dijkhuizen, Huirne, Noordhuizen and Stassen1997; Frei et al., Reference Frei, Frei, Stark, Pfeiffer and Kihm1997; Judge et al., Reference Judge, Erskine and Bartlett1997; Beckett et al., Reference Beckett, Lean, Dyson, Tranter and Wade1998; Shpigel et al., Reference Shpigel, Winkler, Ziv and Saran1998; Duffield et al., Reference Duffield, Leslie, Sandals, Lissemore, McBride, Lumsden, Dick and Bagg1999; Loeffler et al., Reference Loeffler, de Vries and Schukken1999; Galindo et al., Reference Galindo, Broom and Jackson2000; Stevenson, Reference Stevenson2000; Heuer et al., Reference Heuer, Schukken, Jonker, Wilkinson and Noordhuizen2001; Leonard et al., Reference Leonard, Egan, Griffin, Hanlon and Poole2001; Hultgren, Reference Hultgren2002; Regula et al., Reference Regula, Danuser, Spycher and Wechsler2004; Haskell et al., Reference Haskell, Rennie, Bowell, Bell and Lawrence2006). Within these studies, the average incidence ± s.e. (and range) of lameness was 15.2 ± 2.2% (2–54), and for mastitis 27.4 ± 2.2% (6–48). Indeed, the overall incidence of clinical diseases recently reported for UK farms is alarming but it is clear that the ‘best’ 25% farmers are capable of reducing the impact (Table 5). No doubt preventative efforts are being made because these diseases are damaging both on welfare grounds and in financial terms; estimates per annum for the UK national herd are £160 million for lameness and £100 million for mastitis.
Incidence of lameness (▪) and mastitis (◊) in dairy cows reported over the last 50 years (references in text).

Annual incidence and mean % culling rates associated with the production diseases of dairy cows in >219 herds in UK 1998–2002 (derived from Whitaker et al., Reference Whitaker, Macrae and Burrough2004)

Prevention is better than cure, and one approach is to develop on-farm schemes to prevent production diseases. These schemes certainly have a positive short-term impact to lower the incidence (Kingwill et al., Reference Kingwill, Neave and Dodd1970; Green et al., Reference Green, Leach, Breen, Green and Bradley2007), but effects on fertility have not been reported.
As far as preventing the losses associated with heat detection is concerned, again all farmers and vets have sufficient information available now to make improvements but despite demonstrable technical efficacy and cost effectiveness, uptake is low. To improve the situation, there is a need for mutual encouragement to address motivation and specific barriers on each farm, without which progress will be limited (Garforth et al., Reference Garforth, McKemy, Rehman, Tranter, Cooke, Park, Dorward and Yates2006).
More appropriate use of genetics
Another solution to avoid the deleterious impact of production diseases on oestrus expression is to involve selective breeding. Regrettably, in 2003 across 15 countries, the average relative genetic emphasis for production, durability and health/reproduction was 59.5%, 28% and 12.5%, respectively (Miglior et al., Reference Miglior, Muir and van Doormaal2005). Greater attempts should be made to redress this balance with respect to lameness and mastitis, and several countries now include fertility indices in selection traits. However, more forward-looking approaches also need to be explored. In dairy cattle, most clinical treatments, for example re-lameness or mastitis, take place from 1 week before to 10 weeks after calving (Zwald et al., Reference Zwald, Weigal, Chang, Welper and Clay2004). Thus, calving is a period of great risk to a dairy cow and is to be avoided. Less frequent calving with more persistent lactations would be an advantage. Over a 3-year period (the UK average cow life-span after first calving), there really need only two high-risk periods (calvings), not the traditional three as at present. Persistent lactations achieve lower and later peak yields, but reasonable long-term milk production must be maintained to be financially acceptable. Progress through selective breeding should be possible as the heritability for persistent lactation has been estimated at 0.09 to 0.18 compared to 0.03 to 0.19 for fertility (Dekkers et al., Reference Dekkers, Ten Hag and Weersink1998; Haile-Mariam et al., Reference Haile-Mariam, Bowman and Goddard2003; Muir et al., Reference Muir, Fateh and Schaeffer2004).
Conclusion
The stresses and strains of high milk production have led animals onto a knife-edge; thus, anything (such as clinical disease, inadequate nutrition, poor housing) will tip cows off balance, thus disrupting hormonal equilibrium, reducing oestrus intensity, lowering LH that results in failure of ovulation and consequent sub-fertility. On-farm schemes to prevent lameness and mastitis, coupled with genetic approaches to improve persistency of lactation, are called for. Phenotypic trends during the last 20 years show that genetic improvement accounted for ∼60% of the total increase in milk yield (JP Chenais and F Miglior, personal communication). Thus, production traits have contributed twice as much as durability/health traits, and in the Genotype–Environment interaction, the environment (how we keep animals, i.e. animal husbandry) has not kept pace with genetic ‘advances’. Our inability to appropriately feed and house high-yielding cows is leading to increased stress and thus a failure to meet genetic potential for yield and fertility. We must provide realistic solutions soon, if we want to use AI successfully to maintain a sustainable dairy industry in the future.