


I. INTRODUCTION
The need for broadband applications and high power in wireless communications has encouraged new advances in the field of solid-state devices. One of the significant advancements is the use of wideband gap (WBG) semiconductors. Their large band-gap, high electron mobility, and high-breakdown voltage make them good candidates for use in the design of high-power microwave amplifiers. Simultaneously, these high-power devices have induced many undesirable effects on the performance of high-power amplifiers (PAs) such as trapping, electrical, and thermal effects, often termed as memory effects. To extract the inherent properties of WBG devices and optimize low-frequency memory effects occurring in non-linear high-power devices, it is necessary to characterize them in time-domain [Reference Tasker1] with modulated signals. In the past, time-domain measurements of multisines for radio communications and pulsed-modulated signals for radar applications [Reference Faraj, Callet, De Groote, Verspecht, Quere and Teyssier2, Reference Ahmed, Saad-el-Dine, Neveux, Reveyrand, Barataud and Nebus3] have been performed using digital storage oscilloscope (DSO) [Reference Williams, Leckey and Tasker4] or the subsampling principle applied in large signal network analyzer (LSNA) and single-channel track and hold amplifier (THA) [Reference Ahmed, Saad-el-Dine, Neveux, Reveyrand, Barataud and Nebus3, Reference Clark, Chrisikos, Muha, Moulthrop and Silva5, Reference El Yaagoubi6]. The main drawback encountered when using the subsampling principle of LSNA for the characterization of non-linear devices driven by modulated carriers stands in the narrow-envelope bandwidth limitations. Specific configuration of the sampler-based instrument enables an increase in the bandwidth using a complex clock circuitry [Reference Van Moer and Rolain7, Reference El Yaagoubi, Neveux, Barataud, Nebus and Verspecht8]. A system with an 8-bit dynamic range and an enlarged bandwidth of 160 MHz has been realized exhibiting promising results [Reference Abouchahine9], but the challenge to optimize the bandwidth, dynamic range, and reduced analog IF circuitry still exists.
In this paper, a fully calibrated 4-channel time-domain test setup is proposed. It is built using four commercially available THAs with increased dynamic range and bandwidth to accurately characterize non-linear power devices with memory. Section II compares the working principle, the advantages, and disadvantages of THA over a sampler. Section III presents the proposed 4-channel time-domain “THA-based” measurement system with complete calibration technique and demodulation procedure. In Section IV, a 50 W GaN PA is characterized with CW, 2 tones, and pulsed-CW test signals. Finally, a digital pre-distortion scheme was applied to enhance the linearity performance of the amplifier under test (AUT) and demonstrate the potential capabilities of the proposed system.
II. CHARACTERISTICS OF SAMPLING AND HOLD TECHNIQUES
Down conversion of radiofrequency (RF) signal is the key component in time-domain analysis. Until recently, the major instrument used for sampling-based down conversion of microwave spectra into IF spectra has been the sampler. Two important aspects of subsampling principle are envelope bandwidth and dynamic range. Both features are co-requisite, and depend mainly on the loss conversion of sampling techniques, the frequency repetition rate, and the bandwidth of the strobe signal. To evaluate the characteristics of a sampler and a THA, a transient simulation of their operating principle was performed.
Figure 1 describes the block diagram of schematic used to simulate the sampling principle using sampler-based down conversion phenomenon, which implies charge-sampling technique [Reference Gand and Jiren10]. The simulation results are explained in Fig. 2.
Block diagram of down conversion spectra using sampler.

Sampling principle for sampler (ADS simulation).

Charge sampling integrates the charge within a time corresponding to the falling time of the pulse strobe when the Schottky diodes (D1 and D2) in Fig. 1 are forward biased. It corresponds to the sampling gate window of the sampler. Next, the Schottky diodes are reversed biased and the capacitors are discharged through IF resistances which correspond to the “hold” mode of the sampler. The IF circuitry is then required to integrate this signal at the output of the sampler. This signal could then be digitized by an analog-to-digital converter (ADC) working at a clock frequency of at least twice the cut-off frequency of the IF filter.
The charge-sampling bandwidth is directly dependent on signal-integrating window so, if the charging time of the capacitor is increased, the bandwidth of the strobe signal decreases. The sampling efficiency of the sampler is very low, which means that the loss conversion of the sampler is very high (40 dBc). The maximum input power to the sampler is also limited, making it necessary to include an IF circuitry comprising linear PA (~55 dB gain) and a low-pass filter before sending this data to ADC. The linearity of IF circuitry is highly important to avoid contaminating the actual data. For comparison, a “conventional” Agilent sampler acquired from the 8510 vector network analyzer was characterized in terms of power, with a maximum input power limited to −15 dBm. A measurement covering a bandwidth of 200 MHz was made, and a loss conversion of around 40 dB was measured.
One of the possible ways to enhance the bandwidth versus dynamic range barrier is by the use of a THA technique. Considering this, a THA has been characterized which implies that voltage-sampling technique and some propitious results have been obtained.
The complete description of THA is described in [Reference Yamanaka, Sano and Murata11]. In this paper, only the working principle of THA is described, by performing a transient Advanced Design System (ADS) simulation [Reference Ahmed, Saad-el-Dine, Neveux, Reveyrand, Barataud and Nebus3], using ideal components (switches and emitter follower amplifiers (EFAs)). The block diagram of the schematic is presented in Fig. 3.
Block diagram of simulated THA schematic in ADS.

A CW RF signal at 2.5 GHz was applied at the THA input and a transient analysis was performed. Two ideal switches (SW1 and SW2) driven by a sine-wave differential signal at 400 MHz (i.e. T clock = 2.5 ns) were used. In Fig. 4, it is shown that during negative half of the clock cycle (T clock) SW1 is tracking the RF signal, whereas it holds on to the voltage level reached by hold capacitance C1 during the switch to positive half. SW2 driven by an inverted clock performs similar function for each half of inverted clock cycle, but it tracks and holds the RF voltage level at the output of SW1.
Sampling principle of THA (ADS simulation).

The THA has an ideal gain conversion equal to unity owing to the use of an EFA at the output of each switch. The input EFA is highly linear and is used to decouple the source and the hold capacitance. The simulation result obtained, with and without EFA for a single stage, is described in Fig. 5. It can be seen that without using the EFA at the output of switch the capacitor is discharged during the hold state similarly as samplers.
Output voltage THA with and without EFA.

The subsampling principle obeyed by both sampler and THA is described by the following equation:

with N = 6, T RF = 0.4 ns, and Δt = 0.1 ns.
Using this subsampling principle, the THA output signal can be directly digitized by an ADC without using any IF circuitry, thus the THA undergoes voltage-sampling phenomenon while the sampler follows charge-sampling technique.
A characterization of a commercially available THA (InPHI 1321TH) based on InP technology, in terms of power and linearity, was performed using the measurement system described in Fig. 6. THA and ADC share the same sinusoidal clock without IF analog circuitry, thus reducing circuit complexities. A phase trimmer is required on the ADC clock path to make sure that the ADC sample falls within the hold interval of the THA as shown in Fig. 7.
Block diagram of THA characterization test bench.

Main characteristics of THA- and sampler-based systems.

The measured conversion gain of the commercially available wideband THA (13 GHz BW and 2 GS/s) is around −6 dB, which is much lower than the loss conversion of samplers. Fig. 7 provides a comparison between the main characteristics of a “THA-based” system and a “sampler-based” system.
For linearity analysis, 1 dB compression point (Fig. 8), third-order intercept point, and inter-modulation distortion (IMD) were measured using the ADC acquisition. The measured value for 1 dB compression point was P 1dB = 6 dBm and a 70 dB dynamic range was achieved. The TOI point was around 10 dBm, a value similar to the dynamic range of ADC. It ensures that if maximum power at the input of THA is kept lower than 5 dBm, the system (THA + ADC) response would always be linear. An IMD level lower than 40 dBc was measured up to 10 dB below the maximum-saturation level of THA.
1 dB compression point of THA at different clock (CLK) frequencies.

THA-based measurement technique offers the following advantages over sampler-based technique. Direct RF sampling is achieved with reduced circuit complexities. IF filtering is not required, thus achieving high dynamic range. The following Table 1 summarizes the measurement results obtained with the available instruments in our laboratory.
Measurement results of INPHI 1321TH and available 8510 sampler.

III. 4-CHANNEL TIME DOMAIN MEASUREMENT SYSTEM
Figure 9 describes the proposed 4-channel high dynamic range broadband time-domain measurement system. The modulated RF signals generated by the R&S signal modulation unit (SMBV100A) are linearly amplified and fed to the input of the power AUT.
Block diagram of 4-channel measurement system.

Incident, transmitted, and reflected signals were measured simultaneously by using two directional couplers, and four 13 GHz bandwidth 2 GS/s THAs connected to a 4-channel 420 MS/s, high dynamic range (12 bit) ADC. A common clock of 400 MHz (sinusoidal) feeds the THAs and the ADC. The harmonic components at the input and output of AUT were eliminated by the low-pass filters connected at the input of THAs. The SMBV and RF synthesizer are synchronized with a 10 MHz reference. The RF signals are directly sampled by the THA and the ADC.
A) System calibration procedure
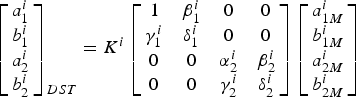
A system calibration was performed to mathematically remove systematic errors. Two assumptions for the calibration procedure were adopted: that the relationship between measured and physical quantities is linear and there exists no cross talk between ports [Reference Verspecht12]. The goal of the calibration procedure was to determine the eight unknown complex-error coefficients for each frequency. These error coefficients associate raw data provided by ADC measurement channels to the incident and scattered power waves at the input and output of device under test. The error correction matrix is expressed as the following [Reference Verspecht12]:
where i denotes the frequency index.
A classical short-open-load-through (SOLT) calibration is performed at fundamental RF of the AUT which comprises eight measurements. The first seven measurements give the following seven error coefficients β1i, γ1i, δ1i, α2i, β2i, γ2i, and δ2i. Subsequently, a power calibration was done at a relatively high power (20 dBm) by using a power sensor at port 1. At the end of this step, the K i coefficient was determined. A phase equalization of the input and output voltage waves was then performed assuming a constant group delay over the IF bandwidth. It should be noted here that the measurement system contains four synchronized channels, therefore, time alignment as described in [Reference Saad El Dine13, Reference Weiß14] is not required for instantaneous envelope characterization of PA with memory.
B) Subharmonic sampling/quadrature sampling
Magnitude and phase demodulation of encoded high-frequency carrier signal were always a problem, but by reducing the complexity of the IF circuitry, the boundary between analog to digital conversion and digital computation was increased. This direct RF sampling eliminates the need for Inphase Quadrature (IQ) mixing if the digitizer samples are using the following relations:


where


Using these relations, the in-phase and quadrature components were easily extracted.
IV. MEASUREMENT RESULTS
The test bench proposed in Section III has been applied to the characterization of a 50 W GaN PA from Nitronex (NPTB00050B) at 2.5 GHz [15]. The PA is operating at a drain quiescent current of 330 mA and a drain voltage of 28 V. A common sinusoidal clock was used to feed the THA and the ADC.
A) CW measurements
Measurement results of a 50 W GaN Nitronex PA driven by a continuous RF signal are described in this section (Fig. 10). Measurement was made using the THA test bench described in Section III and an LSNA-based test bench [Reference El Yaagoubi6]. Then 1 dB compression point output power of 45.6 dBm and power gain of almost 12 dB were measured with both the systems.
Measured gain and output power of Nitronex 50 W PA.

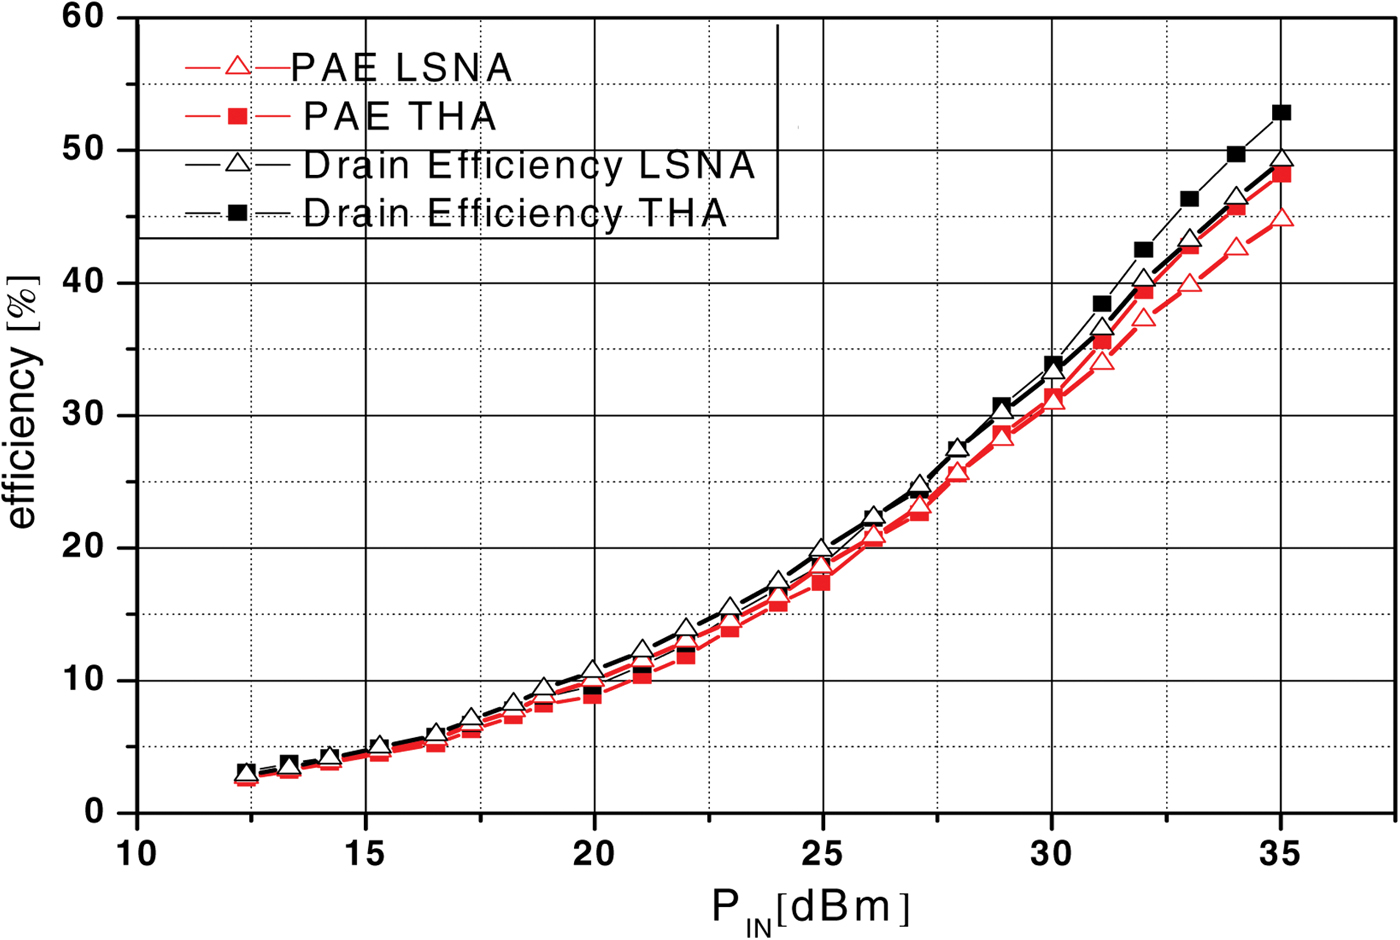
Furthermore, we see in Fig. 11 that maximum drain efficiency (η) of 52% and Power Added Efficiency (PAE) of 48% were measured with a THA-based system and drain efficiency (η) of 48% and PAE of 45% was recorded with an LSNA. Maximum phase variation (Fig. 12) of almost 9° for both measurement systems (THA and LSNA) was noted with respect to input-power variations.
Measured drain and power added efficiency.
Measured AM–PM conversion.

B) Pulsed measurement
Here a burst of eight pulses was applied to the AUT operating at a frequency of 2.5 GHz. The pulse period was equal to 10 µs with 10% duty cycle. The time-domain waveform was simultaneously captured at both ports of AUT.
In Fig. 14, it can be seen that exactly eight burst of pulses were captured at the output of the AUT and within each pulse exactly four samples per RF period were obtained. Based on this data, the in-phase and quadrature components were computed and the phase and amplitude (Fig. 13) information was demodulated from the signal. As the signal within pulse width is continuous, an almost constant phase could be seen and during the off state of the pulse only noise was measured. A small decrease in the envelope amplitude can be seen during the pulse, which ensures the presence of memory effects within the amplifier.
Measured time-domain pulsed output waveform and extracted pulsed envelop and phase information.

Measured time-domain two-tone voltage waveforms.

C) Two-tone measurement
To demonstrate the capabilities of the test setup to determine both RF carrier and envelope characteristics, the PA was characterized in terms of linearity driven by a two-tone signal. The AUT was operating at a frequency of 2.5 GHz with a tone spacing of 1 MHz, and time-domain waveforms were simultaneously captured at both ports of AUT.
Figure 14 depicts the two-tone time-domain voltage waveforms at the input and output of AUT for an output power of 45 dBm. Exactly four samples per RF period were captured and the in-phase and quadrature components were computed to demodulate the phase (Fig. 15) and amplitude (Fig. 16) information.
Demodulated phase at saturation.

Demodulated envelope amplitude at saturation.

Figure 17 represents the time-domain current i k(t k) and voltage v k(t k) waveforms captured at the output of the amplifier and the reflection coefficients calculated by the captured waveforms at all four ports.
Output current and voltage waveform at compression and the load and source reflection coefficients.

Two-tone envelope transfer characteristics based on instantaneous Amplitude Modulation and Phase Modulation (AM–AM) and AM–PM conversion were also measured. Figure 18 shows the dynamic AM–AM curve due to variations in the amplitude of the input and output envelope signals.
Dynamic AM–AM at saturation.

Figure 19 displays the dynamic phase shift occurring at the input and output of PA commonly known as AM–PM conversion. AM–PM conversion gives us information about undesired phase shifts within the amplifier that can cause signal degradation. A maximum of a 12° phase shift was noted with the input envelop variation.
Dynamic AM–PM at deviation.

THA-based measurements utilize the same CW clock for THA and ADC synchronized by 10 MHz reference and triggered by the RF source, thus making the measurements quite simple, whereas sampler-based measurement require high-precision phased-locked clocks [Reference Faraj, Callet, De Groote, Verspecht, Quere and Teyssier2] for measurement of pulsed signal and complex data processing to accurately demodulate the modulated signal (Table 2).
Measurement complexity between sampler- and THA-based measurements.

++, Simple clock signal.
+− High precision clock + complex data processing.
D) Linearization of PA using digital pre-distortion technique
The generation of unwanted frequency components within an amplifier operating at saturation exhibits the non-linearity of the device. It causes amplitude and phase distortion which leads to interference with other bands and the signal spectrum to spread. To compensate the non-linearities and to optimize the efficiency many pre-distortion techniques have been used in the past [Reference Teikari16, Reference Morris and McGeehan17]. In this work, a simple first-order baseband pre-distortion technique was implemented to generate an inverse transfer function of an amplifier prior to the AUT, thus making the output of the amplifier a linear function of the input signal [Reference Morris and McGeehan17, Reference Giesbers, Mann and Eccleston18]. An inverse transfer function is obtained by inverting spline functions fitting the average of measured dynamics of the AUT. The aim of this first-order linearization approach at the core of this paper is simply to demonstrate the capabilities of our measurement test set-up.
The dynamic AM–AM and AM–PM conversion was obtained by the measurement of AUT at the input and output ports by the proposed 4-channel time-domain measurement system at saturation. This information was used to develop inverse transfer functions (Figs 20 and 21) to compensate the compression characteristics of PA. Inverse transfer functions were obtained for each power level, for an accurate representation of each signal.
PA and Digital Pre-Distortion (DPD) transfer function (normalized).

AM–PM conversion with and without DPD.

Figure 22 represents the calculated envelope, phase, and IQ signal for the baseband and pre-distorted baseband signal applied to the AUT for linearization. Encouraging results have been obtained in terms of IMD for two-tone test. Figure 23 represents the measured IMD level and it can be seen that an improvement of 8 dBc has been achieved at saturation, whereas it improves to 16 dBc at 3 dB back off.
Calculated normalized envelop amplitude and phase comparison of baseband and digital pre-distorted signal.

Measured two-tone IMD comparison between with and without DPD.

IV. CONCLUSION
This paper presents a fully calibrated 4-channel time-domain test bench for characterization of high-power GaN amplifier in terms of power and linearity. It is based on the use of THA, the working principle of which has been demonstrated. It highlights the advantages of wideband THA over the sampler for the conventional subsampling principle. The reduction of component density in analog domain and direct digitization of entire RF spectrum brings more flexibility in the receiver's performance. A much improved bandwidth of 200 MHz with 12-bit enhanced dynamic range has been achieved. The use of the subharmonic sampling enabled us to extract the in-phase and quadrature components without the use of digital mixers. This proposed test bench has the capability to extract the dynamic characteristics of PA under different modulation signals. This ability allows the extraction of the two-tone transfer characteristics that are highly useful in designing a digital pre-distortion linearization scheme for the AUT. Significant improvement in the third-order inter-modulation products has been presented using the baseband pre-distortion linearization scheme.
A key aspect is that no time alignment is required to get time-aligned input and output envelope before proceeding to digital linearization scheme. This measurement system could also be used for behavioral modeling of non-linear devices, PA linearization with variable loads and mismatches.
 Sajjad Ahmed was born in Rawalpindi, Pakistan, in 1983. He received the Bachelors of electronics degree from the Ghulam Ishaq Khan Institute of Engineering Sciences, Pakistan, in 2005 and the Masters in electronics degree from University of Gavle, Sweden. Currently, he is pursuing Ph.D. in Electronics at the University of Limoges. His research interests include the time-domain non-linear characterization of RF and microwave devices and systems.
 M. Saad El Dine was born in Kuwait, Lebanon, on 11 June 1984. He graduated from University of Limoges, France and completed his Ph.D. from University of Limoges in 2011. His area of research is linearization of high-efficiency power amplifiers by combining digital pre-distortion and envelope tracking techniques.
 Guillaume Neveux was born in Civray, France, in 1976. He received the Diplôme d'Etudes Approfondies (DEA) degree from the Université Paris 11, Orsay, France, in 2000 and the Ph.D. degree in electronics and communications from the National Superior Institute of Telecommunications (ENST), Paris, France, in 2003. Since 2004, he has been with the instrumentation group of the XLIM Laboratory at the University of Limoges (France). His research interests include the non-linear measurement with LSNA, and the study of RF sampling system.
 Tibault Reveyrand was born in Paris, France, on September 20, 1974. He received the Ph.D. degree from the University of Limoges, France, in 2002. From 2002 to 2004, he was a postdoctoral scientist with the CNES (French Space Agency). In 2005, he became CNRS engineer at XLIM (formerly IRCOM), Limoges. His research interests include the characterization and modeling of RF and microwave non-linear components. He was the recipient of the European GAAS-2002 Best Paper Award.
 Denis Barataud was born in Saint-Junien, France, in 1970. He graduated from “Ecole Nationale Supérieure de Télécommunications de Bretagne” in 1994. He received the Ph.D. degree in electronics from the University of Limoges in 1998. He was a postdoctoral scientist for Microwave Laboratory of the CNES of Toulouse, France, from 1998 to 1999. Since 2000, he has been with the XLIM (formerly IRCOM) Laboratory at the University of Limoges, where he became an assistant professor in 2001. He has defended in 2009 his habilitation thesis in order to become a full university professor. His research interests include the development of time-domain equipment and techniques for the characterization of non-linear devices.
 Jean-Michel Nebus was born in France in 1963. He received the Ph.D. degree in electronics from the University of Limoges, France in 1988. He worked as a project engineer at ALCATEL SPACE INDUSTRIES – France. He is now professor at XLIM, University of Limoges, France. His main area of interest is non-linear microwave device characterization and design.



