Introduction
Analysis of material preserved in glaciers and ice sheets can provide a window into the climatological and environmental history of our planet. In order for core samples to be useful, it must be possible to accurately date the core as a function of depth as well as correlate such layers geographically. This information complements other chemical, microbial and isotopic analysis on glacial ice. There are a number of methods available to date core samples, but the use of volcanic ash layers to provide chronological markers is of particular interest (Dunbar et al. Reference Dunbar, McIntosh, Kurbatov and Wilch2007). Current analytical methodology involves sectioning of core samples followed by destructive analysis, precluding simultaneous analysis of the same ice sample for other microbial, chemical and isotopic content. Sample sizes required for analysis limit the spatial and, hence, chronological resolution that can be obtained within a core sample as well. With respect to ash layers a further complication can be the density of the particulate in the ice. For eruptions occurring close to the core site, or for major eruptions in which the ash has a wide geographic distribution, the layers are easily identified. This is more difficult as the density of the particles in the ice decreases. For a sparse particulate distribution, it may be necessary to discriminate between meteoritic microparticles, aerosols and volcanic ash on a very limited sample size. This is especially true if the deposition site is far from the source since, in this case, the particle size of the ash may be of the order of micrometers. All this indicates the need for non-destructive screening and characterization techniques for ice core analysis.
Optical techniques are of great use in identifying particles embedded in ice non-destructively and, if necessary, in the field. Simple light scattering can be used to rapidly identify layers as a function of depth in a borehole (e.g. Bay et al. Reference Bay, Price, Clow and Gow2001). More information can be obtained by looking at the frequency distribution of the scattered light. Fluorescence signals can be used as an indicator of biological material (algae, bacteria, etc.) (Tung et al. Reference Tung, Price, Bramall and Vrdoljak2006, Storrie-Lombardi & Sattler Reference Storrie-Lombardi and Sattler2009). From the standpoint of obtaining chemical information, Raman spectroscopy can be particularly useful as a non-destructive analytical technique. Raman spectra are produced by the inelastic scattering of a monochromatic light source. In Raman, the scattered radiation is offset from the incident laser frequency by an amount proportional to the rotational or vibrational frequency of the scattering centre. Thus, in Raman, a spectrum similar to an infrared spectrum can be obtained from a point of laser focus. Using the appropriate microscope objective, chemical information can be obtained on samples at diffraction limited resolution. This makes the use of Raman quite attractive as a methodology for the analysis of particulate matter. For example, the chemical composition of aerosols have been determined on a particle-by-particle basis using Raman spectroscopy (Fung & Tang Reference Fung and Tang1999).
From a spectroscopic standpoint, analysis of ash samples with Raman spectroscopy provides a considerable analytical challenge. This is mainly due to the fact that, unlike aerosol particulates, for example, volcanic ashes are polyphase, containing both glass and minerals. The minerals exist as free crystals (phenocrysts) and also as small crystals within the volcanic glass (microlites). Therefore, volcanic ashes are complex and variable in composition, on both an inter- and intra-particle scale. Thus, while aerosol samples might be expected to have relatively unambiguous Raman spectra consisting of relatively sharp bands, silicate glasses, which make up the bulk of volcanic ash, would be expected to have broader and more complex Raman spectra. In spite of this, volcanic ash has been the subject of much study using Raman spectroscopy (Gage & Farwell Reference Gage and Farwell1981, Ishizaki & Tu Reference Ishizaki and Tu1982, Tu Reference Tu1982, Zotov et al. Reference Zotov, Yanev, Epelbaum and Konstantinov1992, Chabiron et al. Reference Chabiron, Pironon and Massare2004, Zajacz et al. Reference Zajacz, Halter, Malfait, Bachmann, Bodnar, Hirschmann, Mandeville, Morizet, Muntener, Ulmer and Webster2005, Thomas & Davidson Reference Thomas and Davidson2006, Di Muro et al. Reference Di Muro, Villemant, Montagnac, Scaillet and Reynard2006a, Reference Di Muro, Giordano, Villemant, Montagnac, Scaillet and Romano2006b). While the majority of these studies dealt with the characterization of water content of glasses, some studies, particularly the work of Di Muro et al. (Reference Di Muro, Villemant, Montagnac, Scaillet and Reynard2006a, Reference Di Muro, Giordano, Villemant, Montagnac, Scaillet and Romano2006b), described a methodology for relating Raman spectra to speciation and composition within ash samples. It was decided to apply this approach to the identification of microparticulates of Antarctic tephra in order to determine if this was a viable approach for the identification, rather than the characterization, of the source of volcanic ash in glacial ice.
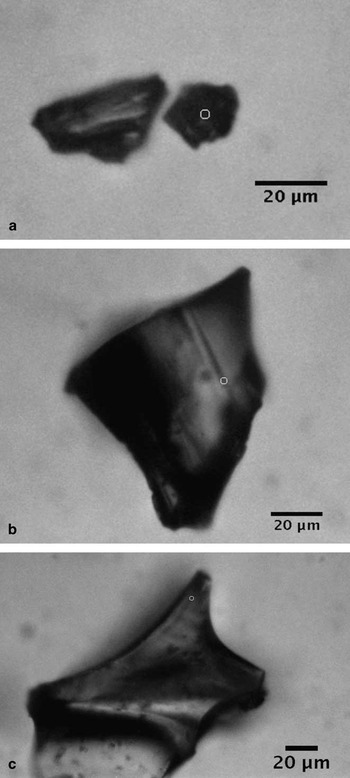
For this study, four ash samples were used, each with a distinct chemical composition, including basanite, trachyte, phonolite and rhyolite. Three of the samples were Antarctic blue ice tephra (BIT-143, -145 and -288) while the fourth, NMASH-64 was Bandelier Tuff from ancestral Rio Grande sediments. These samples were readily available along with the electron microprobe data for chemical characterization given in Table I. Two of the Antarctic samples (BIT-143 and BIT-145) were obtained from Mount Waesche in West Antarctica, while the third came from Mount DeWitt and has been attributed to ash from a Mount Erebus eruption (Harpel et al. Reference Harpel, Kyle and Dunbar2008). Figure 1 shows typical micrographs of Antarctic tephra. Table I also provides a physical characterization of the samples. It can be seen from this table that the particle size is much larger than the 1–2 μm limit of the Raman microprobe. For this study, it was decided to analyse the smaller particles in each sample at the highest magnification (50x) in order to allow for intra-particle analysis as well as particle-to-particle analysis.
Physical and chemical (electron microprobe) characterization of ash samples. Values represent mean composition expressed as weight % of the species listed.

Typical glassy Antarctic tephra particles analysed with micro-Raman spectroscopy. The circles indicate area of analysis. a. BIT-143, b. BIT-145, and c. BIT-288.

Experimental methods
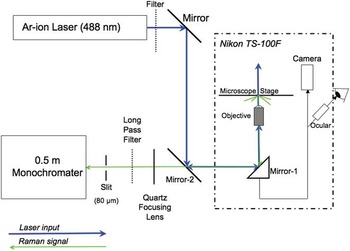
The micro-Raman spectrometer used in this study was assembled from components and tested at ambient temperatures using 45 μm diamond powder and 488 nm excitation. The basis for this system was the dispersive spectrometer previously described (Barletta et al. Reference Barletta, Gros and Herring2009) and an inverted microscope (Nikon TS-100F), equipped with an epifluorescence port and a cold stage capable of temperature control between -25°C and 60°C (Instec TSA02i). The stage was controlled with a SEMPREX X-Y controller able to locate position to c. 1 μm. Figure 2 shows a schematic of this system. Mirror-2 and the dichroic below the microscope objective were specific to the excitation source. Although the instrument is capable of operation at a range of excitation wavelengths in both the visible and UV, only 488 nm excitation from an Ar-ion laser (Coherent Innova I-90) was used in this study, since fluorescence at this wavelength could be easily corrected in the samples studied. The microscope itself was equipped with a trinocular arrangement allowing for a digital image of the analysis region to be obtained. The image was obtained using a Stingray colour camera (AVT) controlled via Labview. The camera was protected from the laser light by placing a long-pass filter designed to absorb the 488 nm radiation. The Labview virtual instrument was written to place a small circle on the image reflecting the position of the laser beam. The position of this fiduciary circle was determined using small diamond particles (0–2μm for 50x, larger particles for other objectives). The use of these particles allowed for calibration of the Raman spectrum as well as ensuring that the position of the laser beam on the sample could be accurately determined. Given the necessity of being able to both visualize and analyse particles in the size range of < 5μm, the choice of objective was limited to 50x. Because of the intervening window from the microscope cold stage, a long working distance objective was required. This was an alignment issue more than anything else since the stage controller only allowed a minimum movement of 1 μm, meaning that alignment could only be done to about 2 μm. At 50x, 1 μm particles can be seen, but the instrument cannot be aligned sufficiently well to get an unambiguous signal. The diffraction limited spot size of this objective was 0.9 μm.
Micro-Raman spectrometer schematic.

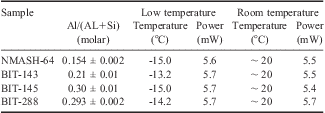
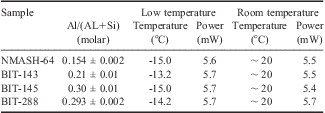
Raman spectra for samples were obtained at both room temperature and nominal -15°C - the latter was used to simulate ice core inclusion. Typical particle sizes were of the order of 50–100 μm, although particles as small as 10 μm were analysed. These sizes allowed the question of intra-particle variation to be addressed, by focusing the laser on different areas within a particle. It was possible to obtain reasonable spectra using low laser power (5–6 mW) and short analysis times (30–40 s per measurement). A summary of the analytical conditions is given in Table II. The spectra were complicated by bands arising from the Raman signal from glass in the system (e.g. lenses and windows). In some cases, a rather large fluorescence signal from the sample itself was also present. Thus, the spectra had to be processed prior to analysis by subtracting a blank spectrum collected under the same conditions as the sample. After subtracting the blank spectrum, the background was fit using a sixth-order polynomial and the spectrum mathematically levelled and zeroed with the fit. Both of these steps were accomplished using a commercial software package, Grams-AI, which was also used for peak analysis. Peaks were fit using a combination of Gaussian peaks iterated as necessary to obtain a converged or minimized fit. A minimum of 50 iterations of the fitting parameters were performed in order to ensure the best fit was obtained. Typical r 2 values for these fits were in excess of 0.9 and in most cases the solutions of the fit converged rather than minimized.
Experimental conditions for Raman analysis of tephra samples.
Results and discussion
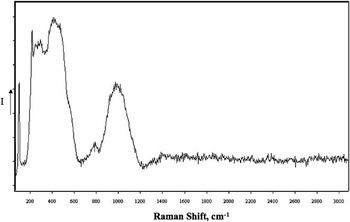
The corrected spectra fell into two basic types. The majority consisted of a series of broad bands located mainly in the region of < 1400 cm-1. These spectra were consistent with those of rhyolitic glasses (Di Muro et al. Reference Di Muro, Giordano, Villemant, Montagnac, Scaillet and Romano2006a). An example of these types of spectra is shown in Fig. 3. Chabiron et al. (Reference Chabiron, Pironon and Massare2004) assigned a strong band around 470 cm-1 and a weaker band in the vicinity of 1100 cm-1 to Si-O stretching vibrations, while assigning the Si-O bending modes to a band at c. 775 cm-1. They also located bands associated with the Si(Al)-OH bending modes in the range of 900–1100 cm-1. Di Muro et al. (Reference Di Muro, Giordano, Villemant, Montagnac, Scaillet and Romano2006a) broke up the region between 250 and 1250 cm-1 into three domains for the purpose of classifying glasses: Region I (denoted LF) from 250–650 cm-1, Region II (denoted HF) from 850–1250 cm-1, and Region III from 650–850 cm-1. They associated the relative band intensity as well as the position of maxima in the HF and LF regions with several factors including, most importantly, the degree of substitution of Si4+ by Al3+ in the structure. In their study of synthetic and natural glasses, they found a direct correlation between the ratio of the total LF to HF areas with the molar ratio of aluminum to aluminum plus silicon in the sample. For the volcanic ashes studied, the LF region had to be expanded slightly to encompass the complete band area.
Typical Raman spectrum of phonolitic glass. Sample is from BIT-288. Intensity is shown in arbitrary units, with count values increasing on a linear scale in the direction of the arrow on the y-axis.

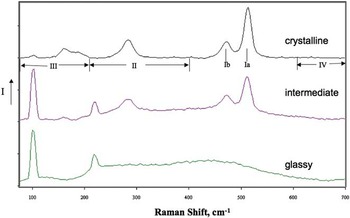
In addition to spectra attributable to glass, a few samples of BIT-143 showed Raman spectra more indicative of crystalline rather than glassy material, with peaks located mainly < 700 cm-1. This is not surprising as each of the tephra samples contained crystalline phases (see Table I). Finally, spectra intermediate between glassy and crystalline spectra were also seen. The intermediate spectrum could be attributed to either an overlap of the laser spot between a region of glass and a microlite in the particle, or a true solid solution of the two phases. A comparison of these three types of spectra is shown in Fig. 4. The sharp peaks of the crystalline spectrum in Fig. 4 are associated with the mineral feldspar (Bendel & Schmidt Reference Bendel and Schmidt2008, Freeman et al. Reference Freeman, Wang, Kuebler, Jolliff and Haskin2008). Freeman et al. concluded that while feldspars with differing compositions and structures can be readily distinguished by their Raman spectra, peak positions cannot be used to extract quantitative chemical compositions. They broke their spectra into five regions: I (450–520 cm-1), II (200–400 cm-1), III (< 200 cm-1), IV (600–800 cm-1), and V (900–1200 cm-1). Region I is most characteristic of tectosilicates, with the strongest peak (Ia) in the region of c. 510 cm-1 characteristic of feldspars. The appropriate regions are labelled in Fig. 4.
Comparison of Raman spectra of crystalline, intermediate and glassy particles from BIT-143. Feldspar band regions and peak positions defined by Freeman et al. (Reference Freeman, Wang, Kuebler, Jolliff and Haskin2008) are indicated below crystalline spectrum. Intensity is shown in arbitrary units, with count values increasing on a linear scale in the direction of the arrow on the y-axis.

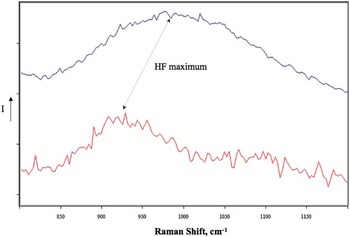
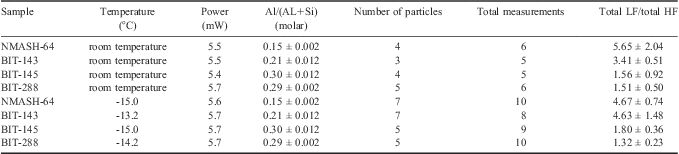
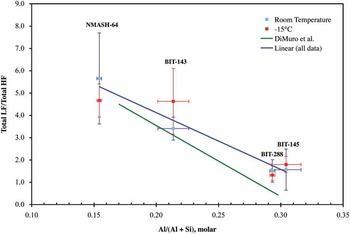
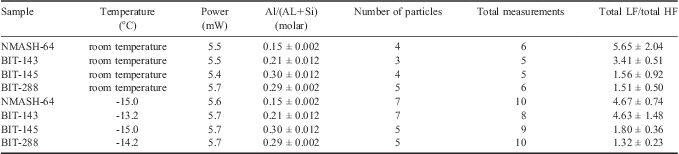
Each of the Raman spectra obtained from glassy particulates was analysed by fitting the HF and LF regions with a series of Gaussian bands using Grams-AI peak fitting routines. For all spectra, the range of peak fitting for the LF region was 250–650 cm-1. For BIT 143 and NMASH-64 the HF region fitted was 700–1050 cm-1, while for BIT-145 and -288 the region was 850–1250 cm-1, as the maximum in this region had clearly shifted to lower frequency (see Fig. 5). Table III and Fig. 6 summarize the results of these band fits. No systematic trend could be observed with temperature so the trend line shown in Fig. 6 includes both room temperature and low temperature data. The rather large variation seen in the data does not correlate with either particle size, sample-to-sample variation within a particle or particle-to-particle variation. The variation may be an artefact of the data treatment procedure with respect to the background correction due to fluorescence or may, in fact, be due to real differences between samples. Figure 6 also shows the trend line from Di Muro et al. (Reference Di Muro, Giordano, Villemant, Montagnac, Scaillet and Romano2006a) and, while differences exist, it should be noted that the scatter in the data of Di Muro et al. is in some cases quite large. While it is probable that increasing the types of samples analysed might improve the reliability of this approach, a clear trend was found, which would allow for identification of the source of ash using Raman spectra of in situ particles in ice samples were a complete library of tephra spectra available.
Shift in HF maximum observed for tephra. Upper trace, Raman spectrum of BIT-288 particle; lower trace Raman spectrum of NMASH-64 particle. Intensity is shown in arbitrary units, with count values increasing on a linear scale in the direction of the arrow on the y-axis.

Results of Raman band fitting on vitreous tephra particles. Note: uncertainty as 1σ.
Ratio of LF/HF Raman bands for tephra samples vs Al/(Al+Si). The error bars shown represent the 1 σs standard deviation of either the Al/(Al+Si) molar ratio (x-error bars) or the sample-to-sample variation of the LF/HF intensity for the Raman bands (y-error bars). The number of measurements upon which the y-error bars are based are given in Table III. In general this sample-to-sample variation was larger than the propagated error based upon peak fitting.

For the feldspar spectra, the data treatment is less straightforward as correlations between the Raman spectra of these materials and chemical composition do not exist, although, for limited classes of feldspars (sanidine and anorthoclase), Bendel & Schmidt (Reference Bendel and Schmidt2008) found it possible to correlate the molar ratio K/(Na + K) to the frequency difference between a low frequency band at c. 120 cm-1 and the Ia band of the feldspar. For BIT-143, it was found that this correlation over-predicted the K/(Na + K) ratio significantly. With respect to the classification scheme of Freeman et al. (Reference Freeman, Wang, Kuebler, Jolliff and Haskin2008) the following assignments were made: Ia, 512 ± 1 cm-1; Ib, 472 ± 1 cm-1; Ic, not detected; IImax, 283 ± 1 cm-1; and IIImax, 160 ± 1 cm-1. It should be noted that the peak maxima are derived from band fitting and the precision is probably not that high, since the resolution of the monochromater using a 600 groove grating is only 4 cm-1. Based upon data presented on field samples characterized by Freeman et al. (Reference Freeman, Wang, Kuebler, Jolliff and Haskin2008), this sample represents a reasonable similarity to the ternary feldspar sample obtained from Mount Erebus (Ia, 511 cm-1; Ib, 476 cm-1; Ic, not detected; IImax, 283 cm-1; and IIImax, 162 cm-1), which they characterized as 15.88% orthoclase, 68.85% albite and 15.27% anorthite. Although the feldspars are from two widely separated locations in Antarctica, they are similar enough in composition that Raman spectroscopy cannot be used to differentiate between them, unlike the vitreous samples discussed above (BIT-143 vs BIT 288).
In order to implement this approach to the identification of tephra particles in glacial ice, a larger suite of ash from sources pertinent to Southern Hemisphere volcanic activity should be studied and the correlation curve shown in Fig. 6 revised accordingly. However, due to the insensitivity of the observed vitreous band ratios to temperature, this expanded library can be performed using archival samples at room temperature prior to surveys of cores themselves. For identification purposes, it would also be advantageous to collect Raman spectra of Antarctic micrometeorites to augment the Raman library. Raman spectroscopy has been used to characterize meteoric components (e.g. Wang et al. Reference Wang, Kuebler, Jolliff and Haskin2004) and a library including a suite of meteorite types could be readily developed from existing collections of Antarctic micrometeorites. Suzuki et al. recently used micro-Raman to identify graphitic components of Antarctic micrometeorites (Suzuki et al. Reference Suzuki, Yamanoi, Nakamura and Nakashima2010), and although work by Glass & Fries indicated sample fluorescence may be an issue due to shock metamorphism, they concluded that micro-Raman was useful in characterization of shock metamorphosed meteoric impact ejecta (Glass & Fries Reference Glass and Fries2008). In order to increase the throughput to allow for timely surveys of cores it would also be necessary to automate the spectral analysis. Such automation is well within the state-of-the-art.
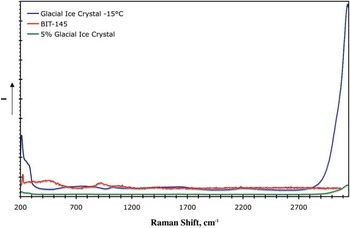
The potential exists for the analytical approach to be affected by spurious Raman signals interfering with the quantitative estimates of the LF/HF ratio. For mixed crystalline/vitreous samples, this is an issue that might prove to be difficult (see Fig. 4). However, because of the high spatial resolution of micro-Raman and the ability to analyse single, small particles with this technique, this issue could potentially be avoided. A second potential interference is from water, either in adjacent ice, or associated with the vitreous lattice. With respect to water interference, the first case is a matter of spatial resolution. In related studies on ice vein chemistry of glacial ice (Barletta & Roe Reference Barletta and Roe2011), we have found it possible to easily distinguish between the Raman signal due to a vein a few μm across and that from the surrounding crystalline lattice. With regard to the second case, water associated with the particle itself, the low-frequency libration mode which would interfere determining the LF/HF ratio is much weaker than the higher frequency (> 3000 cm-1) OH stretching modes, used by Di Muro et al. (Reference Di Muro, Villemant, Montagnac, Scaillet and Reynard2006a, Reference Di Muro, Giordano, Villemant, Montagnac, Scaillet and Romano2006b) to determine water content. In the glasses tested, we found no indication of significant bound water as evidenced by this latter band. Thus, for this study water interference was not an issue. Should bound water be present, it would be indicated by a broad band at ∼ 3550 cm-1 (Di Muro et al. Reference Di Muro, Villemant, Montagnac, Scaillet and Reynard2006b). Estimates of the magnitude of the interference due to water liberation in the LF-HF region indicate it should be small for reasonable water content in the glass (< 5 mol%). This is illustrated in Fig. 7 in which Raman spectra of glacial ice and BIT-145 are shown. These samples are normalized by power and exposure time to facilitate comparison. A third trace is shown representing the water spectrum arising from 5% of the ice spectrum to simulate bound water. It can be seen from this trace that the intensity of the 5% ice spectrum between 250 and 1050 cm-1 is negligible when compared to the BIT-145 intensity.
Raman spectra of blue ice tephra (BIT-145), glacial ice and glacial ice reduced by 95%. Tephra sample and glacial ice sample have been normalized to equivalent laser power and exposure time. Intensity is shown in arbitrary units, with count values increasing on a linear scale in the direction of the arrow on the y-axis.

Conclusions
This study, although limited in scope, demonstrates the potential efficacy of micro-Raman spectroscopy for the non-destructive classification of particulates in ice samples. Variations in the vitreous component of ash make it possible to identify the source of the ash based on chemical differences with reasonable certainty on a limited number of particles, although particle-to-particle and intra-particle variations of the Raman spectrum do require a statistically significant sample to be used. It also demonstrates the usefulness of the approach to discriminate between vitreous components of ash and other types of particulates. Crystalline (or even mixed) particulates typically have well characterized sharp peaks in their Raman spectrum in contrast to the broader bands observed for vitreous samples. The Raman spectra feldspar components of the tephra studied demonstrate the ease with which crystalline components can be identified. One distinct advantage of the approach is the ability to analyse particles at high spatial resolution (< 5 μm) with minimal processing, as well as the ability to get molecular information rather than the elemental analysis provided by x-ray analysis. Indeed, one could argue based upon these results that, even where x-ray analysis is possible, micro-Raman analysis of particulate provides complementary information useful to identification of the source of particulates in ice core samples.
The interferences observed arising from signals from glass optical elements and sample florescence can be overcome through post-acquisition data processing. It is probable that they could be dramatically reduced in future studies on core samples through several modifications of the equipment used. In the current work, because measurements were conducted using a microscope cold stage, samples were placed in a glass-bottom culture dish and windows were required between the microscope objective. In the field or in a laboratory setting specifically designed for handling ice cores, the instrument could be kept at a low temperature eliminating the use of intervening glass/quartz. In the latter case, a longitudinally sectioned core or the core itself could be surveyed. Since Raman is a surface technique, the former would be preferable. In situ characterization of inadvertently fractured core pieces would also be possible with this instrumentation. Further, because such low incident laser powers were required (< 10 mW), it should be possible to use a reflective objective, rather than a conventional glass/quartz objective even though higher signal losses are to be expected with these objectives.
Lastly, methods could be employed to reduce or eliminate sample fluorescence. In Raman, fluorescence interference arises when an electronic excitation lies fairly close to the excitation wavelength. Shifting the excitation wavelength outside of the absorption envelope (either to the red or the blue) can be used to do this. Commonly, red shifting of the excitation to, say the near IR as in Fourier transform Raman spectroscopy is employed. This has the disadvantage of reducing the Raman signal as it is roughly proportional to the fourth power of the excitation frequency. Alternatively, blue shifting beyond the excitation band to the UV (< 250 nm) can also be used. This would have the advantage of increasing the Raman intensity while minimizing or eliminating fluorescence. Even in cases where fluorescence persists, the Raman signal, in terms of absolute frequency, would typically occur between the UV excitation and the fluorescence signal, again minimizing interference. Given the laser powers necessary to obtain an adequate signal (< 10 mW), UV sources < 250 nm with sufficient power are readily available for this application.
Acknowledgements
This study was funded by the National Science Foundation under Grant No. 0828786. The author would like to acknowledge the contributions of Dr Nelia Dunbar, New Mexico Tech, for providing the samples used in this study, as well as for her helpful technical discussions on the manuscript. The constructive comments of the reviewers are also gratefully acknowledged.