Currently, one of the most pressing environmental problems in the world is the purification of ground and surface wastewater by removing residues of medicines and pharmaceuticals. Global concern regarding such aquatic pollution is linked to the ever-increasing demand for pharmaceutical compounds and their high consumption rates. Many medications and personal hygiene products, when released into surface waters via wastewater treatment plants, have a toxic effect on the environment.
Among the existing processes for removing pollutants from aquatic environments, adsorption is the most effective, frequently used and economical method. Various materials can act as inorganic adsorbents, such as activated carbon, kaolin, zeolites and clay minerals, among others (Zhang et al., Reference Zhang, Yang, Huang, Dang and Shu2013; Alekseeva et al., Reference Alekseeva, Rodionova, Noskov and Agafonov2019; Gatabi et al., Reference Gatabi, Heshmati, Mirhoseini and Dabbaghianamiri2023; Ahmed & Nasar, Reference Ahmed and Nasar2024). Clays have a unique crystalline structure and physicochemical characteristics, such as chemical inertness, biocompatibility, developed specific surface area, large pore volumes, good adsorption and ion-exchange abilities and thermal stability (Septian & Shin, Reference Septian and Shin2020). Of particular interest among the clays is halloysite (Hly), a clay mineral consisting of multilayer aluminosilicate nanotubes with a cavity inside them. The silicate tubes, from 500 to 1500 nm long, are formed of a rolled aluminosilicate sheet, the elementary layer of which has a 1:1 structure and is formed by tetrahedral silicon–oxygen and octahedral aluminohydroxyl networks (Kazue, Reference Kazue2005; Shipko et al., Reference Shipko, Stepovich, Noskov, Alekseeva and Smirnova2022). The outer diameter of Hly nanotubes is 50–80 nm, and the inner diameter is 10–15 nm.
Hly nanotubes have a large surface area and nanopore volume (Joussein et al., Reference Joussein, Petit, Churchman, Theng, Righi and Delvaux2005). Their inner surface layer is formed of aluminium oxide octahedra, and their outer surface layer is formed of silica tetrahedra. The charges on the inner and outer surfaces have opposite signs: negative charge on the outer surface and positive charge on the inner one. This can be used for the selective adsorption of drugs with different types of charge.
According to Veerabadran et al. (Reference Veerabadran, Price and Lvov2007), Hly is characterized by a negative zeta-potential in the pH range of 2.5–8.5. This allows the properties of its outer surface to be modified through the physical adsorption of cations. The literature contains papers on the use of Hly as a promising drug carrier, as a catalyst, as an adsorbent for metal ions and organic compounds and as a polymer filler (Lvov et al., Reference Lvov, Shchukin, Moehwald and Price2008; Liu et al., Reference Liu, Zhang, Mei, Zhang and Liu2011; Li et al., Reference Li, Zhu, Zhou and Zhong2015; Gładysz-Płaska et al., Reference Gładysz-Płaska, Majdan, Tarasiuk, Sternik and Grabias2018; Fizir et al., Reference Fizir, Liu, Tang, Wang and Benmokadem2022; Jaberifard et al., Reference Jaberifard, Arsalani, Ghorbani and Mostafavi2022; Nguyen et al., Reference Nguyen, Jeong, Abelmann, Ryu and Sohn2024). Lvov et al. (Reference Lvov, Wang, Zhang and Fakhrullin2016) and Wei et al. (Reference Wei, Minullina, Abdullayev, Fakhrullin, Mills and Lvov2014) reported that various antiseptics (chlorhexidine, povidone-iodine, brilliant green and iodine) as well as antibiotics (tetracycline, gentamicin, doxycycline, amoxicillin and ciprofloxacin) loaded into Hly nanotubes were released within 5–10 h and provided more effective elimination of bacteria.
Chlorhexidine is a broad-spectrum biocide that is effective against Gram-positive and Gram-negative bacteria and fungi. Chlorhexidine is a positively charged molecule that binds to negatively charged sites in the cell wall. At low concentrations, it destabilizes the cell wall and interferes with osmosis, affecting the integrity of the cell wall. At high concentrations, chlorhexidine causes congealing or hardening of the cytoplasm. Considering this mechanism of action of chlorhexidine, it is necessary to emphasize the prospects of such forms of the drug in which the active substance would be concentrated at the sites of use and would have a long release time. These problems were discussed previously in relation to the creation of antibacterial coatings on fabrics and materials for dental equipment (Wu et al., Reference Wu, Yang, Liu, Yao, Leng, Chen and Tian2017; Barot et al., Reference Barot, Rawtani and Kulkarni2020; Kalagi et al., Reference Kalagi, Feitosa, Münchow, Martins, Karczewski and Cook2020). However, one of the difficulties in using chlorhexidine in biomedicine is its low water solubility (Feng et al., Reference Feng, Farajtabar, Lin, Chen, He, Li and Zhao2019). Therefore, in practice, chlorhexidine is used in the form of gluconate and acetate salts. The gluconate salt is available at a much higher concentration of 20% (w/v), while a saturated solution of chlorhexidine acetate (CA) has a concentration of 2% (Zeng et al., Reference Zeng, Rao and Wiedmann2009).
In this regard, the literature mainly presents works on the study of the physicochemical properties and biological activity of clay minerals intercalated with chlorhexidine gluconate. For example, in the mentioned paper by Wu et al. (Reference Wu, Yang, Liu, Yao, Leng, Chen and Tian2017), an environmentally friendly antibacterial composite was prepared by loading natural Hly nanotubes with chlorhexidine gluconate. Based on the inhibition zone test results, the authors concluded that the prepared composite is a safe and promising antibacterial agent and has great potential for application in the field of textiles. In other papers, Barot et al. (Reference Barot, Rawtani and Kulkarni2020) and Kalagi et al. (Reference Kalagi, Feitosa, Münchow, Martins, Karczewski and Cook2020) reported research on Hly loaded with chlorhexidine digluconate and its dental applications. It was found that the incorporation of Hly/chlorhexidine materials in dental resin composites significantly improved their mechanical properties and achieved significant antibacterial activity. It should be noted that data on the adsorption of CA on clay minerals are extremely limited.
The purpose of the current work was to study the adsorption performance of Hly in relation to the antiseptic drug CA, which is characterized by lower solubility compared to chlorhexidine digluconate, and to prepare Hly/CA composites with a high drug content. The synthesis of composites was carried out in a simpler way than was employed in the previously mentioned reports (Barot et al., Reference Barot, Rawtani and Kulkarni2020; Kalagi et al., Reference Kalagi, Feitosa, Münchow, Martins, Karczewski and Cook2020). We studied a number of factors affecting the loading of CA from aqueous solution into Hly nanotubes under adsorption conditions.
For the first time in the current work, the kinetics and equilibrium of CA adsorption on Hly are described using several mathematical models. It should be noted that previous papers (e.g. Giménez-Martín et al., Reference Giménez-Martín, López-Andrade, Ontiveros-Ortega and Espinosa-Jiménez2009; De Souza et al., Reference De Souza, Colombo, Souto, Silva-Boghossian, Granjeiro and Alves2011) also reported a similar mathematical description of chlorhexidine compound adsorption, but using adsorbents of a different origin.
In addition, we investigated the physicochemical properties and the biological activity of Hly after CA adsorption and compared them with those of the pristine clay.
Materials and methods
Materials
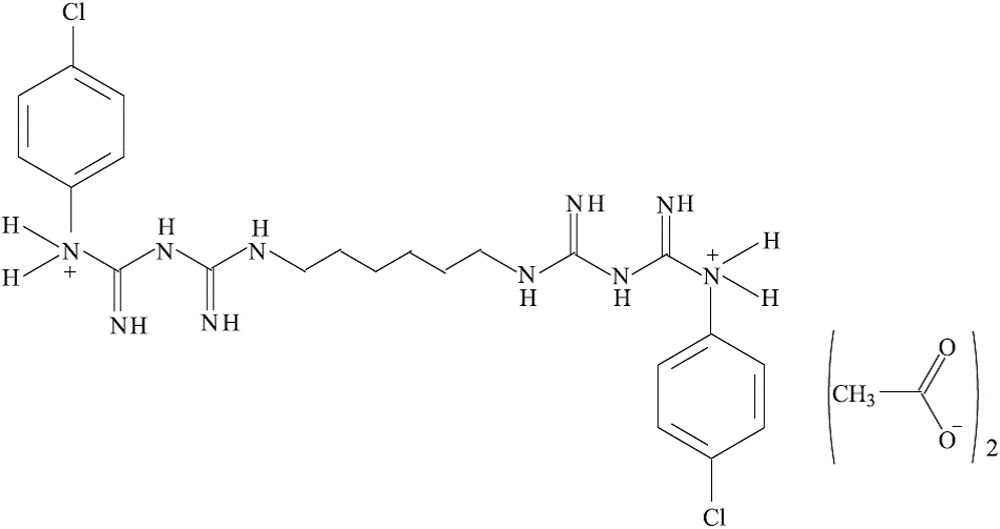
Hly nanotubes (Al2Si2O5(OH)4, Sigma Aldrich, USA) and CA (C22H30N10Cl2·2C2H4O2, a purity of 99%, Jintan Pharmaceutical Co., China) were used as materials in this study. Figure 1 shows the structural formula of CA. All chemicals were used without further purification. An Escherichia coli strain was prepared from the probiotic preparation Colibacterin (Russia).
Chemical structure of CA.

Adsorption experiments
The adsorption behaviour of Hly powder was studied at ambient temperature to evaluate the distribution of CA in the heterogeneous Hly/(aqueous CA) system. For this purpose, aqueous solutions of CA with the required concentrations were prepared at room temperature and pH = 7. Then, a weighed sample portion of the adsorbent (m = 0.005 g) was placed into tubes, mixed with 5 mL (V) of aqueous CA and held under stirring for a certain time interval, and then the phases were separated.
In kinetic experiments, the initial CA concentrations in solution (C 0) were 0.29, 0.7, 1.0 and 1.5 × 10⁻⁴ mol L–1.
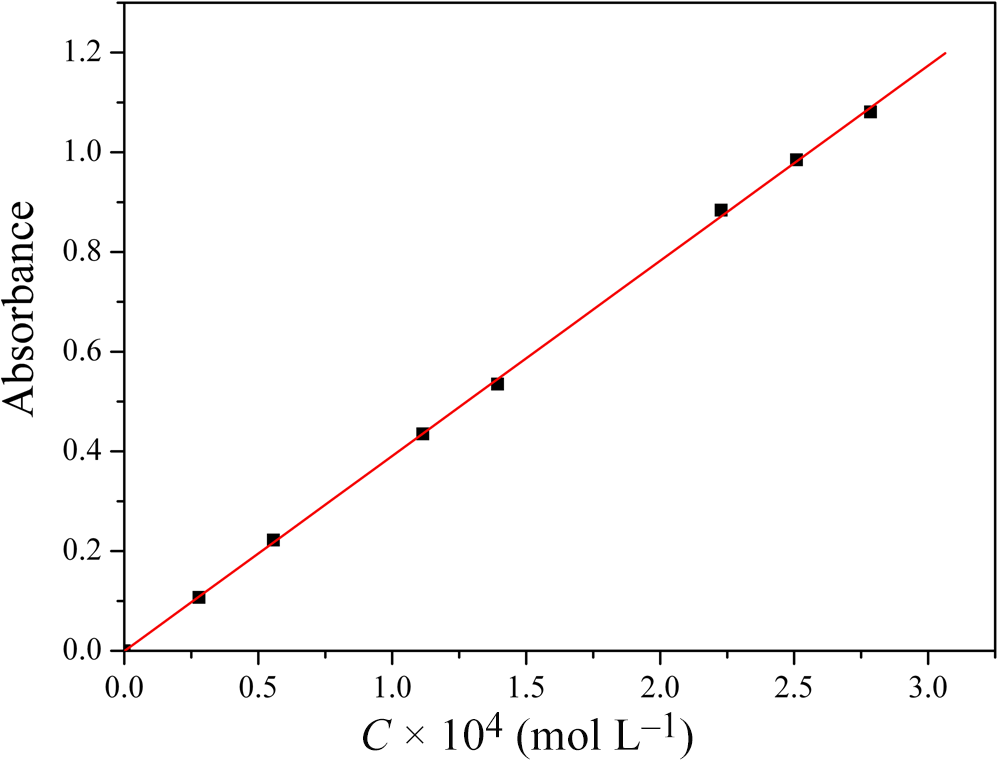
The concentration of CA in solution after adsorption (C t, mol L–1) was determined using a ultraviolet–visible light (UV-Vis) spectrophotometer (U-2001, Hitachi, Japan) at 254 nm. For this purpose, the pre-calibration dependence ‘Absorbance vs C’ was plotted in the concentration range of 0.29–3.00 × 10⁻⁴ mol L–1, where C is the concentration of CA in solution. The calibration curve (Fig. 2) was highly reproducible and linear (R = 0.99985, SD = 0.00783). This made it possible to determine the CA concentration in the solution based on the Beer–Lambert law.
Calibration dependence ‘Absorbance vs C’ for the CA solution.

All adsorption data are the average values of three tests (error <5%).
Amount of adsorbed CA (Аt, mol g–1) and level of removal (α) were calculated using Equations 1 & 2:
 \begin{equation}{A_t} = \frac{{\left( {{C_0} - {C_t}} \right)V}}{m}\end{equation}
 \begin{equation}{\unicode{x03B1}} = \left( {1 - {C_{\text{eq}}/{C_0}}} \right) \times 100\% \end{equation}
where C eq (mol L–1) is the equilibrium concentration of CA in solution.
Some physicochemical methods were used to characterize samples of both initial Hly and Hly after CA adsorption from solutions with an initial concentration of 1.5 × 10⁻⁴ mol L–1. Microbiological tests were performed on samples of initial Hly as well as on Hly after adsorption from solutions with initial CA concentrations of 0.7 × 10⁻⁴ and 1.5 × 10⁻⁴ mol L–1. These samples of Hly and organoclay were labelled as ‘Hly’, ‘Hly/CA-0.7’ and ‘Hly/CA-1.5’, respectively.
Sample characterization methods
Dynamic light scattering (Malvern Zetasizer Nano ZS, Malvern, UK) was used to monitor the particle size in the 0.3–10,000 nm range. Before testing, a suspension of clay in distilled water was prepared, sonicated and kept for 24 h.
The morphology and elemental composition of Hly before and after CA adsorption were examined using a scanning electron microscope (SEM). The SEM instrument (Quattro S, Thermo Fisher Scientific, Czech Republic) was equipped with an energy-dispersive X-ray spectroscopy (EDS) detector. For testing, the samples were placed on carbon tape.
To assess the quantitative parameters of the porosity of the investigated materials, the N2 adsorption–desorption technique (QuantaChrome Nova 1200 surface area analyser, USA) was used. Before the measurement, the samples were degassed at 100°C for 7 h in vacuum.
The crystal structure of Hly powders (before and after CA adsorption) was studied using X-ray diffraction (XRD) according to the method for powder samples. A Bruker D8 Advance diffractometer (Germany; Cu-Kα radiation, λ = 0.154 nm) was used. The samples were scanned over the range of 5–70°2θ at room temperature. A crystallographic database (http://database.iem.ac.ru/mincryst) was used to identify the peaks. The interlayer distance was calculated using the Bragg formulas (Mao et al., Reference Mao, Zhu, Liu, Yao and Kobayashi2016).
For infrared (IR) spectroscopy of Hly before and after CA adsorption, the samples were prepared by dispersing into KBr and pressing into pellets. IR absorption spectra were recorded using a VERTEX 80v Fourier-transform infrared (FTIR) spectrometer (Germany) over the wavenumber range of 4000–400 cm−1 with triple scanning, at room temperature and at a resolution of 2 cm−1.
Thermogravimetric (TG) analysis was performed in an argon atmosphere (40 mL min–1). A simultaneous thermal analyser (STA 449 F1 Jupiter, Netzsch, Germany) was used. The samples of pristine and CA-loaded Hly were heated from 25°C to 800°C at a heating rate of 5°C min–1 and the mass loss was measured. The accuracy in sample mass measurement was ±1 × 10⁻³ mg, and the accuracy in temperature measurement was ±0.1°C. Three TG scans were performed for each sample.
Antimicrobial assay
The Hly samples before and after CA adsorption were screened for their antimicrobial activity against the Gram-negative bacterium E. coli M-17 via the disc diffusion technique (Isah et al., Reference Isah, Asraf, Nizam, Malek, Jemon and Sani2020).
For this, we inoculated an aqueous suspension of bacterial spores into the nutrient medium that was melted and cooled down to 45–50°C. Endo agar was used as a nutrient medium. A bacterial mixture was prepared using a turbidity standard. The mixture was then thoroughly blended and poured into Petri dishes. After congelation, we put the test specimens (Hly, Hly/CA-0.7 and Hly/CA-1.5) on the surface of the congealed mixture and placed the Petri dishes into a desiccator, at the bottom of which distilled water was poured. We then placed the desiccator into the thermostat at a temperature of 30 ± 2°C for 24 h. At the end of the experiments, we assessed the lysis zone (the zone of inhibition of bacterial growth) around the samples. In addition, we assessed the number of colonies in the samples and in the control test (without a Hly/CA sample) using a microscope.
Results and discussion
Adsorption performance of Hly in relation to CA
Adsorption kinetics of CA on Hly
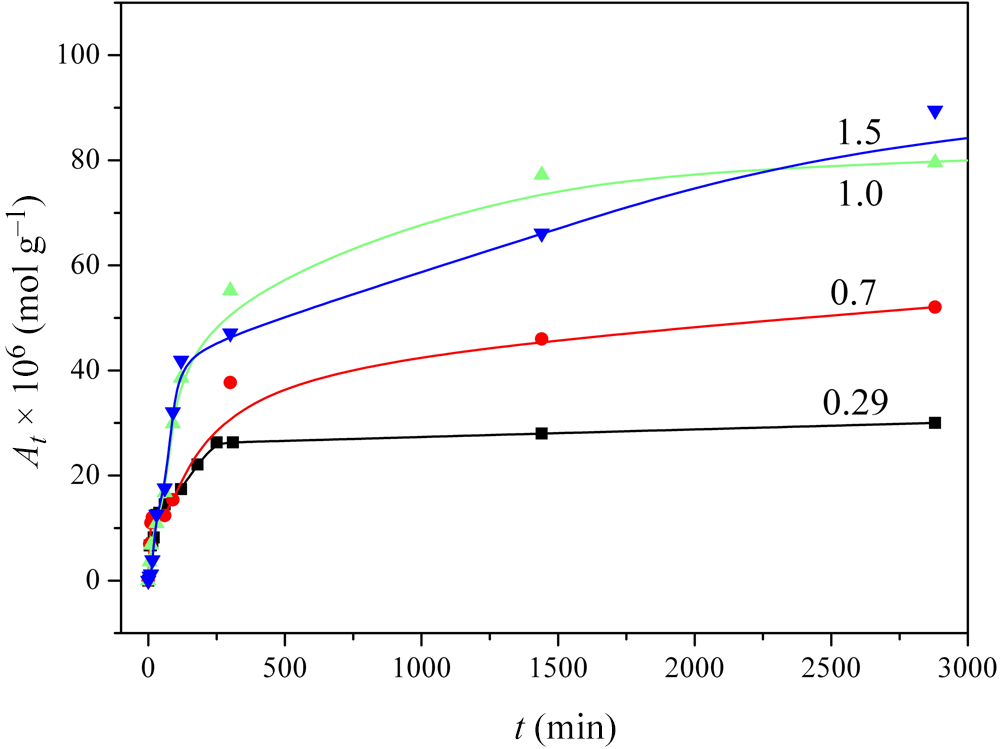
To assess the adsorption performance of Hly, a study was made of the kinetics of CA removal from aqueous solutions. Figure 3 shows the experimental data characterizing the effect of contact time on the amount of adsorbed CA for solutions with different initial concentrations of the drug.
Influence of the initial CA concentration on the amount of drug adsorbed by Hly. Curve numbers reflect the following the C 0 values: 0.29 × 10⁻⁴, 0.7 × 10⁻⁴, 1.0 × 10⁻⁴ and 1.5 × 10⁻⁴ mol L–1.

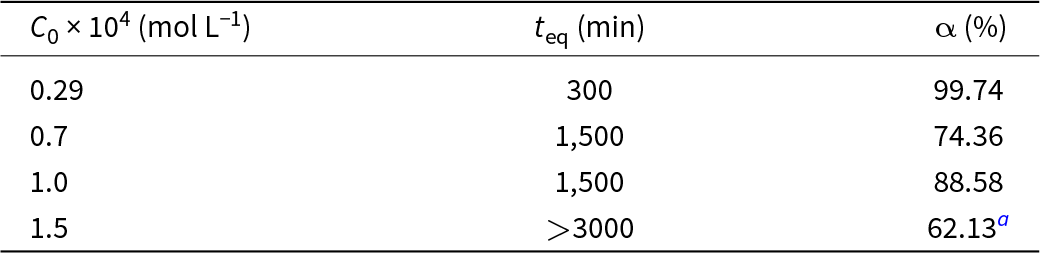
It can be seen in the starting portion of the kinetic curves in Fig. 3 that the At value increases rapidly with time and reaches an equilibrium value (A eq). If C 0 = 0.29 × 10⁻⁴ mol L–1, then within a time of t eq the drug was adsorbed almost completely (Table 1).
Equilibrium time and CA removal level by Hly.

a This value was calculated based on data obtained for an adsorption time of 3000 min.
The initial CA concentration in solution is of great importance for the kinetics of the adsorption process. Therefore, the removal of the drug by Hly was researched at drug concentrations from 0.29 × 10⁻⁴ to 1.5 × 10⁻⁴ mol/L. As can be seen in Fig. 3, with increasing CA concentration in this range, the adsorbed amount of drug increased from ∼25 × 10–6 to 85 × 10–6 mol g–1 at a reaction time of 3000 min. This effect means that the driving force of the adsorption was increased by increasing the initial content of drug in solution.
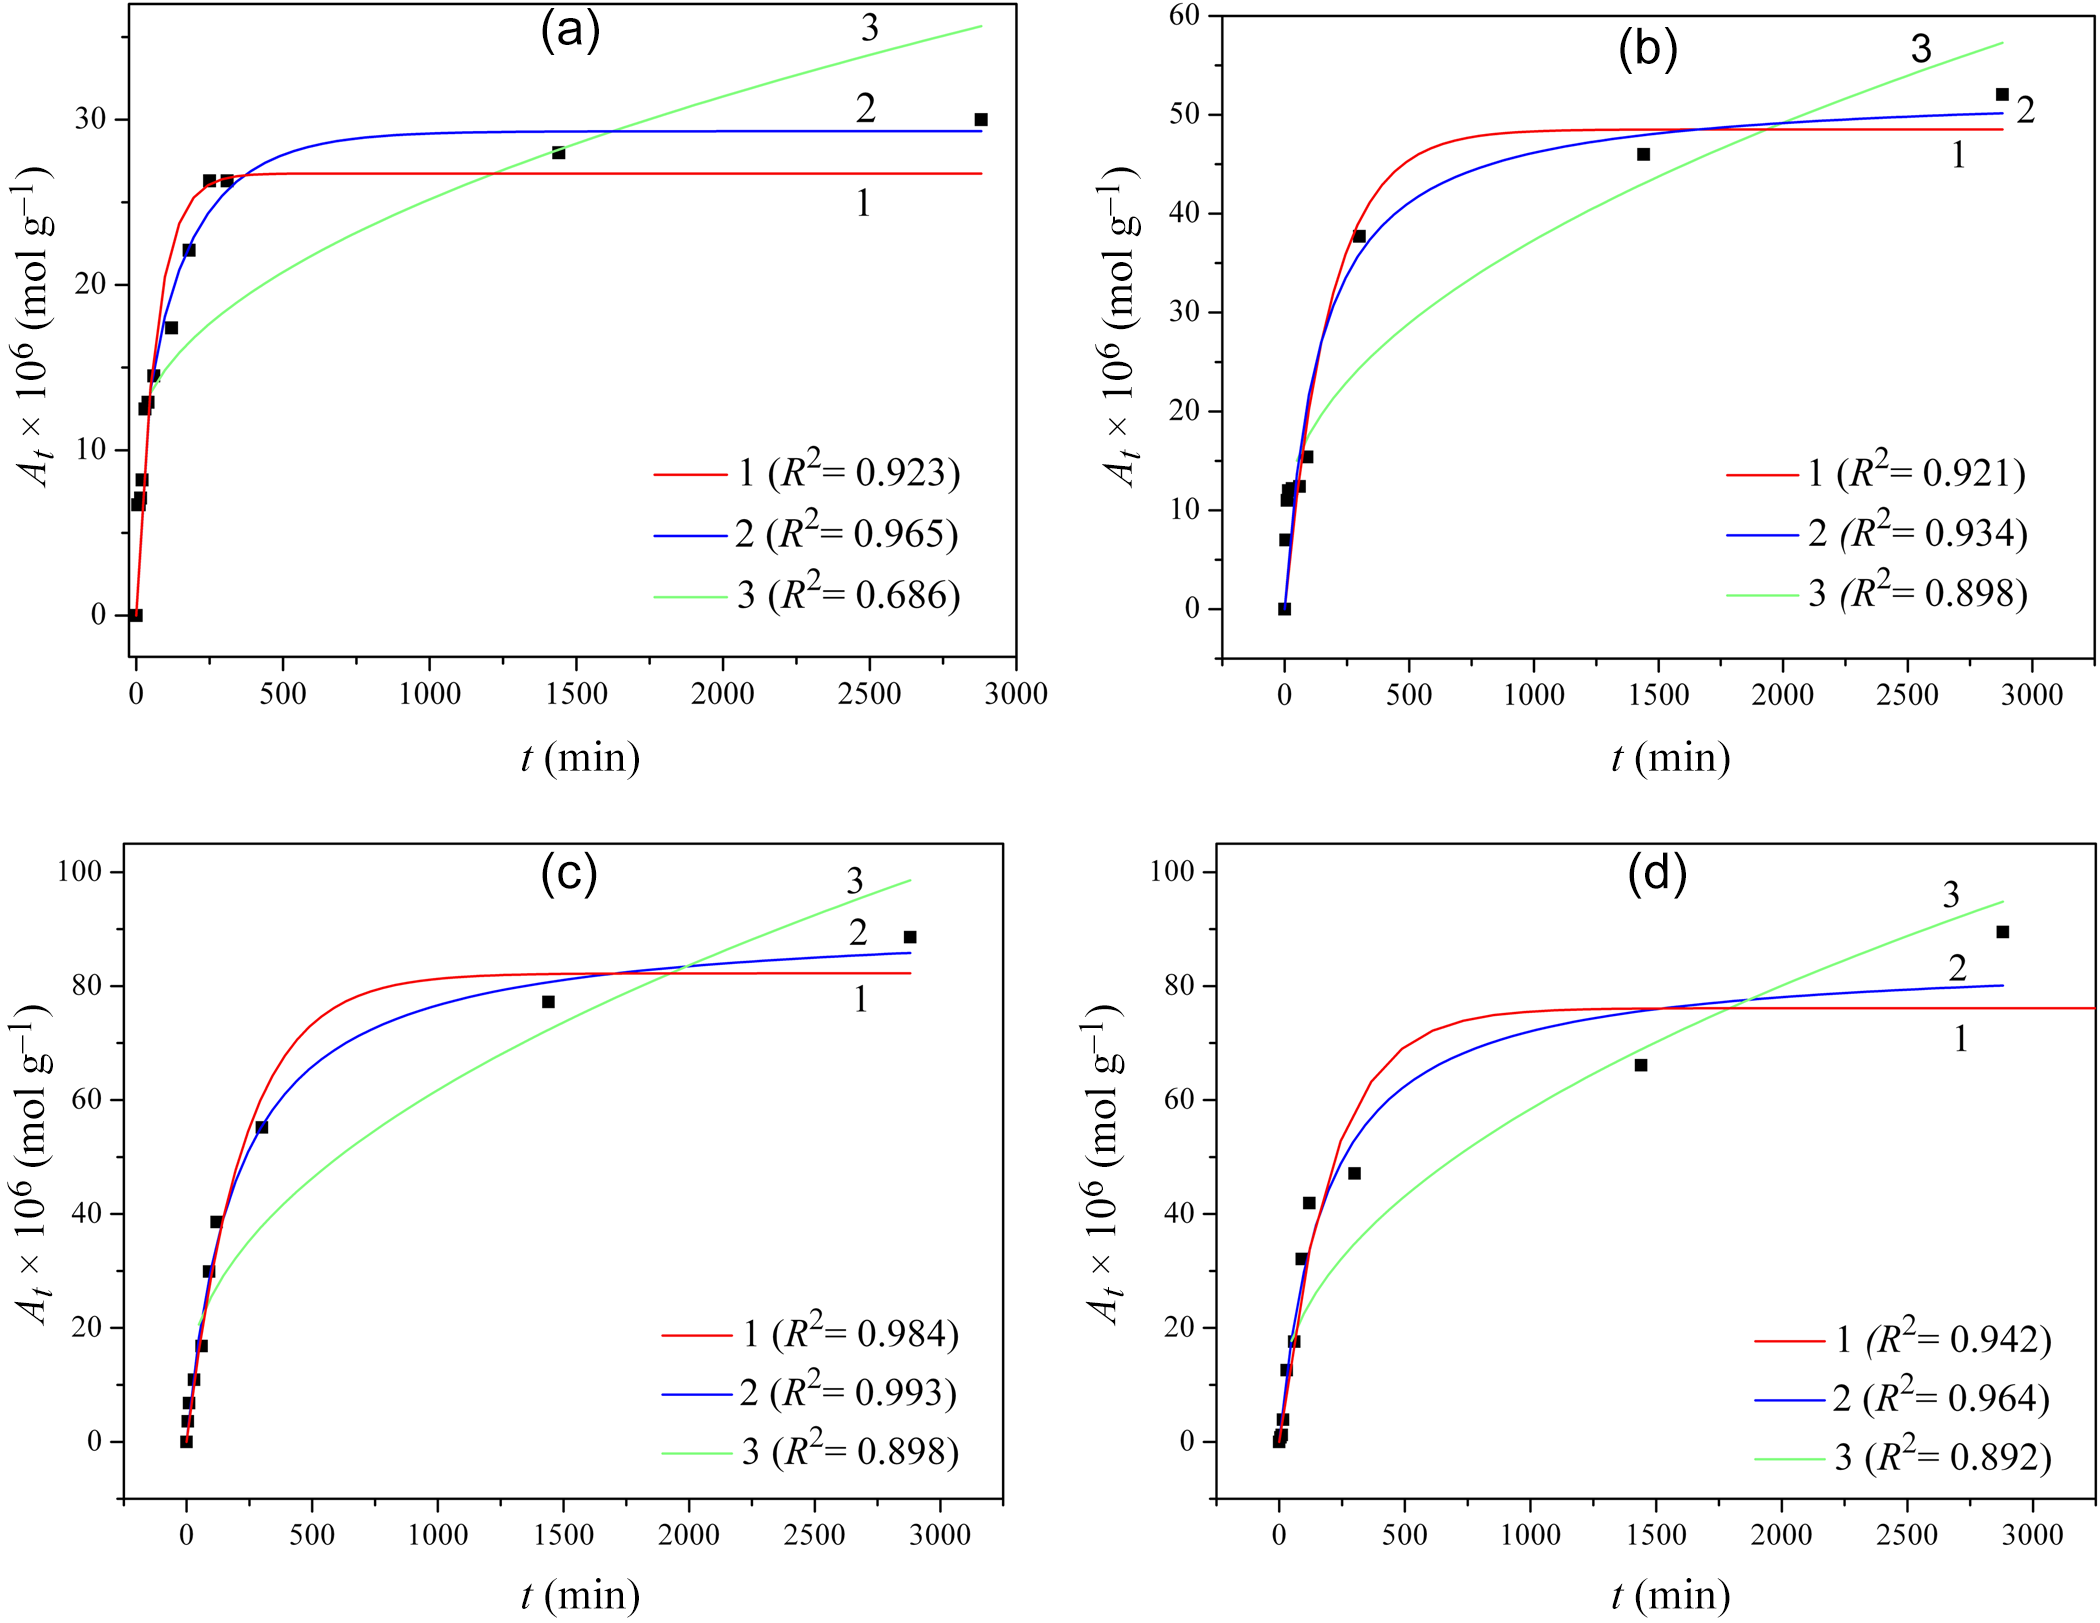
The dynamics and efficiency of the adsorption process are best described in terms of kinetic studies. In the current research, the experimental data were correlated with theoretical adsorption models, namely pseudo-first-order kinetics (Equation 3), pseudo-second-order kinetics (Equation 4) and intraparticle diffusion (Equation 5):
 \begin{equation}{A_t} = {A_{\text{eq}}}\left[ {1 - {\operatorname{e} ^{ - {\text{k}_{\text{1}{\text{t}}}}}}} \right],\end{equation}
where A eq is the equilibrium concentration of CA ions adsorbed, k1 is the rate constant of pseudo-first-order adsorption and 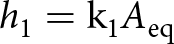 ${h_1} = {\text{k}_{\text{1}}}{A_{{\text{eq}}}}$ is the adsorption process rate at the initial time:
 \begin{equation}{A_t} = {A_{\text{eq}}}\frac{{{\text{k}_{2}}{A_{\text{eq}}}t}}{{1 + {\text{k}_{2}}{A_{\text{eq}}}t}}\end{equation}
where k2 is the rate constant of pseudo-second-order adsorption and 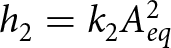 ${h_2} = {k_2}A_{eq}^2$ is the adsorption process rate at the initial time:
 \begin{equation}{A_t} = {\text{k}_{\text{d}}}\sqrt t + g\end{equation}
where kd is the diffusion rate constant and value of g depends on the thickness of boundary layer. To assess the adequacy of the model, we used the determination coefficient R 2.
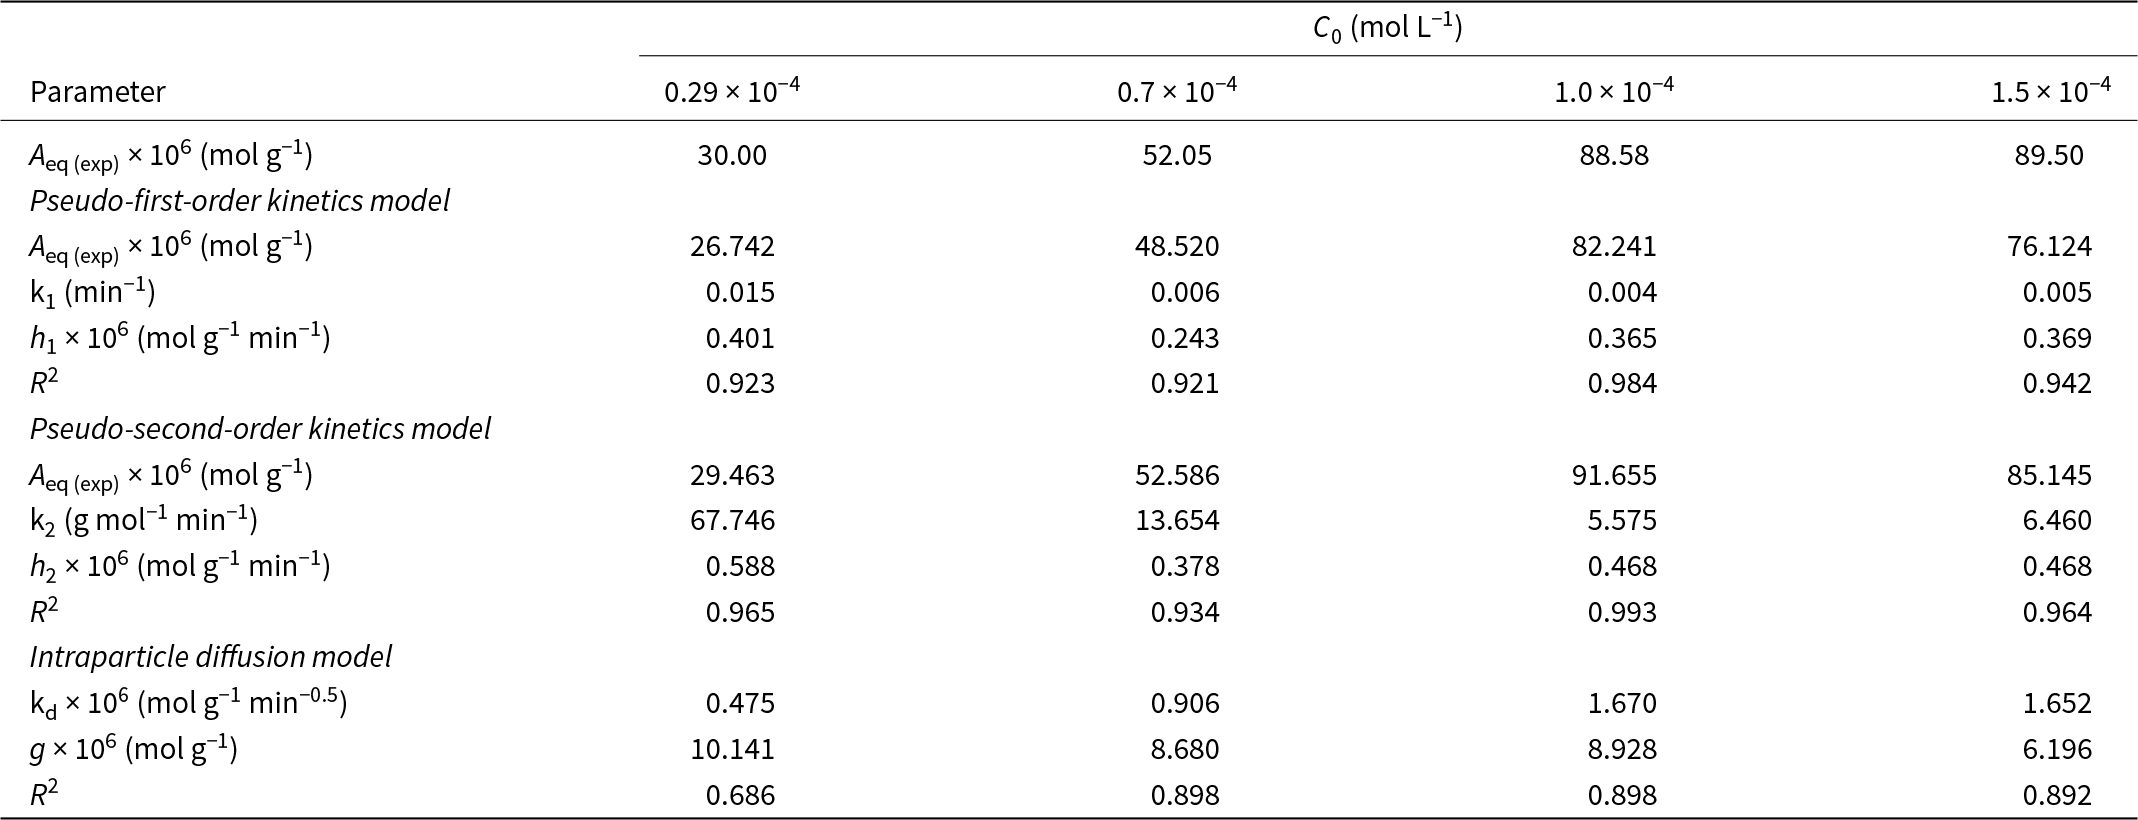
Figure 4 shows experimental data regarding CA adsorption on Hly, as well as the fitting curves corresponding to the listed models. The values of A eq, k1, k2, kd and g estimated using the fitting procedure are given in Table 2.
CA adsorption kinetics onto Hly for different initial drug concentrations: (a) 0.29 × 10⁻⁴ mol L–1, (b) 0.7 × 10⁻⁴ mol L–1, (c) 1.0 × 10⁻⁴ mol L–1 and (d) 1.5 × 10⁻⁴ mol L–1. Experimental data (squares) and different fitting curves are shown: pseudo-first-order kinetics model (1), pseudo-second-order kinetics model (2) and intraparticle diffusion model (3).

Summary for adsorption kinetics of CA onto Hly determined using the various theoretical models.

Table 2 shows that high coefficients of determination (R 2 > 0.96) that are observed when describing the adsorption kinetics using the pseudo-second-order kinetics model (except when C 0 = 0.7 × 10⁻⁴ mol L–1). In addition, the diffusion transport of drug molecules to the Hly surface does not seem to be an important factor in the adsorption process (R 2 < 0.9).
Adsorption isotherm of CA on Hly
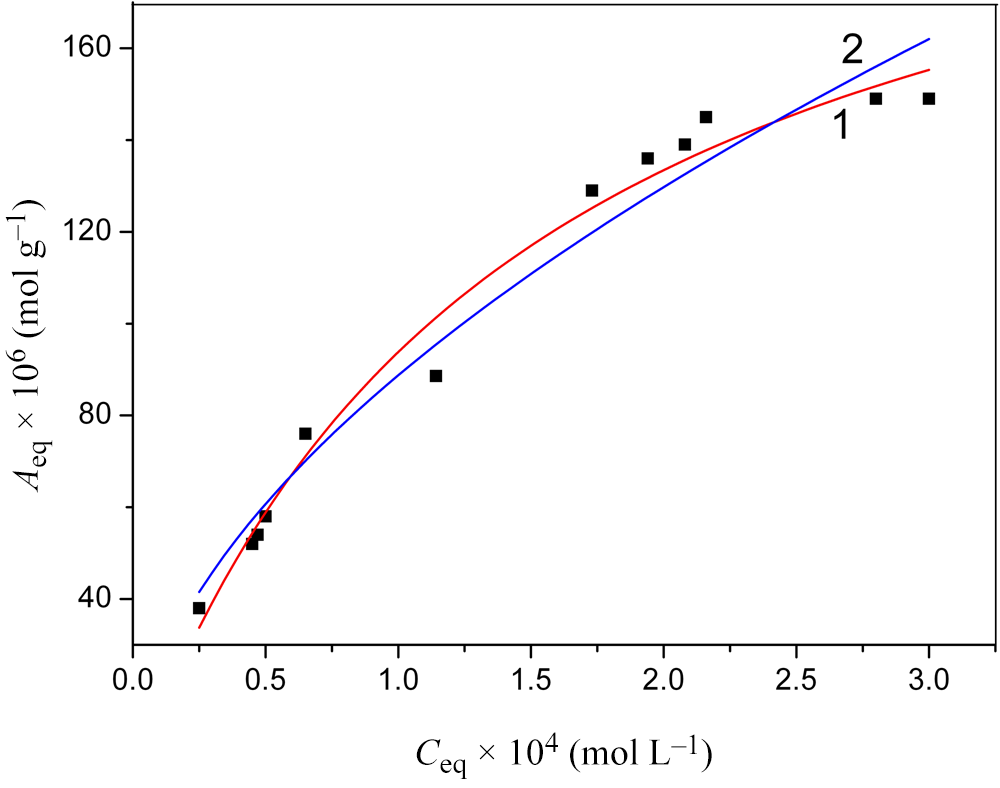
The obtained values of equilibrium concentrations can be used to construct isotherms, which can then be analysed using theoretical concepts. In the current study, we conducted this process for equilibrium CA concentrations in the range of 0.25–3.0 × 10⁻⁴ mol L–1 (Fig. 5).
The CA adsorption isotherm by Hly. Experimental data (squares) and various fitting curves: Langmuir model (1) and Freundlich model (2).

As can be seen from Fig. 5, during CA adsorption by Hly, in the initial section of the isotherm (up to ∼1 × 10⁻⁴ mol L–1), the equilibrium concentration of the drug in the solid phase, A eq, increases almost linearly with the growth of its equilibrium concentration in the solution, C eq (Henry’s law). Such a dependence is caused by there being a sufficient number of adsorption centres on the surface of the adsorbent. However, a further increase in the CA concentration can lead to a deficit of free adsorption centres, which is manifested in the curvature of the isotherm.
For the mathematical description of the obtained isotherm, traditional models were used, such as the Langmuir model (Equation 6) and the Freundlich model (Equation 7):
 \begin{equation}{A_{\text{eq}}} = {A_\text{m}}\frac{{{\text{K}_{\text L}}{C_{\text{eq}}}}}{{1 + {\text{K}_{\text{L}}}{C_{\text{eq}}}}},\end{equation}
where A m is the theoretical maximum adsorption capacity of a monolayer and KL is the Langmuir constant;
 \begin{equation}
{A_{\text{eq}}} = {\text{K}_{\text{F}}}{\left( {{C_{\text{eq}}}} \right)^{1/n}},
\end{equation}
where KF is the Freundlich constant and 1/n is the coefficient of the energetic heterogeneity of the adsorbent’s surface.
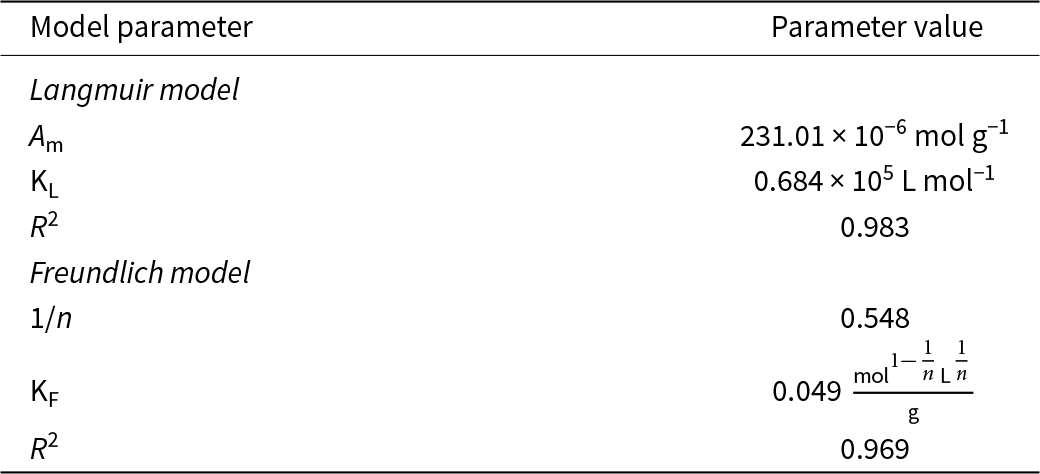
The values of the parameters calculated using these models are listed in Table 3. The presented data indicate that in the considered range of drug concentrations, both models accurately describe the equilibrium adsorption of CA by Hly (R 2 > 0.95). However, it should be noted that the values of maximum adsorption capacity predicted by the Langmuir model differ significantly from those observed experimentally. This is apparently due to the insufficient solubility of CA, such that the corresponding equilibrium concentrations of drug in solution are not achieved.
Parameters of the CA adsorption isotherms by Hly calculated using various mathematical models.

In the following subsections, we describe the changes in the physicochemical characteristics and biological activity of Hly as a result of its modification by CA adsorption.
Physicochemical characteristics of Hly before and after CA adsorption
Granulometric composition
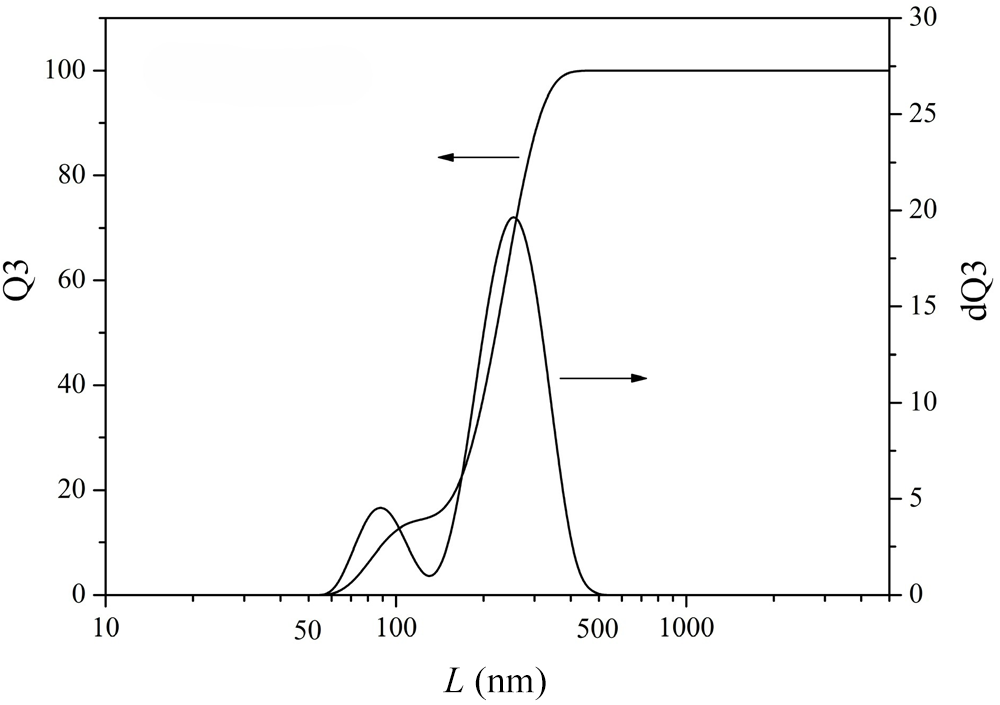
Figure 6 shows the particle-size distribution for Hly obtained using laser diffraction. It can be seen that Hly mainly contains microparticles with sizes in the range of 50–500 nm. The largest fraction is made up of particles with sizes of 200–400 nm.
Particle-size distribution for Hly. Q3(L) is the integral distribution function; dQ3(L) is the differential distribution function. The arrows indicate which vertical axis corresponds to each functions.

Surface morphology and elemental composition
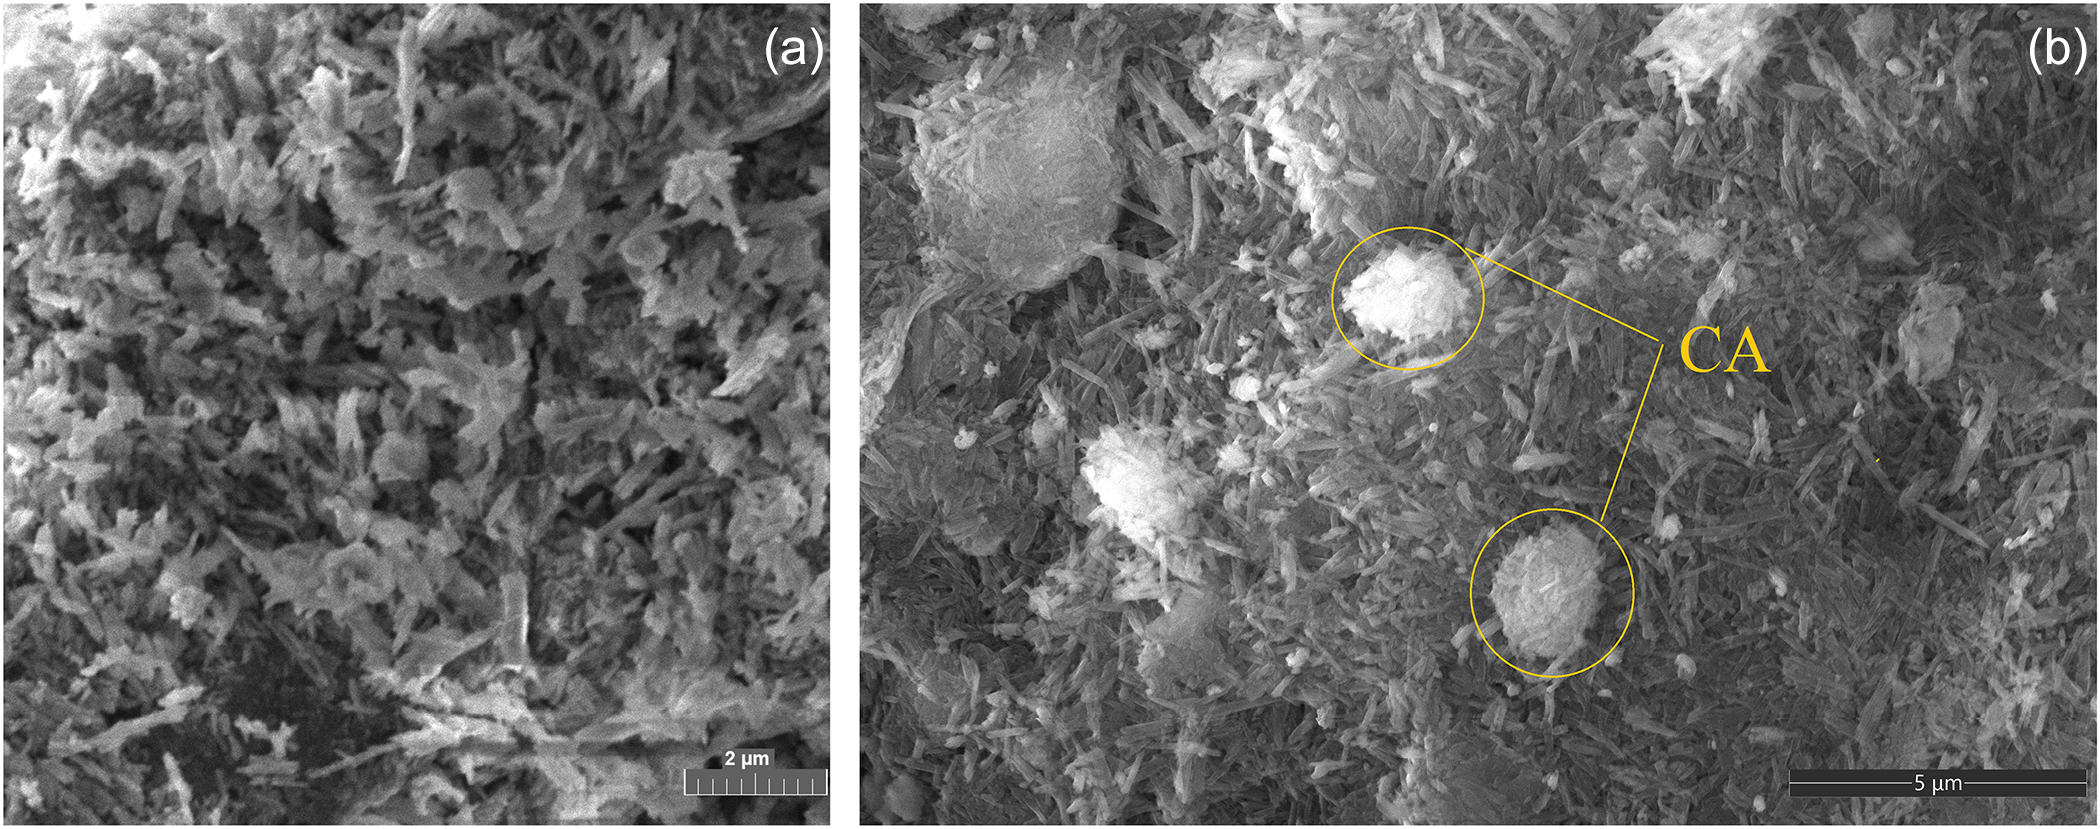
Figure 7 shows SEM images of Hly and Hly after CA adsorption. A SEM image of Hly displays nanoparticles in the form of cylindrical tubes of various sizes and a small amount of agglomerates (Fig. 7a). The length of Hly nanotubes varies widely, from 0.05 to 1.50 µm. These data are consistent with the results from the granulometric analysis (Fig. 6). After the Hly is loaded with the drug, the tubular form of the clay mineral is maintained (Fig. 7b). The SEM image of the sample in Fig. 7b shows aggregates of various morphologies with inclusions of CA.
SEM images of (a) Hly and (b) Hly/CA-1.5.

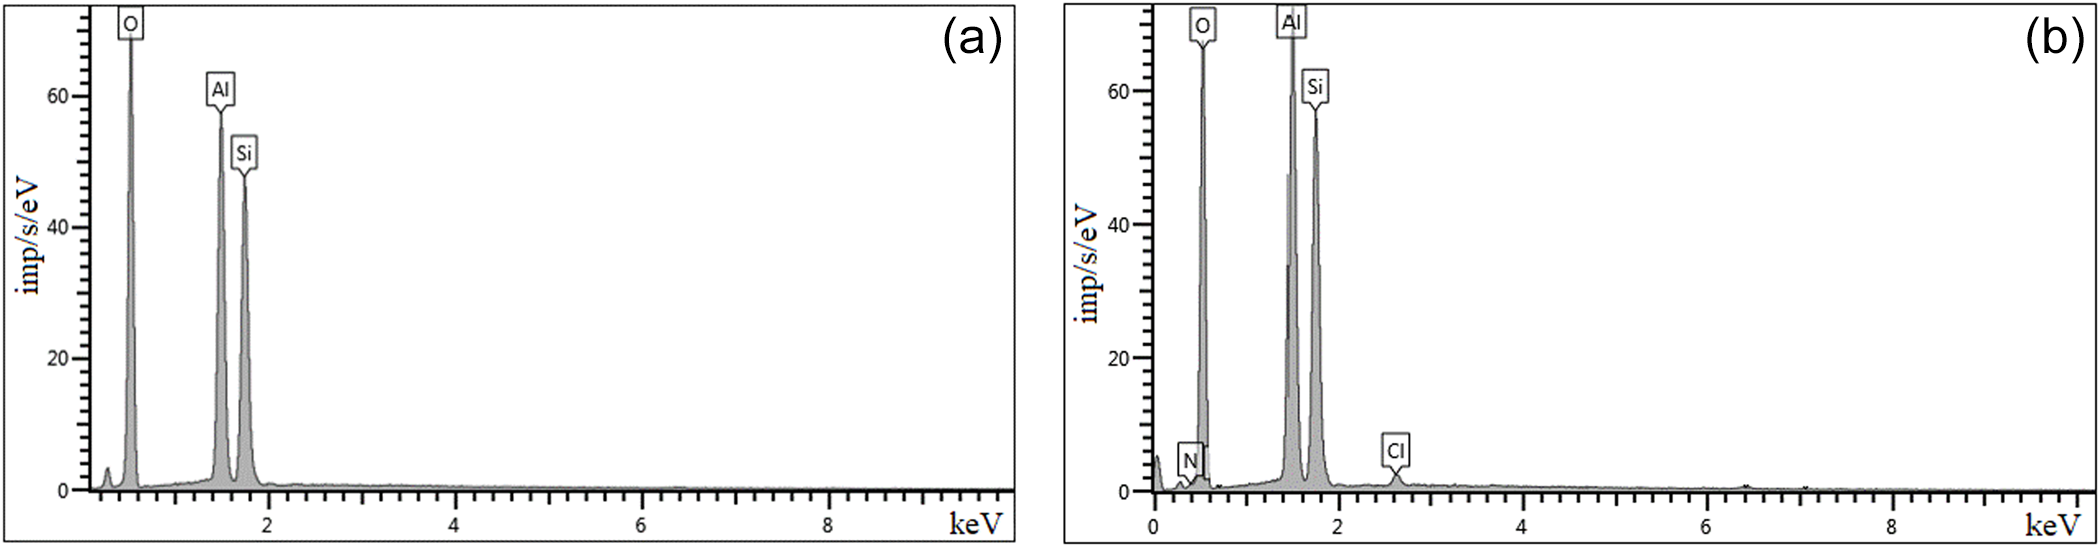
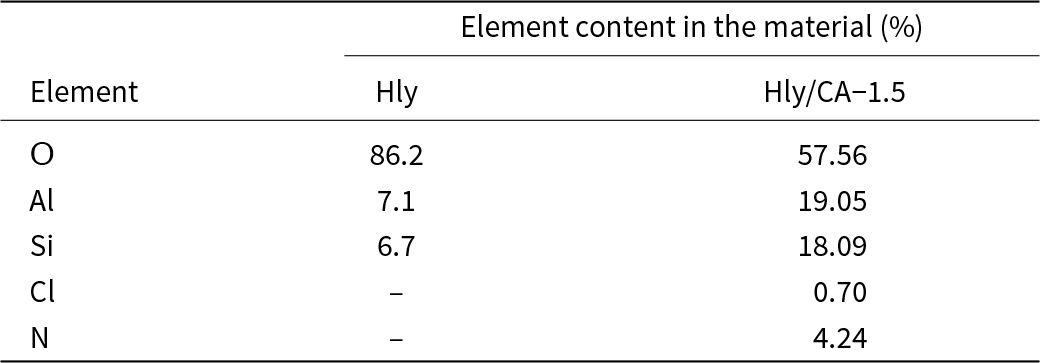
Based on the EDS analysis data, the contents of chemical elements in the surface layers of Hly were determined before and after the adsorption of CA (Fig. 8a,b & Table 4). In the EDS spectra of the studied samples, peaks of oxygen, aluminium and silicon are observed, which are characteristic of the initial Hly. In addition, peaks of nitrogen (4.24%) and chlorine (0.7%), which are contained in CA, appear in the drug-loaded sample.
EDS analysis of (a) Hly and (b) Hly/CA-1.5.

Results of the EDS analysis for the studied materials.

Crystal structure
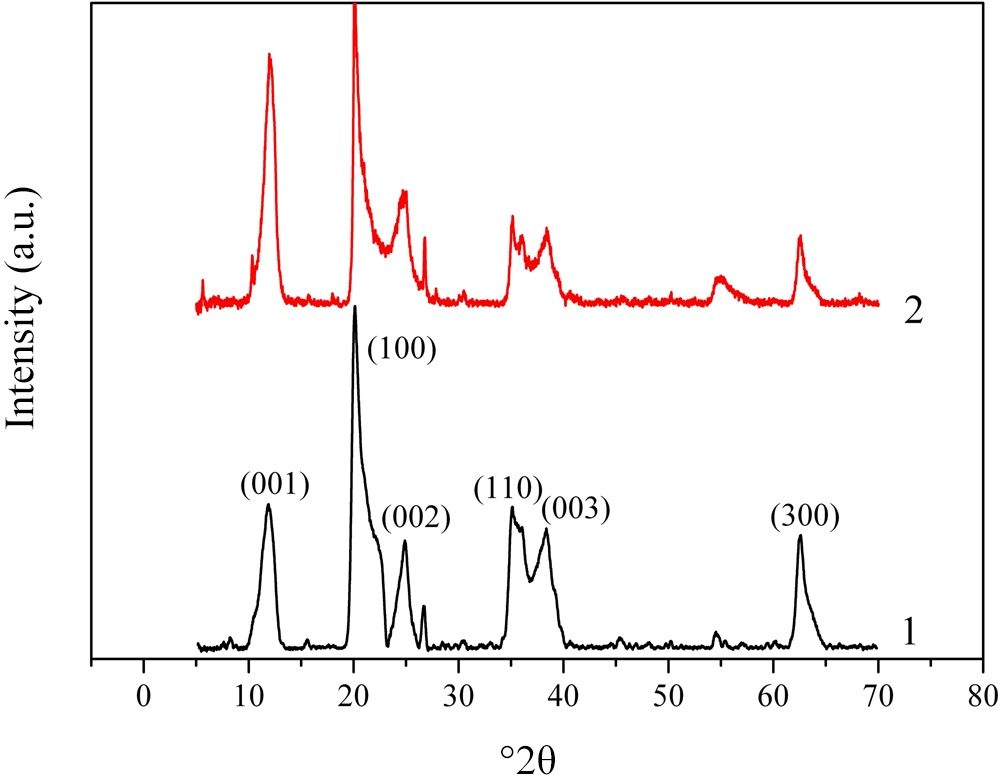
We used XRD to study the crystal structure of the materials under consideration. The XRD traces of both the pristine and CA-loaded Hly are shown in Fig. 9. In the XRD trace of the pristine clay there is a reflection at 11.9°2θ, corresponding to the basal distance d 001 of 0.743 nm. Other peaks at 20.16°2θ, 24.84°2θ, 35.01°2θ, 38.40°2θ and 62.55°2θ correspond to the crystallographic planes (100), (002), (110), (003) and (300), respectively, which also agrees well with data from the literature (Rooj et al., Reference Rooj, Das, Thakur, Mahaling, Bhowmick and Heinrich2010; Rong et al., Reference Rong, Xu, Zhu, Li, Wang and Tang2016). An intense reflection at 20.16°2θ indicates the tubular structure of Hly (Lvov & Abdullayev, Reference Lvov and Abdullayev2013).
XRD traces of Hly (1) and Hly/CA-1.5 (2).

Analysis of the data in Fig. 9 allows us to conclude that there are no significant differences between the XRD traces for the pristine and CA-loaded Hly. For example, for the pristine Hly, the basal distance d 001 calculated for the main reflection (001) using the Bragg formula is 0.751 nm, which differs only slightly from that for Hly/CA-1.5 (0.737 nm). Thus, the process of CA loading does not change the crystal structure of Hly.
Porosity
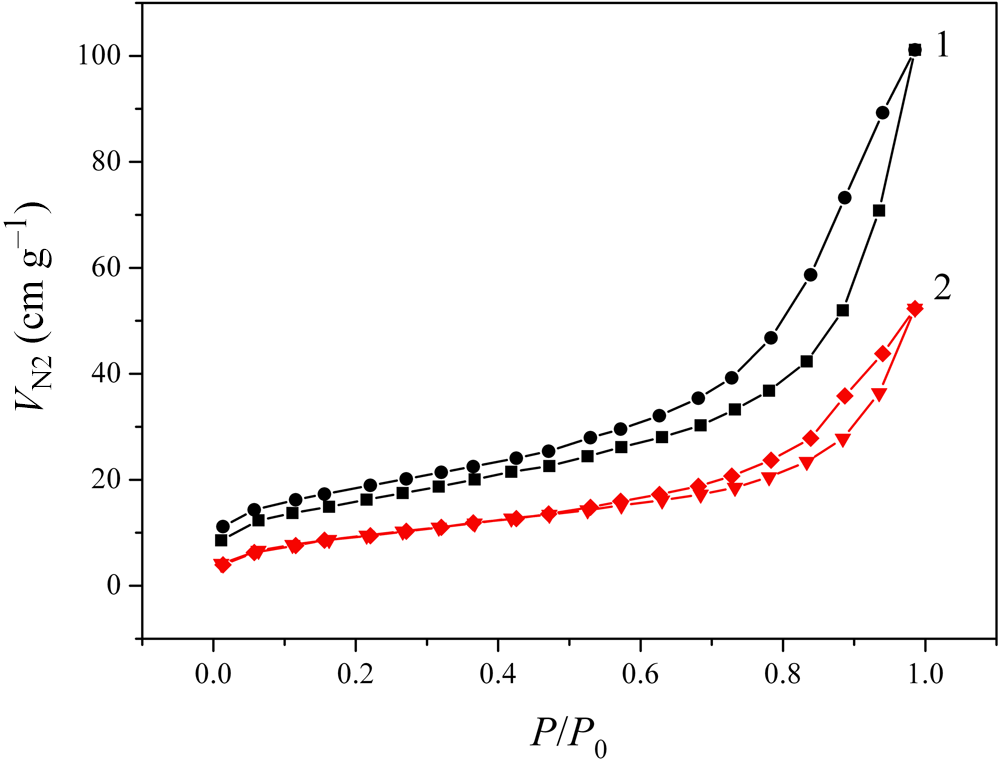
We used the nitrogen adsorption–desorption to assess changes in the porous structure of Hly due to CA loading. It can be seen in Fig. 10 that the appropriate isotherms are almost reversible for pristine Hly, and they are reversible for CA-loaded Hly.
N2 low-temperature adsorption–desorption isotherms for Hly (1) and Hly/CA-1.5 (2). V N2 is the volume of adsorbed nitrogen.

The values of the textural parameters of the materials under study were determined from the analysis of these isotherms using Brunauer–Emmett–Teller (BET), Barrett–Joyner–Halenda (BJH) and non-local density functional theory (NL-DFT) methods (Sing, Reference Sing1998; Aligizaki, Reference Aligizaki2005; Landers et al., Reference Landers, Gor and Neimark2013). The desorption branch of the isotherm was selected for analysis. The thickness of the adsorption layer in the BJH method was estimated using the de Boer equation (Gregg & Sing, Reference Gregg and Sing1982). A cylindrical kernel was used in the NL-DFT evaluation of adsorption and capillary condensation in pores (Landers et al., Reference Landers, Gor and Neimark2013).
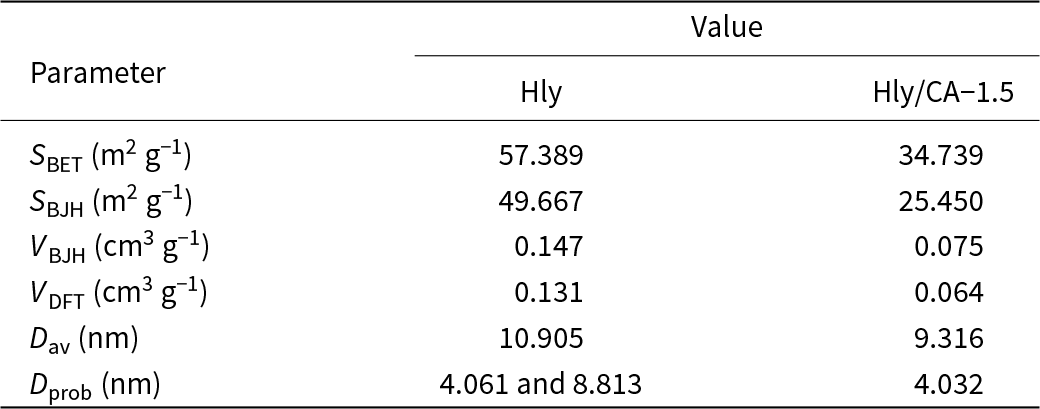
The data obtained are presented in Table 5. These parameters are as follows:
• S BET and S BJH are values of the total surface area determined using the BET and BJH models, respectively.
• V BJH and V DFT are the pore volumes determined using the BJH and NL-DFT methods, respectively.
• D av is the average pore diameter determined using the BJH method.
• D prob is the most probable pore diameter coinciding with maximum in the BJH pore-size distribution.
Summary of porous parameter value data for Hly and Hly/CA-1.5.

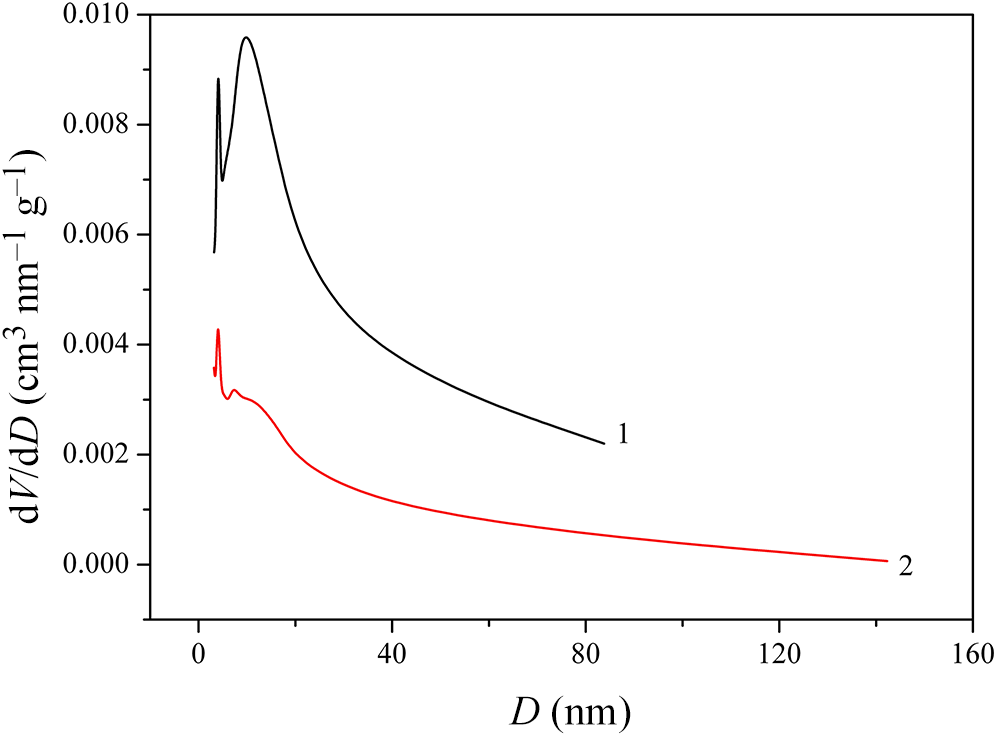
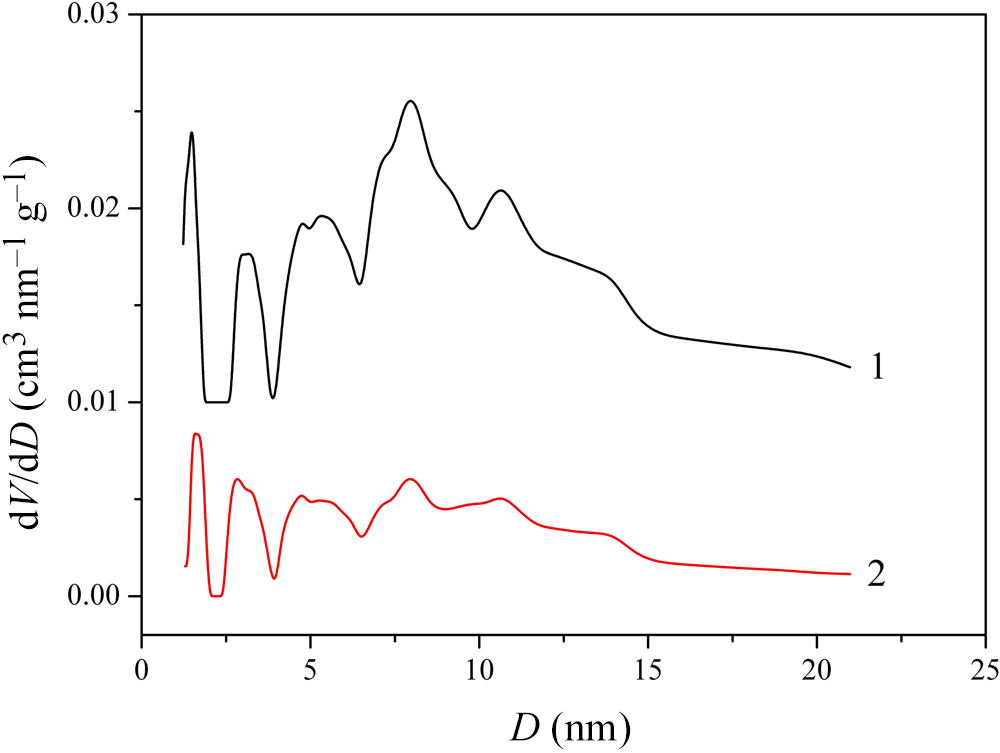
The data presented in Table 5 show that, for the Hly/CA-1.5 sample, both the surface area (S BET and S BJH values) and the pore volume (V BJH and V DFT values) are significantly less than those of the pristine Hly. It can be assumed that the porosity decreased because the Hly lumen was occupied with CA. An analysis of Fig. 11, which shows pore-size distribution curves, confirms this assumption. Mesopores of 7–15 nm in size (peak at 8.8 nm in curve 1 in Fig. 11), which seem to represent the lumen of Hly, are absent from the Hly/CA-1.5 sample (curve 2 in Fig. 11) due to the filling of the lumen with CA.
Pore-size distributions plotted using the BJH model for Hly (1) and Hly/CA-1.5 (2).

In addition, the V BJH and V DFT values are different for both of the materials under study. Unlike the BJH model, the NL-DFT method is based on the fundamental principle of the minimum of the thermodynamic function and can be used for both microporous and mesoporous samples. It provides a more well-reasoned and versatile approach to calculating the pore structure parameters compared to the conventional methods based on the Kelvin equation (Landers et al., Reference Landers, Gor and Neimark2013). When applying this approach, the assumption is that all pores have the same shape and differ only in characteristic sizes.
Figure 12 shows that in the pore-size distribution determined using the NL-DFT method, four groups of pores can be distinguished in the range of 0–10 nm. As can be seen from Fig. 12, for samples of CA-loaded Hly, the maxima corresponding to these groups are three to five times lower than those for the pristine Hly. This also indicates that the pores of the clay material are filled with the drug. In addition, the volume occupied by the narrowest pores decreases less than that observed for the other pores.
Pore-size distributions plotted using the NL-DFT model for Hly (1) and Hly/CA-1.5 (2).

FTIR spectra
FTIR spectroscopy measures the molecular vibrations in the materials under study. In comparison to thermal analysis (see the ‘Thermal stability’ section), in which bulk properties are measured, FTIR spectroscopy determines changes in the molecular structure.
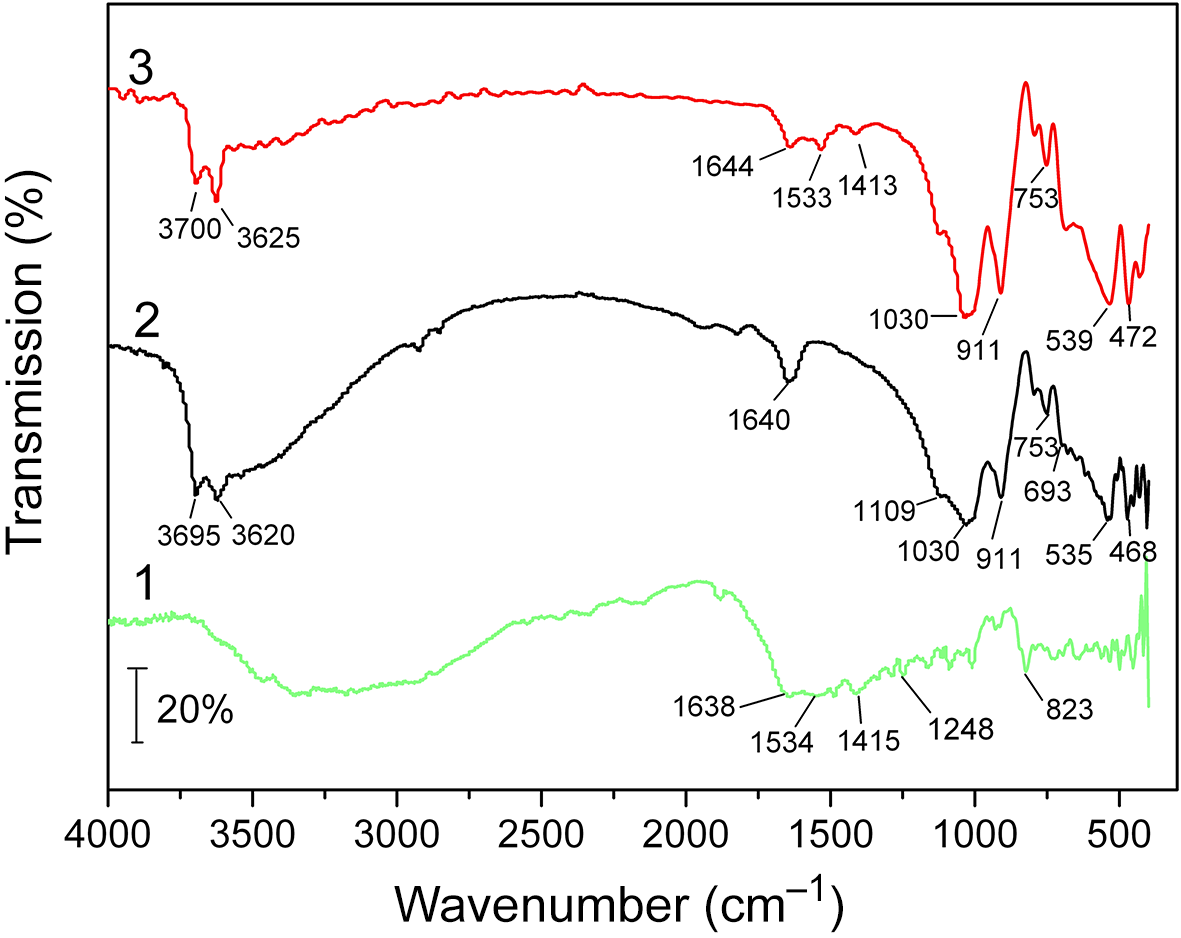
The FTIR spectra of CA, Hly and Hly loaded with CA are given in Fig. 13. The spectrum of CA (Fig. 13, trace 1) contains an intense broad band in the range of 3700–2600 cm–1, characterizing the stretching vibrations of the N–H bond of the amine and imine groups, vibrations of the ν(OH) groups of adsorbed water and asymmetric and symmetric vibrations of the C–H groups (Samlíková et al., Reference Samlíková, Holešová, Hundáková, Pazdziora, Jankovič and Valášková2017).
FTIR spectra of CA (1), Hly (2) and Hly/CA-1.5 (3).

A wide band in the range of 1800–800 cm–1 indicates the presence of overlapping bands due to the stretching vibrations of the C=N group, bending vibrations of water (1638 cm–1) and asymmetric and symmetric stretching vibrations of COO acetate groups (1534 and 1415 cm–1). Bands at 1248 and 823 cm–1 are due to stretching vibrations of the C–N bond of secondary aromatic amines, C–Cl stretching vibrations of aromatic halogen compounds, C–H out-of-plane deformation vibrations of aromatic rings and C–H rocking deformation vibrations of methylene groups (Silverstein et al., Reference Silverstein, Bassler and Morrill1991; Călinescu et al., Reference Călinescu, Negreanu-Pîrjol, Georgescu and Călinescu2010).
In the FTIR spectrum of Hly (Fig. 13, trace 2), the absorption bands at 3695 and 3620 cm–1 characterize the stretching vibrations of the Al–OH group. The band at 1640 cm–1 can be attributed to deformation vibrations of adsorbed water. Bands with maxima at 1030 and 1109 cm–1 correspond to symmetric stretching vibrations of the Si–O–Si tetrahedra. The peak at 911 cm–1 corresponds to bending vibrations of the Al–OH bonds in Hly (Zhang et al., Reference Zhang, Li, Zhang, Ding, Wang, Liu and Zhang2019). Deformation vibrations of the Si–OH silanol groups appear at 753 cm–1. The absorption band at 693 cm–1 characterizes the stretching vibrations of Si–O–Al groups, and the bands at 535 and 468 cm–1 correspond to the bending vibrations of the Si–O–Al and Si–O–Si groups, respectively (Jing et al., Reference Jing, Chai, Huang, Tang, Guo and Wang2017).
Analysis of the FTIR spectrum of Hly loaded with drug is difficult due to the superposition of the characteristic bands of the clay mineral and CA. However, in the FTIR spectrum of Hly after CA adsorption, there are changes in the contours and intensities of the absorption bands in the range of 3800–3500 cm–1 (Fig. 13, trace 3), corresponding to the stretching vibrations of Al–OH groups in Hly. In addition, there are shifts in the absorption bands at 3695 and 3620 cm–1 (by 5 cm–1) to the high-frequency region compared with the spectrum of the pristine Hly. The appearance of absorption bands at 1533 cm–1 in the spectrum of Hly loaded with CA is associated with asymmetric stretching vibrations of acetate groups (COO) in CA. The peak at 1644 cm–1 is due to the overlap of the bands corresponding to the vibrations of the adsorbed water of Hly and the stretching vibrations of the C=N group in CA. The band at 911 cm–1 was ascribed to the O–H bending vibrations of the inner Al–OH groups of Hly.
In the spectrum of the composite, compared to Hly, a shift of the band at 753 cm–1 (by 5 cm–1) is observed, which can be attributed to deformation vibrations of the Si–OH silanol groups. In addition, the bands at 535 and 468 cm–1 are shifted (by 4 cm–1) towards higher wavenumbers, which correspond to the bending vibrations of the Si–O–Al and Si–O–Si groups, respectively (Jing et al., Reference Jing, Chai, Huang, Tang, Guo and Wang2017).
Such changes in the spectrum of Hly after CA adsorption suggest that the adsorption of the drug occurs as a result of the electrostatic interaction of the functional hydroxyl groups of Hly with the NH groups in CA through the formation of hydrogen bonds.
Thermal stability
The thermal stability of pristine Hly and CA-loaded Hly at high temperatures was studied using TG analysis.
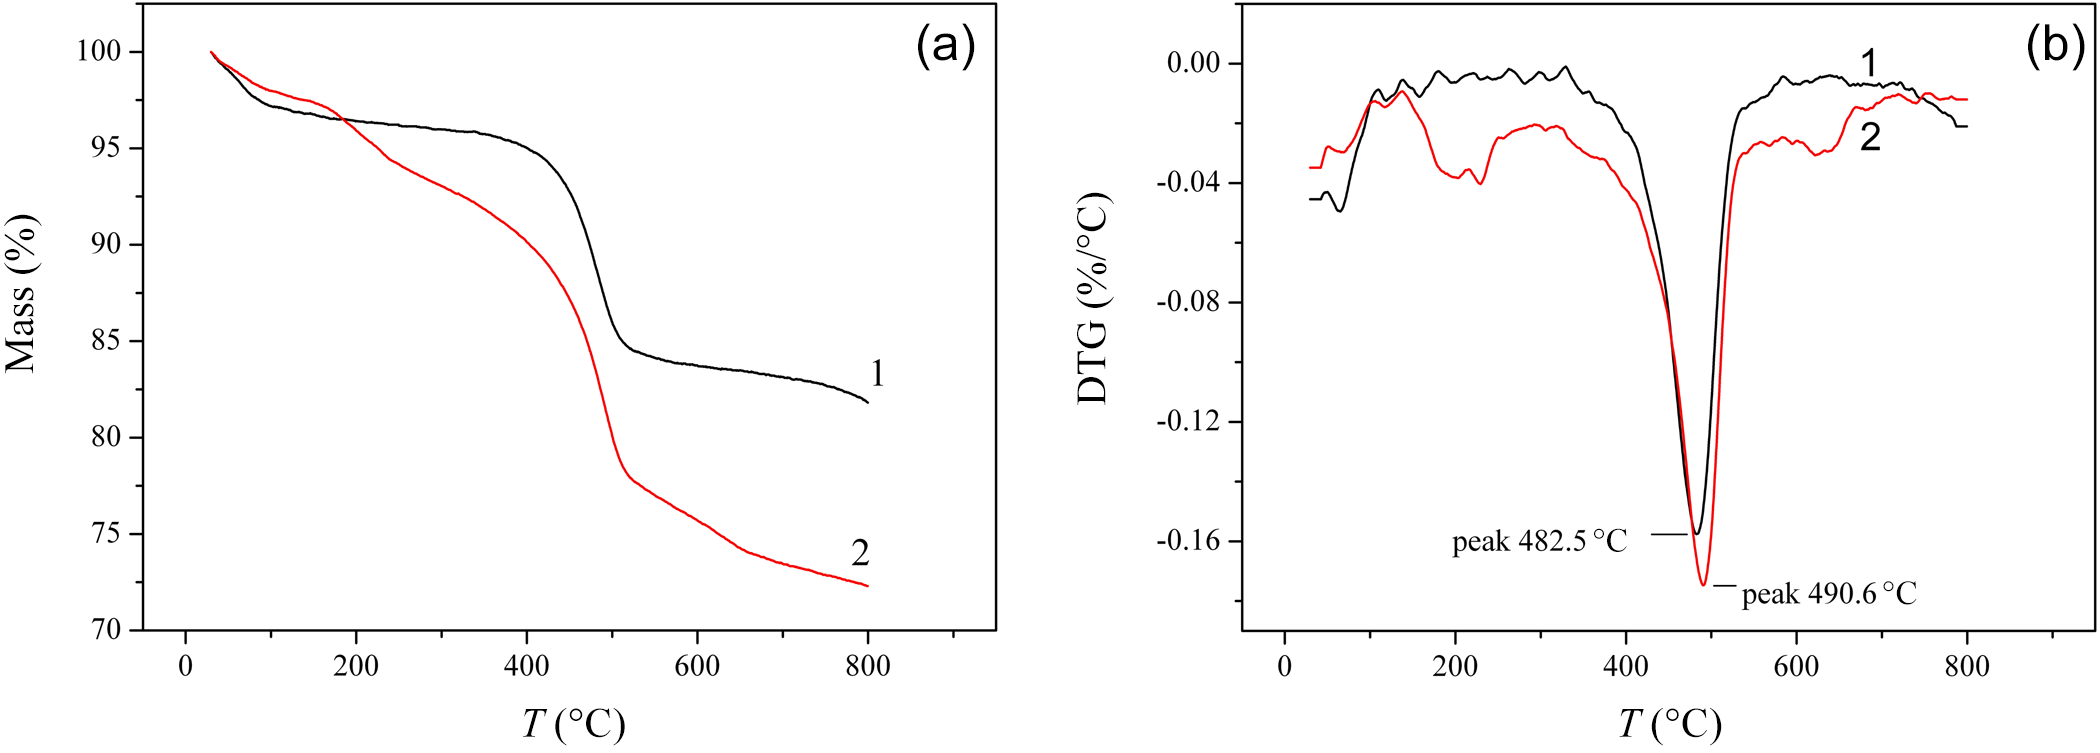
According to the TG and differential thermogravimetry (DTG) curves (Fig. 14a,b), the mass loss for pristine Hly was realized in two steps. In the first step (50–350°C), the mass reduction in the sample did not exceed 4%, and, evidently, this was caused by the loss of the surface adsorbed water and the gradual removal of the residual interlayer water. The second step of thermal decomposition (peak at 482.5°C) seems to be associated with the dehydroxylation of the structural aluminol groups. This assumption is consistent with the data from Joussein et al. (Reference Joussein, Petit, Churchman, Theng, Righi and Delvaux2005), who reported that the dehydroxylation of Hly occurs at ∼450–600°C.
(a) TG and (b) DTG curves for pristine Hly (1) and Hly/CA-1.5 (2).

The TG curve describing the mass loss of the Hly/CA-1.5 sample in the studied temperature range has a more complex form compared to that of the pristine Hly. In the temperature range of 50–350°C, the aforementioned removal of water is accompanied by the melting and evaporation of adsorbed CA. The highest rate of thermal decomposition for the Hly/CA-1.5 sample is observed at 490.6°C, which is shifted by more than 8°C compared to that of the pristine Hly. The mass loss at higher temperatures is related to the oxidation of residual drug.
Antimicrobial properties of Hly before and after CA adsorption
It was noted earlier that the loading of a clay mineral with a drug can result in improved antimicrobial activity.
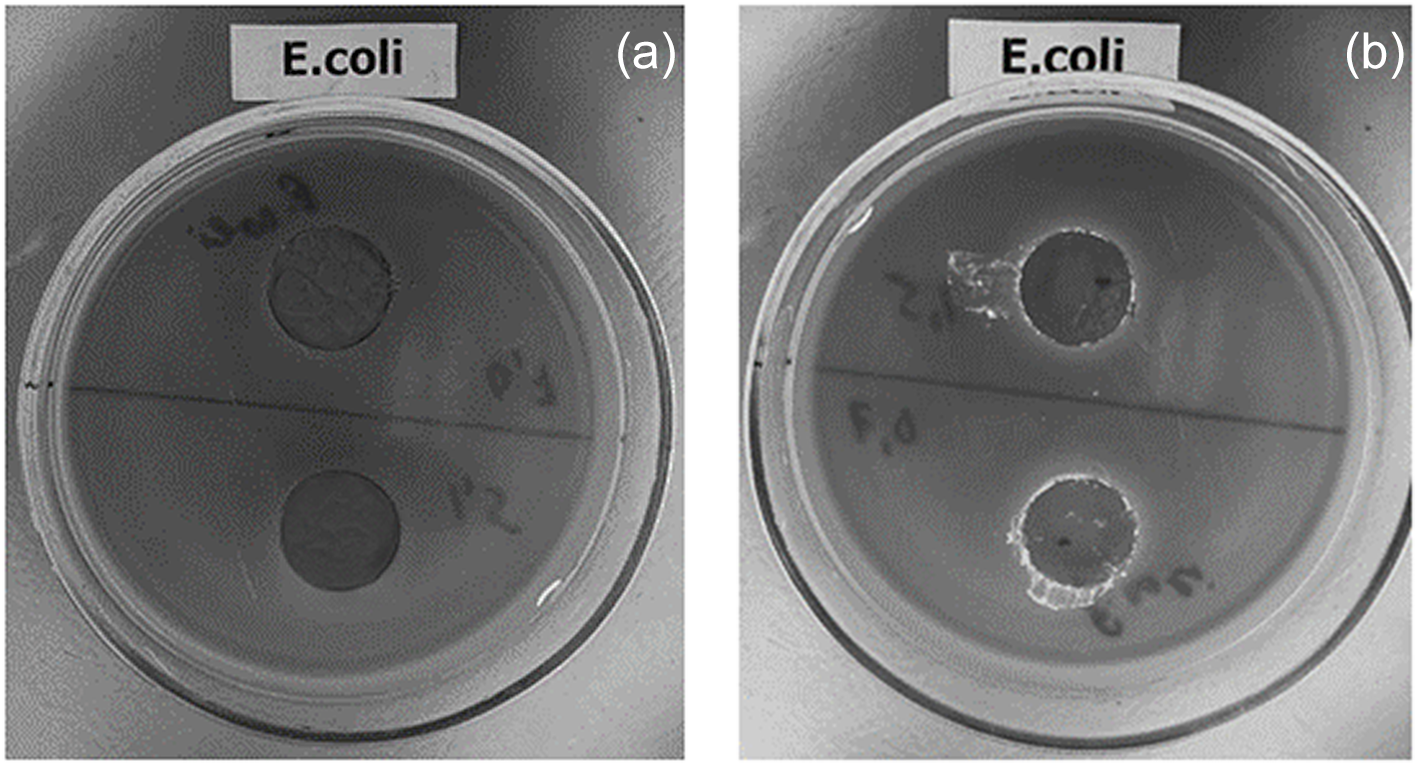
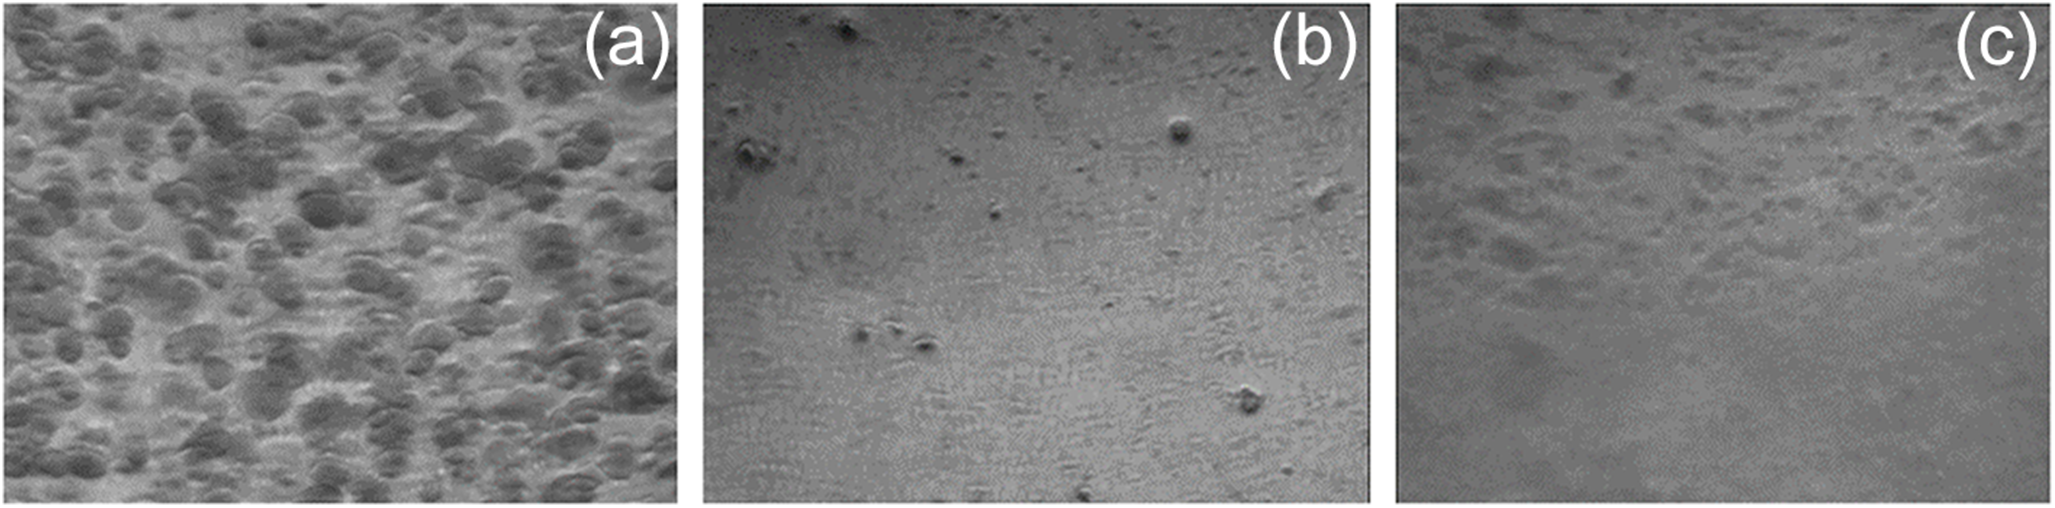
In the current study, we have tested the antimicrobial activity against E. coli of both initial Hly samples and those after CA adsorption. The results are shown in Figs 15 & 16. Figure 15a demonstrates the absence of a lysis zone around samples of the pristine Hly. A similar picture is observed for clay samples after adsorption from solutions with an initial CA concentration of 0.7 × 10⁻⁴ mol L–1. However, there is a distinct zone of lysis when the initial CA concentration is 1.5 × 10⁻⁴ mol L–1 (Fig. 15b), which indicates the antimicrobial effect of Hly loaded with CA. Note that the drug concentration in the Hly/CA-1.5 sample was ∼85 × 10–6 mol g–1 (Fig. 3).
Photographs showing the lysis zone for E. coli on Endo agar medium. Samples: (a) Hly (top half) and Hly/CA-0.7 (bottom half); (b) Hly/CA-1.5 (both top and bottom halves).

The results obtained are fully consistent with the images of cross-sections of the nutrient medium containing E. coli bacteria (Fig. 16a–c). As can be seen, the number of colonies under samples of the CA-loaded Hly (Fig. 16b,c) is much less than in the absence of such samples (Fig. 16a). Thus, Hly loaded with CA has antimicrobial activity against E. coli M-17 bacteria.
Photographs demonstrating the viability of E. coli cultures in Endo agar medium: (a) control conditions; (b) under Hly/CA-0.7 sample conditions; (c) under Hly/CA-1.5 sample conditions.

It should be noted that the data obtained in the current study are consistent with the previous results reported by Jou & Malek (Reference Jou and Malek2016) on the antibacterial activity of CA–kaolinite structures (Hly is similar in composition to kaolinite but has a greater water content). Using the disc diffusion test, these authors found that CA–kaolinite generated a clear zone of lysis around the assessed granule, whereas unmodified kaolinite showed no antibacterial activity against E. coli. According to Jou & Malek (Reference Jou and Malek2016), the observed antibacterial activity is caused by the electrostatic attraction between the chlorhexidine cations and the negatively charged bacterial cells. This leads to CA adsorption on the cell walls of the microorganisms and disruption of the integrity of their cell membranes.
Conclusion
In this study, the removal of CA, an antiseptic drug, from aqueous media using a Hly nanoclay has been reported. It has been established that during adsorption from solutions with an initial CA concentration of 0.29 × 10⁻⁴ mol L–1, the removal degree reached 99.74% after 300 min. This demonstrated Hly to be a potential adsorbent for the removal of antiseptic drugs from real wastewaters. The adsorption kinetics were in good agreement with the pseudo-second-order kinetic equation. The Langmuir and Freundlich models described well the equilibrium adsorption of CA by Hly. The crystal structure, surface morphology, textural characteristics and thermal stability of pristine Hly and CA-loaded Hly were characterized using a number of physicochemical research methods. It was found that during the adsorption of the drug, the surface area and volume of the pore space decrease due to the filling of the Hly pores. Based on the bioactivity tests, it has been demonstrated that Hly loaded with CA can be used as antimicrobial material against E. coli bacteria. We hope that the obtained data on the antibacterial effects of Hly–CA composites will be used to develop future biomedical applications.
Author contributions
OVA conceptualized the study, carried out data curation and wrote the original manuscript draft. AVN contributed to and finalized the manuscript draft. DNY carried out the methodology and validation. AVA coordinated the study. All authors have read and approved the final manuscript.
Acknowledgements
SEM-EDS, XRD and FTIR measurements were performed at the centre for the joint use of scientific equipment The Upper Volga Region Centre of Physico-chemical Research.
Financial support
None.
Competing interests
The authors declare none.
Data availability
Experimental data from this study are available upon reasonable request.
Ethical standards
Not applicable.
Consent to participate
Not applicable.