Introduction
Accelerated retreat and break-up of ice shelves has been observed on the southwestern and northern sections of the Antarctic Peninsula (AP) over the last two decades, associated with pronounced regional atmospheric warming (Reference KingKing, 1994; Reference Vaughan and DoakeVaughan and Doake, 1996; Reference Skvarca, Rack, Rott, Ibarzabal and DonangeloSkvarca and others, 1998). Prolonged melt seasons and the formation of extended meltwater streams and ponds amplify the disintegration of ice shelves (Reference Scambos, Hulbe, Fahnestock and BohlanderScambos and others, 2000; Fahne-stock and others, 2002). On the western AP, major retreat took place at the Wordie, Wilkins and George VI ice shelves, starting in the early 1970s and accelerating after 1985 (Reference Doake and VaughanDoake and Vaughan, 1991; Reference Lucchitta and RosanovaLucchitta and Rosanova, 1998). The intense retreat phase of the Larsen Ice Shelf (LIS) on the northeastern AP started later, but was subject to more rapid decay than ever observed before (Reference Rott, Skvarca and NaglerRott and others, 1996).
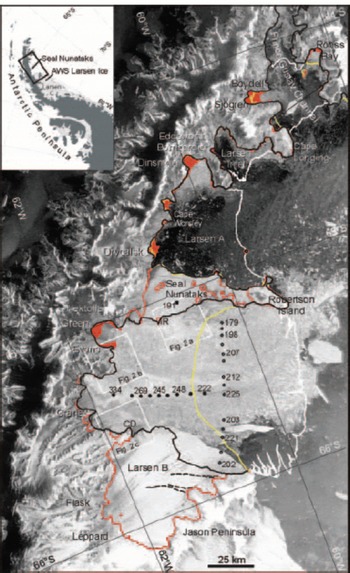
According to the mass input and flow behaviour, the northern LIS can be separated into five sections (Fig. 1). The first section that disappeared completely was the ice shelf in Larsen Inlet, breaking away between March 1986 and November 1989 (Reference SkvarcaSkvarca, 1993; Reference Skvarca, Rack and RottSkvarca and others, 1999). After several years of retreat, the ice shelf between Seal Nunataks and Sobral Peninsula, called Larsen A, and the ice shelf in Prince Gustav Channel disintegrated almost completely in early 1995. About 1600 km2 of Larsen A broke into hundreds of small, elongated icebergs (Reference Rott, Skvarca and NaglerRott and others, 1996, Reference Rott, Rack, Nagler and Skvarca1998), similar to the event observed in March 2002 on Larsen B. The ice-shelf section around Seal Nunataks, now covering an area of about 900 km2, showed little change of area up to late 2002. In summer 2003, major rifts widened along its northern boundaries. As this narrow strip of ice shelf is now confined by ocean in the north and south, it can be expected to disappear within the next few years.
The paper is organized as follows: First a short description of field and satellite observations prior to the collapse of Larsen B is presented. This is followed by a detailed analysis of the break-up event in March 2002. Finally the changes of grounded and floating ice after the disintegration events in 1995 and 2002 are analyzed.
Changes of Larsen B Before the Disintegration Event
Field observations
Disturbances of the mass balance and changes in ice-flow behaviour were observed several years before the rapid disintegration event. Stake measurements showed a decrease of net surface balance since the 1980s, switching to negative values on the northern parts of Larsen B during the 1990s due to prolonged periods of surface melt (Reference Rott, Rack, Nagler and SkvarcaRott and others, 1998). Another indication of change was the increase of ice velocity after the calving event in 1995, which amounted to about 10% at the longitudinal T-profile in the central part between the measurements in 1996 and 1999, and the opening of rifts approximately parallel to the front (Reference RackRack, 2000; Reference Rack, Doake, Rott, Siegel and SkvarcaRack and others, 2000).
Measurements of the surface height by differential global positioning system (GPS) and of the surface mass balance for the period 1997–99 were used to estimate the bottom melting of the ice shelf. At 16 stake positions (8 and 3 stakes at the T- and S-profile, respectively, and 5 stakes on the ice-shelf section of Seal Nunataks; Fig. 1) the mean surface mass balance was 0.06 ± 0.12 ma–1. The change of ice thickness, calculated from tide-corrected heights of stake tops assuming removal of pure ice, was –2.1 ± 1.1 ma–1. Strain thinning accounts for up to 10% of the total thickness change at the T- and S-profile, and is negligible at Seal Nunataks (Reference RackRack, 2000; Reference Rack, Doake, Rott, Siegel and SkvarcaRack and others, 2000). The thickness change during the 2 year period suggests a strong overall thinning of the ice shelf due to bottom melting, possibly caused by changes of ocean currents and heat exchange after disintegration of Larsen A and retreat of the ice front of Larsen B.
Satellite observations
After steady seaward advance of the ice front between 1962 and 1995 (Reference Skvarca, Rack and RottSkvarca and others, 1999; Reference RackRack, 2000), Larsen B lost 2320 km2 in area at the end of January 1995 by calving a tabular iceberg covering 1720 km2, together with a large number of smaller icebergs. The retreat of Larsen B from 1995 to October 2000 was analyzed by Reference Rott, Rack, Nagler and SkvarcaRott and others (1998, Reference Rott, Rack, Skvarca and De Angelis2002) and Reference Skvarca, Rack and RottSkvarca and others (1999) using synthetic aperture radar (SAR) images of the European Remote-sensing Satellites ERS-1 and -2. Between 30 January 1995 and 25 April 1998 the ice-shelf area decreased by 170 km2, mainly along the northern and central frontal sections. Though the overall retreat was not very significant, it indicated a change compared to the previous pattern of multi-year advance following large calving events.
Major calving occurred in November 1998 all along the ice front between Robertson Island and Jason Peninsula, amounting to a loss of 1190 km2 in area. This resulted in a crescent shape of the front which already indicated an irreversible retreat, as predicted by the model analysis of ice-shelf configuration and strain-rate pattern by Reference Doake, Corr, Rott, Skvarca and YoungDoake and others (1998). Up to October 2000, the area decreased by another 1000 km2, whereas in summer 2000/01, when the temperatures were below average, the ice shelf showed little change. The disintegration event in summer 2002 took place after several weeks of unusually high temperatures, as known from the automatic weather station (AWS) Larsen Ice (Fig. 1).
Envisat ASAR wide-swath image, 18 March 2002, showing the area of the northern LIS and the disintegrating Larsen B. White/yellow/black line: ice edge in March 1986/October 2000/April–May 2003. Retreated grounded areas are shown in red. The grounding line (red) is derived by ERS SAR interferometry, for sections that disintegrated before October 1995 from the ice edge. Selected stake positions at longitudinal T- and transverse S-profile (filled and open circles, respectively) and one position near Seal Nunataks (square) are shown with ice thicknesses measured in 1997. Boxes show positions of Figure 2 a–c.

Two ERS-1/-2 SAR image pairs of satellite track 424, acquired on 31 October/1 November 1995 and 9/10 November 1999, were used for the interferometric analysis. The grounding line was determined manually from the differential interferogram 1995/99 at the inland margin of the tidal flexure zone. Extensive rifting was observed along the inland boundaries of Larsen B and in the shear zones towards the ice shelf of Seal Nunataks. Figure 2 shows three sections of the 1999 interferogram. For ERS SAR, a phase shift of 2π (one ‘fringe’) corresponds to a horizontal displacement of about 7.2 cm or a vertical displacement of 3.1 cm (Reference Joughin, Kwok and FahnestockJoughin and others, 1998). The tidal displacement between the acquisition dates produces a close sequence of about 12 fringes in the tidal flexure zones (Fig. 2). This image pair has a perpendicular baseline of 152 m which results in a sensitivity to topography (altitude of ambiguity) of about 61 m per fringe. On the floating ice, discontinuities in the fringe pattern correspond to rifts which cut completely through the ice. Between the Ice Rise and Bull Nunatak (Fig. 2a) a rift of 25 km length separated the stagnant and fast-flowing sections of the ice shelf. The complex fringe pattern southeast of Evans Glacier (Fig. 2b), at Cape Disappointment, and along the grounding zones north and south of it (Fig. 2c), is caused by different tidal displacements and deformation of small ice-shelf plates, which are separated by rifts from each other and from the coast. Overall, in those areas the ice shelf was completely separated from grounded ice along 60 km of the coastline. Increase of rifting, evident in the interferograms of 1995 and 1999, confirms that the fast-flowing section of the ice shelf became increasingly detached from the surrounding ice.
ERS-1/-2 SAR interferograms of Larsen B from 9/10 November 1999. Location of subsections (25km ×25 km) is shown in Figure 1. The grounding line is plotted in white.

The Disintegration of Larsen B and Related Observations
The disintegration event in February/March 2002
A sequence of satellite images from various sensors was used to analyze the decrease in area of Larsen B between 12 December 2001 and 18 March 2002 (Table 1). The ERS SAR images were transformed to map projection using orbit data, ground-control points and GPS coastlines (Reference Rott, Rack, Nagler and SkvarcaRott and others, 1998). Along Track Scanning Radiometer (ATSR), Moderate Resolution Imaging Spectroradiometer (MODIS) and advanced synthetic aperture radar (ASAR) images were co-registered to the ERS SAR images. A positional accuracy of about one pixel size is achieved in flat areas, which is about 25 m for the ERS SAR and ASAR precision images, 100 m for the ASAR wide-swath image, and 250 and 500m for the MODIS and ATSR images, respectively.
Area of Larsen B ice shelf for several dates between 1995 and 2003
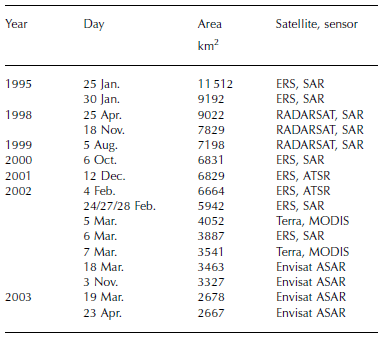
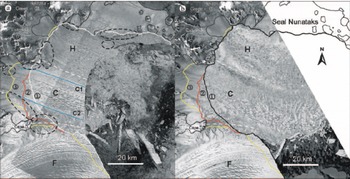
Figure 3a shows an ERS SAR image composite of Larsen B from 24 and 27 February 2002, just before the final collapse. According to the ice-flow pattern, ice thickness, and surface features, the ice shelf can be divided into zones H (downstream of Hektoria–Green– Evans Glaciers), C (of Crane Glacier) and F (of Flask– Leppard Glaciers). Between 4 and 24 February, 722 km2 of ice shelf calved off, whereas the ice front position did not change between 24 and 27 February. By 5 March the section north of Cape Disappointment disintegrated almost completely, when about 1890 km2 of ice broke away (Fig. 3b and 4). Along several sections the ice retreated to the grounding line. On 6 March the embayment south of Seal Nunataks, covering about 4000 km2 in area, was completely covered with small icebergs and ice fragments (Fig. 3b). An additional 511 km2 in area was lost between 5 and 7 March, and another 78 km2 by 18 March. The total area loss between 27 February and 18 March 2002 amounted to 2479 km2.
ERS-2 SAR images showing Larsen B on (a) 24/27 February 2002 and (b) 6 March 2002. Dashed circles in (a) surround rifts cutting through the ice shelf. Lines 1, 2 and 3 show the ice-edge positions on 5, 6 and 7 March respectively.

The pattern of break-up and the shape of the icebergs were found to be related to surface morphology and to ice thickness measured in the field (Fig. 1; Reference RackRack, 2000) and by means of satellite altimetry (Reference Scambos, Hulbe, Fahnestock and BohlanderScambos and others, 2000). The ice thickness decreased towards the ice-shelf front and towards its northern boundary, and was somewhat smaller at the boundaries between sections H/C and C/F than in their centre. Most meltwater channels and melt ponds were oriented approximately in the direction of the flowlines. Superimposed on these longitudinal features, some zones of the ice shelf revealed small transverse patterns of ridges and water-filled depressions that can be retraced to the grounding zone. The spatial repeat cycle of the features along flowline C2, for example, was about 410 m, whereas it varied along flowline C1 between 520 and 650 m, with higher values close to the ice edge (Fig. 3a). Icebergs from these zones show widths similar to those of the transverse features and are smaller than the average icebergs of section C (Fig. 3b). These observations support the conclusions of Reference Scambos, Hulbe, Fahnestock and BohlanderScambos and others (2000) that crevasses and fissures formed at the corners of glacier outlets and advected into the body of the ice shelf facilitate the breakup process.
There is a tendency towards larger iceberg size in the southern part of the break-up area where the melting was less intense. The typical size of icebergs in zone C is 5 km × 1 km, about four times larger than in northern zone H. Up to 18 March 2002, only one large iceberg calved off from zone F, where meltwater was less abundant. The pattern and rapidity of break-up suggest important impacts of pre-existing fracture planes on the shelf, as well as of rifts along the peninsula coast and the boundary towards the stagnant ice shelf of Seal Nunataks.
Pattern of iceberg drift
The analysis of iceberg drift showed that strong winds and ocean currents played a crucial role in the rapid final breakup of Larsen A in January 1995 (Reference Rott, Skvarca and NaglerRott and others, 1996; Reference RackRack, 2000). Similar observations were made at Larsen B. The image sequence of 5–7 March 2002 enabled analysis of the drift pattern by tracking icebergs large enough to be clearly identified both in MODIS and in ERS images. The interval between the image acquisitions was 15 hours for period I (5– 6 March) and 33 hours for period II (6–7 March). Further calving took place during these 3 days: during period I, 165 km2 calved off from zone C; during period II, 10 km2 of ice broke away from zone H, 240km2 from zone C and 96 km2 from zone F (81 km2 as a single iceberg).
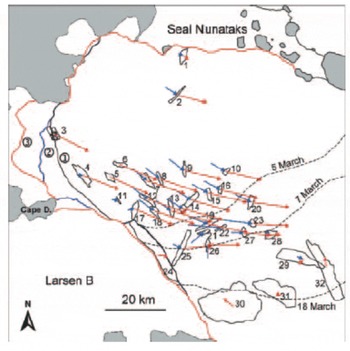
Icebergs are labelled by numbers in Figure 4, some of which (28, 29, 32) had already calved off before 24 February. The drift velocity in the embayment was more or less independent of iceberg size, with an average velocity of about 400 mh–1 in the central area. The icebergs in this area moved southeastwards in period I, and turned east-south-eastwards in period II. The velocities close to the ice edge were smaller (1, 4, 11, 17), whereas the highest velocities (up to 770 mh–1) were observed further out in the bay (23). This velocity is almost identical with the maximum iceberg velocity of 750 mh–1 observed between 28 and 30 January 1995 during the collapse of Larsen A. The weather maps from 27 February to 4 March 2002 show a persistent low-pressure system with its centre close to the northwest coast of AP, which results in strong northwesterly flow on the northeastern section of the peninsula. Under these conditions strong offshore surface winds can be expected along the grounded coastline at Larsen B, initiating and accelerating the iceberg drift eastwards. On the other hand, the larger icebergs north and northeast of Jason Peninsula (29–32) were stationary or drifted very slowly northwestwards, suggesting that they are influenced by the Weddell Gyre, with a prevailing northward motion in this area. These opposing currents resulted in a comparatively sharp front of the plume of ice-covered water, which from 5 to 7 March shifted about 15 km southeastwards (Fig. 3b and 4). Assuming similar displacement for the previous days, 1 March is the most likely date for the start of the collapse. After 7 March the drift slowed down and by 18 March the ice-water plume moved another 15–30km towards the open ocean. The iceberg pattern and drift from 5 to 7 March was similar to those observed immediately after the collapse of Larsen A, although in that case the rotational drift component, probably caused by local ocean currents, was more pronounced (Reference Rott, Rack, Nagler and SkvarcaRott and others, 1996; Reference RackRack, 2000). In both cases, strong offshore surface winds triggered the complete disintegration of the pre-fractured ice shelf within a few days, and were responsible for rapid export of the ice masses.
Drift of several icebergs from 5 to 6 March (blue) and from 6 to 7 March (red) 2002 (observation period 15 and 33 hours, respectively). Ice-edge positions as in Figure 3. The boundary between the area covered with icebergs and open water is indicated by dashed lines.

Further Ice Retreat After Disintegration
The behaviour of grounded outlet glaciers following disintegration of floating ice shelves downstream is an important issue for sea-level rise. The retreat of grounded ice and residual ice-shelf sections after the disintegration events of Larsen A and northern Larsen B was examined, based on SAR data acquired until May 2003. Significant acceleration of grounded ice after the 1995 collapse of the ice-shelf sections north of Seal Nunataks was observed first by Reference Rott, Rack, Skvarca and De AngelisRott and others (2002). Their interferometric synthetic aperture radar (InSAR) analysis shows pronounced maxima of velocity and acceleration at glacier fronts, decreasing significantly up-glacier. The motion fields and the time-scale and magnitude of acceleration of these glaciers are similar to those of rapidly retreating Alaskan tidewater glaciers (Reference Van der VeenVan der Veen, 1996). Reference De Angelis and SkvarcaDe Angelis and Skvarca (2003) report on strong dynamic perturbations on former tributary glaciers based on airborne surveys and optical satellite images.
The total area of grounded ice lost after January 1995 north of Larsen B was 197 km2. The main retreat in February and March 2002 occurred at Sjögren and Boydell (S-B) Glaciers, which were completely separated from each other, and on Dinsmoor–Bombardier–Edgeworth Glaciers, where Dinsmoor Glacier was separated from the two others. Further retreat was observed in 2003 mainly in Röhss Bay, on S-B Glaciers, and Drygalski Glacier (Table 2).
Loss of grounded ice at selected former tributaries of the northern LIS, 1995–April/May 2003
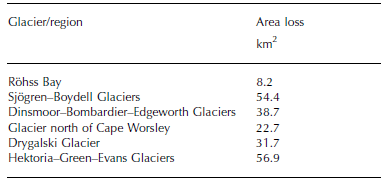
In February 2002 the remaining part of the Prince Gustav Channel ice shelf broke away, including the ice shelf in Röhss Bay (47 km2) and in the inlet north of Cape Longing (21 km2). In addition, the last small remnant of Larsen A immediately north of Seal Nunataks disappeared, so that the total loss of ice shelf north of Seal Nunataks from March 1986 to May 2003 was 3240 km2.
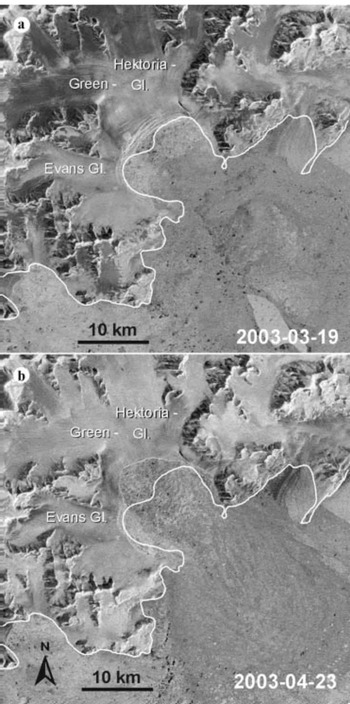
During summer 2003, several comparatively large icebergs (the largest about 400 km2) calved off south of Cape Disappointment, and new major rifts formed parallel to the ice front with lengths of up to 25 km (dashed lines in Fig. 1). North of Cape Disappointment, the ice shelf retreated almost to the grounding line, and in the embayment of Hektoria–Green–Evans Glaciers significantly beyond it. An Envisat ASAR wide-swath image of 3 November 2002 shows that the ice shelf in this part had completely disintegrated. Thereafter, the rifting intensified considerably within several kilometres of the ice edge (Fig. 5a). Between 19 March and 23 April 2003 about 36 km2 of grounded ice calved off and the ice front retreated by up to 3.5 km (Fig. 5b). In total, 57 km2 of grounded ice disappeared in the short period after the disintegration of northern Larsen B.
Envisat ASAR narrow-swath images showing the calving ice front of Hektoria, Green and Evans Glaciers on (a) 19 March 2003 and (b) 23 April 2003. The former grounding line (white) is derived by differential SAR interferometry.

Conclusion
The pattern of progressive, accelerating retreat and final collapse of northern Larsen B Ice Shelf was similar to that of the Larsen A decay. Regional atmospheric warming caused prolonged periods of summer melt and extensive appearance of meltwater ponds and streams on the surface. Over the northern parts of the ice shelf the surface mass balance became negative several years before the collapse. Acceleration of ice flow, decrease in ice thickness, and enhanced calving resulted in mass loss leading to an unstable ice-shelf configuration.
The speed and pattern of the final collapse indicate that pre-existing fractures played a key role in this event. The interferometric analysis shows that rifts were present along the boundaries and parallel to the ice front several years before the collapse. The icebergs were similar in size and shape to surface undulations and followed the pattern of meltwater streams and ponds, producing fissures and crevasses prior to the break-up, as suggested by Reference Scambos, Hulbe, Fahnestock and BohlanderScambos and others (2000). The iceberg drift suggests that surface winds played a role in the timing and pattern of decay, as well as the geometry of the embayment in which the ice shelf is confined (Reference Doake, Corr, Rott, Skvarca and YoungDoake and others, 1998).
According to mass-balance estimates and former flow velocities, a readvance of Larsen B to the boundaries of the 1980s would require several hundred years under positive mass-balance conditions (Reference Rott, Rack, Nagler and SkvarcaRott and others, 1998; Reference RackRack, 2000). A preliminary analysis of sediments taken beneath the section of Larsen B that broke off in 1999 suggests that this ice shelf had not disintegrated previously during the Holocene, indicating the uniqueness of present climatic conditions (E.W. Reference Domack, Duran, McMullen, Gilbert and LeventerDomack and others, 2002).
In addition to new insights on the vulnerability of ice shelves in respect to climate warming, the recent break-up of several sections of the northern LIS offers the opportunity to study the effects of ice-shelf disintegration on grounded ice. The ice export of glaciers formerly nourishing Larsen A and Prince Gustav Channel ice shelves increased significantly after the collapse, and a significant amount of grounded ice calved off between 1995 and 2003. Grounded ice also started to retreat on glaciers where northern Larsen B had disappeared in March 2002.
The sea-level equivalent of all glaciers upstream of the (former) LIS north of Jason Peninsula is small (our estimate is 16 mm, based on BEDMAP ice thickness data and detailed mapping of glacier basins) and consequently of little direct concern for sea-level rise. However, the dynamic behaviour of the glaciers suggests an important control function of ice shelves which might be very relevant for the sea level if the ice-shelf retreat propagates further south.
Acknowledgements
The ERS data were made available by the European Space Agency through the VECTRA project, and the Envisat data through AO-ID308. The work was supported by the National Space Program of the Austrian Space Agency. Terra-MODIS data were made available by the Earth Observing System Data Gateway (EDG) at the Goddard Space Flight Center (GSFC) Earth Sciences (GES) Distributed Active Archive Center (DAAC), Boulder, CO, USA. Climate data from the AWS Larsen Ice were obtained from the US AWS program of the University of Wisconsin. We are grateful to Instituto Antartico Argentino, Direcciόn Nacional del Antártico, for the opportunity to participate in field campaigns. We also appreciate the constructive comments of the two referees, E. Rignot and T. Scambos, and of the Scientific Editor, H. Fricker.