Implications
Meat quality parameters are a key factor to determine the value of pork products obtained in a farming system, related to the industry and consumer demands and focused in the technological meat quality traits. A tool based on these traits has been developed to evaluate the suitability level of pig carcasses to industry demands, and is included in an integrated set of tools. This set provides objective data about the sustainability of the whole farming system according to different aspects of pig production, including their economic viability and the environmental impact, among others.
Introduction
Quality of pork and pork products has become a complex theme involving the total pork chain from fork-to-farm. The meat quality concept is nowadays influenced by multiple interacting factors, concerning the meat itself and also the conditions under which the meat is obtained. In addition, the aspects related to sustainability of pig farming systems have been recently integrated into the concerns and demands from European citizens, producers and consumers (European Commission, 2009). Thus, quality aspects and sustainability in the production of pork and pork products are of high priority in the EU. This was one of the objectives of the Q-PorkChains EU research program (www.q-porkchains.org).
Under this framework, a market conformity tool, based on technological meat quality parameters, was included in a global tool for evaluating the sustainability of pig farming systems. Obtaining a final product adequate to the market demands and, thus, with an added value, was considered as a good indicator of sustainability, as regard to meat quality. A previous inventory of systems carried out within the Q-PorkChains project, and published by Bonneau et al. (Reference Bonneau, Antoine-Ilari, Phatsara, Brinkmann, Hviid, Christiansen, Fàbrega, Rodríguez, Rydhmer, Enting, De Greef, Edge, Dourmad and Edwards2011), reinforced the importance of the market conformity tool, since one of the major claims for the differentiated production systems was meat quality. Along this line, there is a whole range of pig production systems having a claim for higher meat quality, from very differentiated systems relying on local breeds and extensive rearing conditions up to systems using conventional breeds in intensive conditions with only a few specifications, for example, on slaughter age and/or lodging (Bonneau et al., Reference Bonneau, Antoine-Ilari, Phatsara, Brinkmann, Hviid, Christiansen, Fàbrega, Rodríguez, Rydhmer, Enting, De Greef, Edge, Dourmad and Edwards2011). Different studies have shown that the superior quality of pork from farming systems using local breeds is actually the result of a complex combination of factors including genotype, feeding and rearing conditions (Edwards, Reference Edwards2005; Lebret, Reference Lebret2008).
The meat quality concept involves several quality components, such as technological properties, nutritional value, sensory traits, hygienic conditions and social or ethical consideration mostly related to the way of raising the animals and to the influence on purchasing behaviour of consumers (Hofmann, Reference Hofmann1994). Since the tool to evaluate sustainability of meat quality should be practical and easily applicable to be successful, it was focused on measurable and repeatable objective parameters. Moreover, the technological parameters provide numerical data that allow calculating a global score, allowing objective comparisons among farming systems. In this sense, several publications have shown that technological meat quality parameters provide really valuable information to define the final product of a pig farming system, considering the following parameters: pH, owing to its importance during the transformation from muscle to meat (Warner et al., Reference Warner, Kauffman and Greaser1997); colour, as an important purchasing decision parameter for the consumer (Lindahl et al., Reference Lindahl, Lundström and Tornberg2001); water holding capacity, related to the potential exudation of meat (Offer and Knight, Reference Offer and Knight1988); and intramuscular fat (IMF) content, owing to its importance to produce added value meat products, mainly in the producing systems claiming for higher standards of meat quality (Rosenvold and Andersen, Reference Rosenvold and Andersen2003; Faucitano et al., Reference Faucitano, Ielo, Ster, Lo Fiego, Methot and Saucier2010; Pugliese and Sirtori, Reference Pugliese and Sirtori2012).
It has to be taken into account that sensory evaluations and consumer studies would contribute to a great extent to define the final product of the system, but these parameters are difficult and costly to obtain and, as stated before, only the technological parameters were included in the tool in order to make it more easily applicable and repeatable. Sensory evaluation, and especially consumer studies, within each system would contribute to obtain a score representing the real market suitability of meat according to consumer demands. The loss of this information was accepted in the present study and the concept of market conformity should be understood as the industry requirements to elaborate pork and pork products. However, if sensory evaluation is feasible in future studies, a wider and more complete score in relation to consumer acceptability could be developed.
The present study aimed at establishing relationships between the technological meat quality in different pig farming systems and its adequacy to the market demands. The general objective was to develop and test a standardised and repeatable tool to evaluate meat quality in a sustainability approach, in order to integrate the market conformity score within the global analysis of sustainability of farming systems. The specific objective of the market conformity tool was to define a scoring system based on the suitability of meat to elaborate the main pork products, according to their market shares, in different pig farming systems.
The present paper presents the results on the theme ‘Meat Quality’ of a global tool that was elaborated for evaluating the sustainability of pig farming systems. The results of some of the other themes are published as companion papers (Breeding Programmes: Rydhmer et al., Reference Rydhmer, Gourdine, De Greef and Bonneau2014; Environmental sustainability, Dourmad et al., Reference Dourmad, Ryschawy, Trousson, Bonneau, Gonzàlez, Houwers, Hviid, Zimmer, Nguyen and Morgensen2014; Economy: Ilari-Antoine et al., Reference Ilari-Antoine, Bonneau, Klauke, Gonzàlez, Dourmad, De Greef, Houwers, Fàbrega, Zimmer, Hviid, Van der Oever and Edwards2014; Integrated evaluation: Bonneau et al., Reference Bonneau, Klauke, Gonzàlez, Rydhmer, Ilari-Antoine, Dourmad, De Greef, Houwers, Cinar, Fàbrega, Zimmer, Hviid, Van der Oever and Edwards2014b). The results of associated theme Societal Conformity are published in the book chapter from De Greef (Reference de Greef2013).
Material and methods
Data collection
Carcass and meat quality data were obtained from 15 contrasted pig farming systems from 5 different countries according to their category. They were defined in more details in the introductory paper (Bonneau et al., Reference Bonneau, De Greef, Brinkman, Cinar, Dourmad, Edge, Fàbrega, Gonzàlez, Houwers, Hviid, Ilari-Antoine, Klauke, Phatsara, Rydhmer, Van der Oever, Zimmer and Edwards2014a). They included five conventional (C), five adapted conventional (AC), two organic (O) and three traditional (T) systems. Data were collected by each of the country representatives and pooled together to be analysed.
Carcass and meat quality measurements
In previous stages of the tool development, several parameters were proposed to measure carcass and meat quality (Gonzàlez et al., Reference Gonzàlez, Gil, Gispert, Oliver and Fàbrega2008). The feasibility of their application was discussed within the scientific team and with experts from the different systems to be evaluated, and some of the parameters were excluded from the tool. This was the case for electrical conductivity and meat instrumental colour measurement, which were not included in the final tool because of the high cost of the devices for slaughterhouses. In the same way, sensory traits were discarded because of the difficulties to implement the methodology and harmonise the final outcome.
In order to perform the market suitability analysis both carcass and meat quality traits were considered. Regarding carcass quality, the following traits were measured: cold carcass weight (CW), according to the standard presentation in each farming system; lean meat percentage (LMP) using the approved equipments in each country and estimated from the prediction equations included in the legislation; minimum subcutaneous back fat depth at m. gluteus medius level (MLOIN). With respect to meat quality, the measured variables were the following: muscular pH using a pH meter with a penetration probe, including the ultimate pH (pHu) at 24-h postmortem in the m. longissimus lumborum (LL), at the last caudal rib level, and the pHu in the m. semimembranosus (SM) muscle; meat colour was assessed in LL muscle at last caudal rib level by experienced observers using the Japanese scale colour (JSC) (Nakai et al., Reference Nakai, Saito, Ikeda, Ando and Komatsu1975); drip losses (DL) were determined from the same sample, using the methodology described by Rasmussen and Andersson (Reference Rasmussen and Andersson1996) and IMF content in a LL sample was determined by either Soxtech without acid hydrolysis (Association of Official Analytical Chemists, 1990) or equipments based on near IR spectroscopy calibrated according to the reference methods.
Owing to the difficulties to perform these measurements and the specific technological meat quality requirements in some systems, other criteria were also accepted. The pH measured at 45 min (pH45) in both LL and SM muscles was included in the analysis when it was considered a meat quality requirement. When the carcass was cut warm, a LL sample was removed and stored in refrigeration until pH could be measured at 24 h. The carcass and meat quality parameters were measured in a minimum of 20 pigs/system (mean of 48 observations/system).
Determination of market conformity
The suitability of pork and pork products to market conformity, assuming here to be represented by the industry demands, was evaluated. The main pork products for each farming system were grouped into five different categories: fresh meat, considering both non-processed cuts and pork products consumed as fresh (e.g. minced meat, fresh meat sausages); cooked products, made from non-minced hams and shoulders; dry products, elaborated from the whole hams and shoulders; specialties, typical for each farming system and with high added value; and other meat products with no specific technological meat quality requirements.
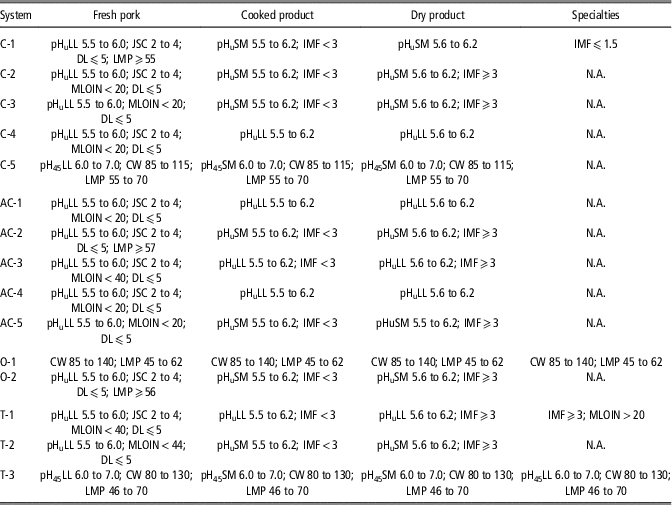
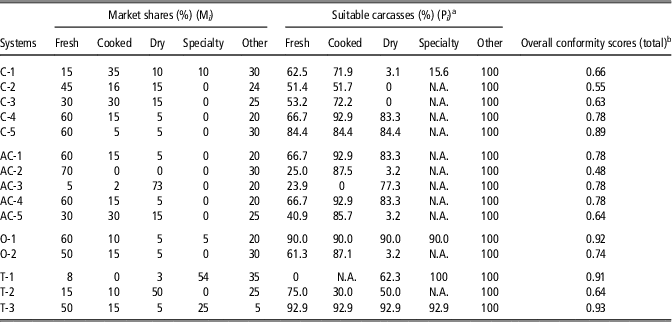
Within each of the studied farming systems, acceptability benchmarks and market shares for each pork product category were obtained from the literature, from the specifications according to technological meat quality defined by the quality brands in some systems, and from personal communications with experts on the systems. Market shares were expressed as the percentage of meat produced in a farming system used for elaborating each of the product categories defined before, hence informing the way a pig farming system is oriented by several targeted markets. Each carcass was categorised as suitable or not for the different categories of meat products (fresh meat, cooked products, dried products, specialties and other) according to the meat quality benchmarks presented in Table 1. The market share for each type of meat and meat product and each pig farming system is presented in Table 4. When the market share for a pork product category was 0, indicating no interest in producing it, the conformity score was considered as not applicable. A market conformity score was then calculated for each product category by multiplying the percentage of suitable carcasses (meeting the requirements of the acceptability benchmarks) by the market share of the product category for the farming system.
Acceptability benchmarks according to pork products categories for the studied farming systems

C=conventional; AC=adapted conventional; O=organic; T=traditional; LMP=lean meat percentage (%); CW=carcass weight (kg); MLOIN=minimum back fat thickness over m. gluteus medius (mm); JSC=Japanese scale colour; IMF=intramuscular fat (%); DL=drip loss (%); N.A.=not applicable.
No acceptability benchmarks were defined for the ‘Other’ category of meat products.
Results
Carcass and meat quality criteria
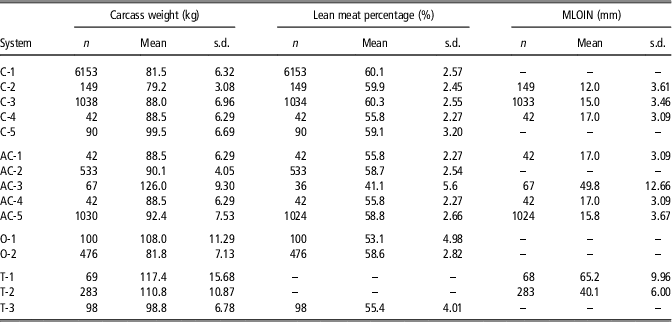
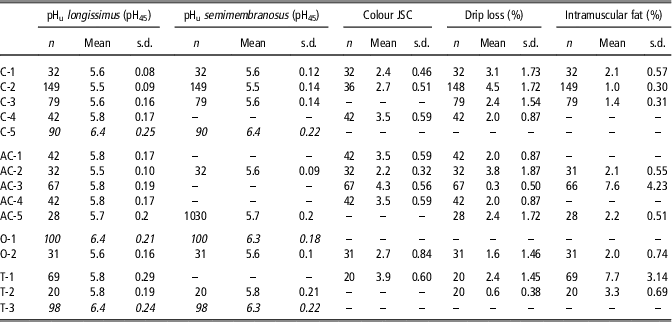
Tables 2 and 3 show the number of observations, the mean and standard deviation of the observed carcass and meat quality criteria that were used to determine the market suitability in the various farming systems. In all the systems the minimum number of observations was achieved, although in some cases it was not possible to collect data from all the meat quality variables. To obtain an adequate representativeness of farms, in each system meat quality was determined in different type of animals. This is the reason we observed remarkable standard deviation values in some variables, content and DL. Moreover, the breed type itself presented higher intrinsic variability in some systems, especially when evaluating IMF content.
Number of observations (n), mean and s.d. of the carcass quality criteria measured in animals from each system, which were used to determine market suitability
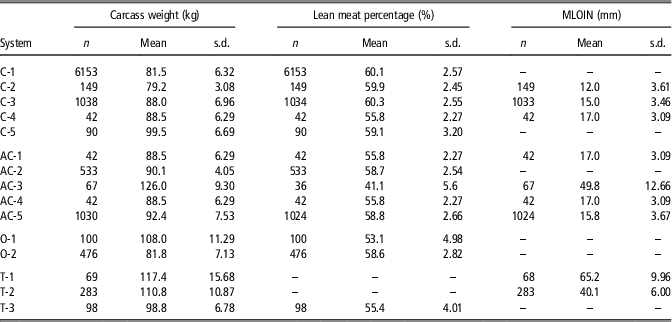
C=conventional; AC=adapted conventional; O=organic; T=traditional; MLOIN=minimum back fat thickness over m. gluteus medius.
Number of observations (n), mean and s.d. of the meat quality criteria measured in animals from each system, which were used to determine market suitability
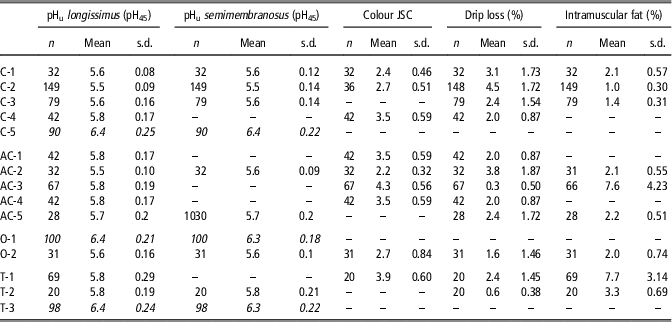
C=conventional; AC=adapted conventional; O=organic; T=traditional; JSC=Japanese colour scale.
Values in italics represent pH measured at 45-min postmortem at both longissimus and semimembranosus muscles.
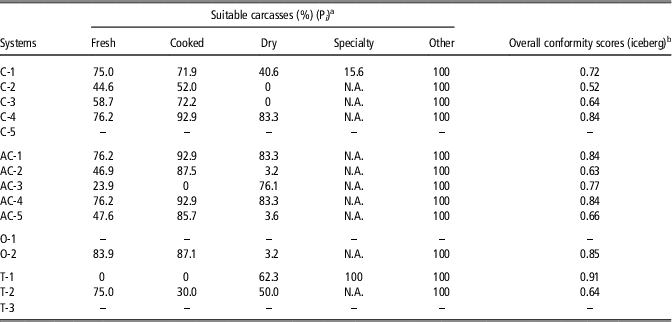
Percentage of suitable carcasses in the various farming systems
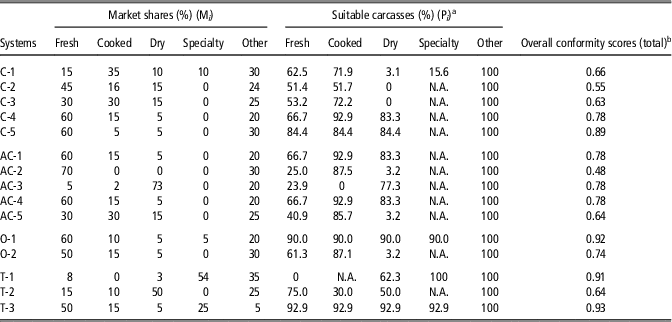
For each pork product category, the percentages of carcasses that met the requirements of the acceptability benchmarks, and were therefore considered as suitable, are shown in Table 4. In the case of the ‘other products’ dimension, all observations were considered suitable owing to the absence of meat quality requirements. For each product category, the percentages of suitable carcasses covered all, or almost all, the possible range of variation, from 0 (very low) to 100 (very high). In general, data showed no obvious correlation between the percentages observed in the various categories of products, showing that there were no redundancies regarding these observations.
Market shares and percentages of suitable carcasses according to the category of pork product and overall conformity score, using the complete set of meat quality variables
C=conventional; AC=adapted conventional; O=organic; T=traditional; N.A.=not applicable (no market share for that product).
a Percentage of carcasses matching the requirements of the benchmarks.
b Overall conformity score=∑ i (M i ×P i ) where M i is the market share for product category i and P i the percentage suitable carcasses for product category i.
According to the market shares, the systems C-2, C-4, C-5, AC-1, AC-2, AC-4, O-1, O-2 and T-3 were focused in producing carcasses to be consumed mainly as fresh meat. Nevertheless, the percentage of suitable carcasses to produce fresh meat only showed high values in the systems C-5, O-1 and T-3, coinciding with the higher overall conformity scores and indicating that the animals produced matched the industry demands to a great extent. The systems that achieved low percentage of suitable carcasses for fresh meat were penalised in the overall score, as observed in system AC-2 (0.48). This system is focused in obtaining fresh meat, although only 25% of the carcasses were adequate from the technological quality point of view. On the other hand, these animals showed high potential to produce cooked products (88% of suitable carcasses), and perhaps the market share of the system could be reoriented to increase the system’s efficiency.
The systems C-1, C-3 and AC-5 were oriented to a great extent towards cooked products production, although all of them presented as well a noticeable market share for fresh meat (15% to 30%) and dry products (10% to 15%). These three systems achieved high percentage of suitable carcasses to produce cooked products (72% to 86%). Contrarily, their carcasses were considered unsuitable to elaborate dry products because of their low IMF content. This fact, together with not very favourable percentages of suitability for fresh meat, led to average overall conformity scores under 0.70. Systems AC-3 and T-2 focused on elaborating mainly dry products. The first one presented scarce diversification of products but obtained notable percentages of suitability carcasses for dry products (77%), which explained the quite high overall score (0.78). In the case of T-2, the suitability for dry products was not very favourable (50%), but the limited market share for fresh meat contributed to a slight increase of the overall score.
There was only one system that presented a clear orientation to elaborate specialty products, the T-1 (54%). According to the industry requirements to elaborate this specialty, all the carcasses evaluated achieved an adequate technological meat quality. This was the key to obtain one of the most high overall conformity scores (0.91), indicating high matching between the producers and industry. In addition, a high suitability of carcasses to elaborate dry products was observed (62%), but the market shares for this kind of product were very low.
Market conformity in the various farming systems
The overall conformity scores are presented in Table 4 for each farming system. They varied markedly between systems, from 0.48 (AC-2) to 0.93 (T-3). The poorest overall scores (0.48 in AC-2 and 0.55 in C-2) were observed in systems where the percentage of suitable carcasses was low in the category of products that represented the largest market share. The highest overall scores (>0.90) resulted either from high suitability in all product categories (O-1, T-3) or from a specialisation of the market on products for which the system achieves a 100% suitability (T-1).
There was no clear indication of differences in overall conformity scores between the categories of systems (conventional, adapted to conventional, outdoors or traditional).
Market conformity using a reduced set of variables
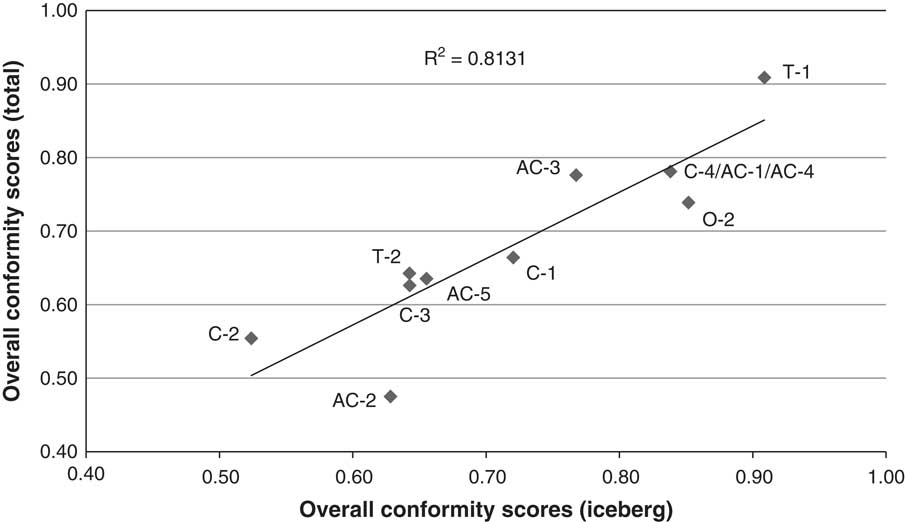
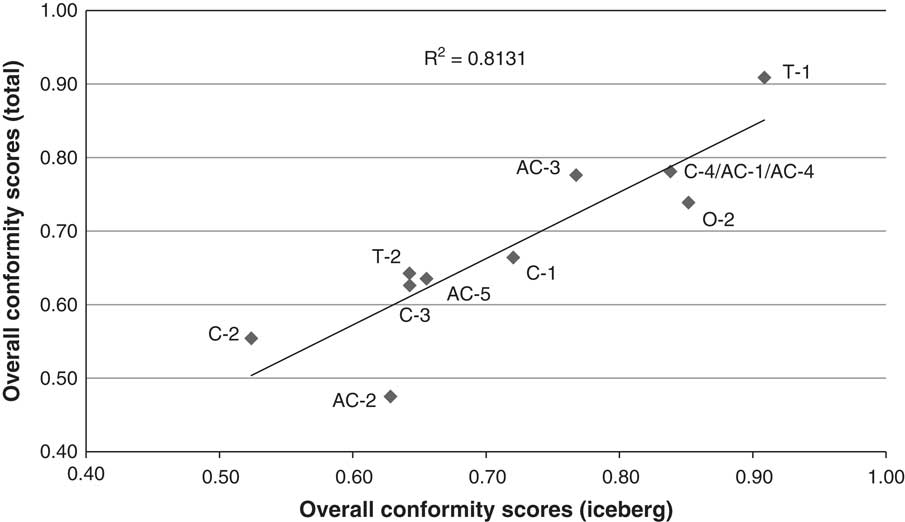
After developing and applying the present tool, the next step was focused in its simplification to make it more applicable in practice. This process consisted in identifying the most feasible and inexpensive combination of technological meat quality traits, based on the expertise of the research team, and maintaining the tool’s robustness. The meat quality variables chosen to build the reduced market conformity tool were the ultimate pH, the MLOIN and the IMF, representing key indicators of meat quality and fatness levels. To evaluate if the reduced tool provided the same degree of information as the complete one, the overall market conformity scores were calculated again by using only these three variables. The results regarding these calculations are presented in Table 5 and the correlation between the complete and the reduced tools is presented in Figure 1. The systems C-5, O-1 and T-3 could not be evaluated by the reduced tool because there was no information regarding the chosen meat quality variables. The correlation equation between the two types of overall score presented a R 2 of 0.813 (implying a correlation of 0.902), indicating a sufficient degree of agreement between both scoring systems.
Relationship between the overall scores of market conformity calculated by the complete set of meat quality variables and by the iceberg indicators (pH, MLOIN and intramuscular fat). MLOIN=minimum back fat thickness over m. gluteus medius; C=conventional; AC=adapted conventional; O=organic; T=traditional; N.A.=not applicable (no market share for that product).
Percentages of suitable carcasses according to the category of pork product and overall conformity score, calculated by the iceberg indicators (pH, MLOIN and intramuscular fat)
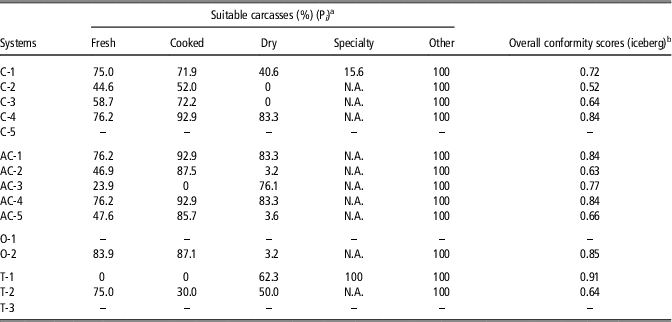
C=conventional; AC=adapted conventional; O=organic; T=traditional; N.A.=not applicable (no market share for that product).
a Percentage of carcasses matching the requirements of the benchmarks.
b Overall conformity score=∑ i (M i * P i ) with M i =Market share for product category i (see Table 4) and P i =Percentage suitable carcasses for product category i.
Discussion
The tool used to evaluate market conformity resulted in an overall numerical score based on parameters that are commonly used for the assessment of technological meat quality, according to their degree of matching with the market shares of the various target products for a system. High scores indicated that the carcasses produced in a system achieved the meat quality requirements of the targeted market to a great extent, leading to a higher efficiency of the systems and a reduction of the economic losses. A notable variability was observed within each category of farming system, according to the market orientation of their main products. When calculating the sustainability score of a system, a key factor was the level of fulfilment of the meat quality parameters set up by the industry. In those systems where constrains were lower the sustainability scores were higher, and vice versa. Despite this limitation, the tool included the meat quality requirements as they were defined by the industry, in order to obtain a more realistic approach.
Calculation of correlations between variables and multivariate analyses are good tools for identifying redundancies between variables and sorting out which of them account most for the observed variability between systems. However, these analyses could not be carried out because the variables used in the evaluation were not the same for the 15 systems. The reduced set of meat quality variables was therefore selected according to the obtained expertise when applying the tool. They were the ultimate pH measured at 24-h postmortem either at LL or SM muscles, the minimum fat thickness measured at the left half carcass over the m. gluteus medius level and the IMF content in a m. longissimus sample. When the overall score was calculated using the complete set of variables or the reduced tool, the correlation observed was notably high (R 2=0.816). Nevertheless, a tendency was observed in all the systems to present lower scores when using the complete tool than the reduced one. This was probably owing to the higher restriction degree of the complete tool, the inclusion of more variables in the model resulting in higher probability of finding unacceptable meat quality values.
The reduced set of meat quality variables were considered as iceberg indicators, since they were efficient in providing valuable information investing relatively low resources, and their reliability is supported by several studies from the literature.
These iceberg indicators were not measured in three of the studied systems (C-5, O-1 and T-3) because the ultimate pH, the MLOIN and the IMF content were not considered as technological meat quality requirements by these systems. Instead, they used the pH at 45-min postmortem, the CW and the LMP as carcass and meat quality requirements. In further evaluations it is expected to feasibly evaluate the market conformity tool within these systems, allowing obtaining the final sustainability score.
The ultimate pH measured at 24-h postmortem allows identifying dark, firm, dry meat, and higher acceptable values vary among authors from 5.9 (Barton-Gade et al., Reference Barton-Gade, Warriss, Brown and Lambooij1995) to 6.4 (Van der Wal et al., Reference Van der Wal, Bolink and Merkus1988). The information on ultimate pH provided by the experts on each system was slightly variable, although most of them considered values between 5.5 and 6.2 as acceptable in both LL and SM muscles. Low back fat thickness was considered as a requirement in most systems mainly for the fresh meat category of products, and MLOIN was taken as the most representative measurement (European Commission 2012, Commission Decision 2012/384/EU). The main reason for using this parameter is that in conventional systems fatter carcasses give lower meat yields that result in economic inefficiency. In other types of systems, such as those using traditional breeds or those claiming for higher meat quality, a minimum fat is required by the industry to elaborate pork and pork products, hence the variable was included in the tool. The acceptability benchmarks for maximum back fat depth ranged between 20 and 40 mm. Only in the case of specialty meat products in one system (T-1) the MLOIN had to be higher than 20 mm to be acceptable. The last iceberg indicator was the IMF content in loin. This parameter was relevant mainly for elaborating dry products and the experts agreed in recommending a minimum of 3% IMF content, in order to achieve the particular sensory properties of the high added value dry products. In the case of standard quality cooked products, IMF is not as highly appreciated, thus a restriction on IMF content was fixed at a maximum of 3% by system experts.
The complete tool for market conformity considered other parameters that contributed to the definition of the specific requirements for each farming system. They are also relevant and informative, but probably they are not decisive factors in all the systems. The minimum acceptable values for pH measured at 45-min postmortem, for avoiding pale, soft, exudative meat, were set at 5.8 (Hofmann, Reference Hofmann1988), 5.9 (Barton-Gade et al., Reference Barton-Gade, Warriss, Brown and Lambooij1995) or 6.0 (Smith and Wilcon, Reference Smith and Wilcon1978; Oliver et al., Reference Oliver, Gispert and Diestre1988). In the systems that considered pH45 as a technological requirement, the experts valued this variable as acceptable when it was between 6.0 and 7.0. Related to muscle pH, the assessment of its water holding capacity by measuring the DL was also considered as a meat quality requirement in some systems. During the first hours postmortem, pH in the myofibril proteins declines closer to their isoelectric point, which is near 5.0 (Hamm, Reference Hamm1960), resulting in the denaturation and a smaller space between those proteins (Offer and Knight, Reference Offer and Knight1988) and consequently reducing the water holding capacity of the meat. Moreover, recent studies suggest that proteolysis of intermediate filament and costameric proteins are also determinant for DL (Bee et al., Reference Bee, Anderson, Lonergan and Huff-Lonergan2007). DL is known to be affected by the particular traits of each farming system, such as animal genetics and pre-slaughter conditions. The measurement of colour was also considered in some systems, mainly to define the quality of fresh meat, by means of the JSC defined by Nakai et al. (Reference Nakai, Saito, Ikeda, Ando and Komatsu1975).
As mentioned previously, sensory analysis and consumer studies would also provide very relevant information, but were found to be not feasible on practicality grounds.
The objective of this study was not to make direct comparisons between different systems, not even to cluster them in more generic types, but to use those much contrasted systems to generate variability in order to test the validity and robustness of the tool. Along these lines, higher and lower sustainability scores were both found within the traditional, the organic, the adapted conventional and the conventional systems. Therefore, the obtained values allow each system to benchmark their results against other systems and define strategies for improvement. It has to be taken into account that the suitability requirements were allowed to be different and adapted to each system, thus, if a low value was obtained, this could indicate a possibility for improvement within the proper standards of the system.
From the results obtained, it was observed that the market conformity tool permitted to identify weaknesses within systems, related to a low match between technological quality and industry requirements and strengths, in case that a system produced carcasses suitable for the industry demands. It should be taken in consideration that the presented tool was used in a wide diversity of pig farming systems to test its feasibility and applicability. These tests were conducted by experienced technicians since it is needed in the first stages of the development. Nevertheless, in order to detect weaknesses and improvement opportunities within each farming system, the tool should be applied by different end-user profiles.
In addition, the sensory attributes of meat and meat products could be added in a further developed tool, to better evaluate the consumer related traits to extend the tool from industry demands to real consumer preferences.
On the other hand, the tool could be used to evaluate the potentiality of a system to re-orientate the elaboration of pork products according to their market share, in case the meat quality was suitable for another product category. Hence, the systems with high potential to produce high quality pork products with low market share could enhance its commercialisation, and possibly increase the system efficiency. Nevertheless, many factors should be considered when applying strategies regarding the re-orientation of pork products in a system, such as the productive efficiency and the final cost of the product, being a drawback in some traditional breeds presenting low productive efficiency. In case of traditional breeds, the improvement of the system by re-orientating the pork products should be accompanied by commercial plans for giving added value to the whole carcass, including the typical high amounts of fat of these low selected breeds.
According to the results obtained, two main strategies could be used to enhance the suitability of meat produced in a system to elaborate acceptable pork and pork products: either modifying the targeted market by increasing the market share of most valuable products or optimising carcasses for the same targeted market. According to the potentiality to elaborate dry products, it was observed that the systems C-4, C-5, AC-1, AC-4, O-1 and T-3 showed low market shares but an elevated percentage of carcasses that could be used to elaborate this pork product. In the case of cooked products, the systems C-5, AC-1, AC-4, O-1, O-2 and T-3 presented a clear potentiality to explore the cooked hams and shoulders market niche. In respect to fresh meat, only the systems T-2 and C-1 showed a potentiality to increase the market share for this category.
Conclusions
The conformity tool that was developed in the present study was based on quantifying the extent to which the achieved carcass and technological meat quality parameters matched the requirements of the targeted market of the system, according to the system market shares for each category of products and benchmarks values defined for each category of products. The final numerical conformity scores allowed discriminating among pig farming systems, and also enabled an objective comparison between them. The higher the scores obtained, the better the efficiency of the system to provide carcasses and meat of a sufficient level of quality to avoid economic losses.
The present study points out a discussion regarding the re-orientation of meat produced in a farming system to elaborate pork products according to the industry demands and market share. This issue is in line with the global evaluation of the sustainability in farming systems. Hence, it allows detecting improvement opportunities to enhance the suitability of meat produced in a system to elaborate pork and pork products that meet the industry requirements.
This tool could be further improved by including sensory attributes and consumer related traits in order to indeed evaluate matching between pork production systems and consumer demands.
When applying the reduced market conformity tool, including ultimate pH, MLOIN and IMF content, the results correlated well but were slightly overestimated in respect to those obtained in the complete tool. It is suggested that both tools proved to be feasible and valid to assess market conformity according to meat quality technological parameters. The results obtained from the market suitability tool were used in an integrated sustainability analysis of pig farming systems (Bonneau et al., Reference Bonneau, Klauke, Gonzàlez, Rydhmer, Ilari-Antoine, Dourmad, De Greef, Houwers, Cinar, Fàbrega, Zimmer, Hviid, Van der Oever and Edwards2014b).
Acknowledgments
The authors gratefully acknowledge the European Community financial participation under the Sixth Framework Programme for Research, Technological Development and Demonstration Activities, for the Integrated Project Q-PorkChains FOOD-CT-2007-036245. The content of the paper reflects only the view of the authors; the Community are not liable for any use that may be made of the information contained in this paper.