I. INTRODUCTION
Approximate mathematical formula about the sample transparency aberration of samples with finite thickness has already been reported (Ida and Kimura, Reference Ida and Kimura1999). However, the effects of finite thickness have not yet been incorporated to the deconvolutional treatment proposed by the author (Ida and Toraya, Reference Ida and Toraya2002; Ida et al., Reference Ida, Ono, Hattan, Yoshida, Takatsu and Nomura2018), partly because it was technically difficult to be implemented within the limitation of the standard numerical computing system (IEEE 754).
Another issue about the sample transparency effect is the appropriateness of the approximation. In contrast to the approximations used for other instrumental aberrations in Bragg–Brentano geometry, the axial-divergence and equatorial aberrations are treated as second-order approximations about the deviations, the formula about the sample transparency aberration is based on the first-order approximation. The author has suggested that even the second-order approximation about the equatorial aberration may cause detectable discrepancy in the data collected with a realistic measurement system, and proposed a numerical method based on the exact geometrical relation (Ida, Reference Ida2020).
In this study, the author examines how the first-order approximation is justified for the treatment of sample transparency effects. The double convolution formulas for the sample transparency aberration, and the difficulties in numerical calculations, are discussed. A practical method for the deconvolutional treatment about the sample transparency aberration is also presented. The method is applied to simulated data, calculated by a whole pattern convolution process with realistic parameters for a measurement system.
II. THEORETICAL
A. Deviation in diffraction angles
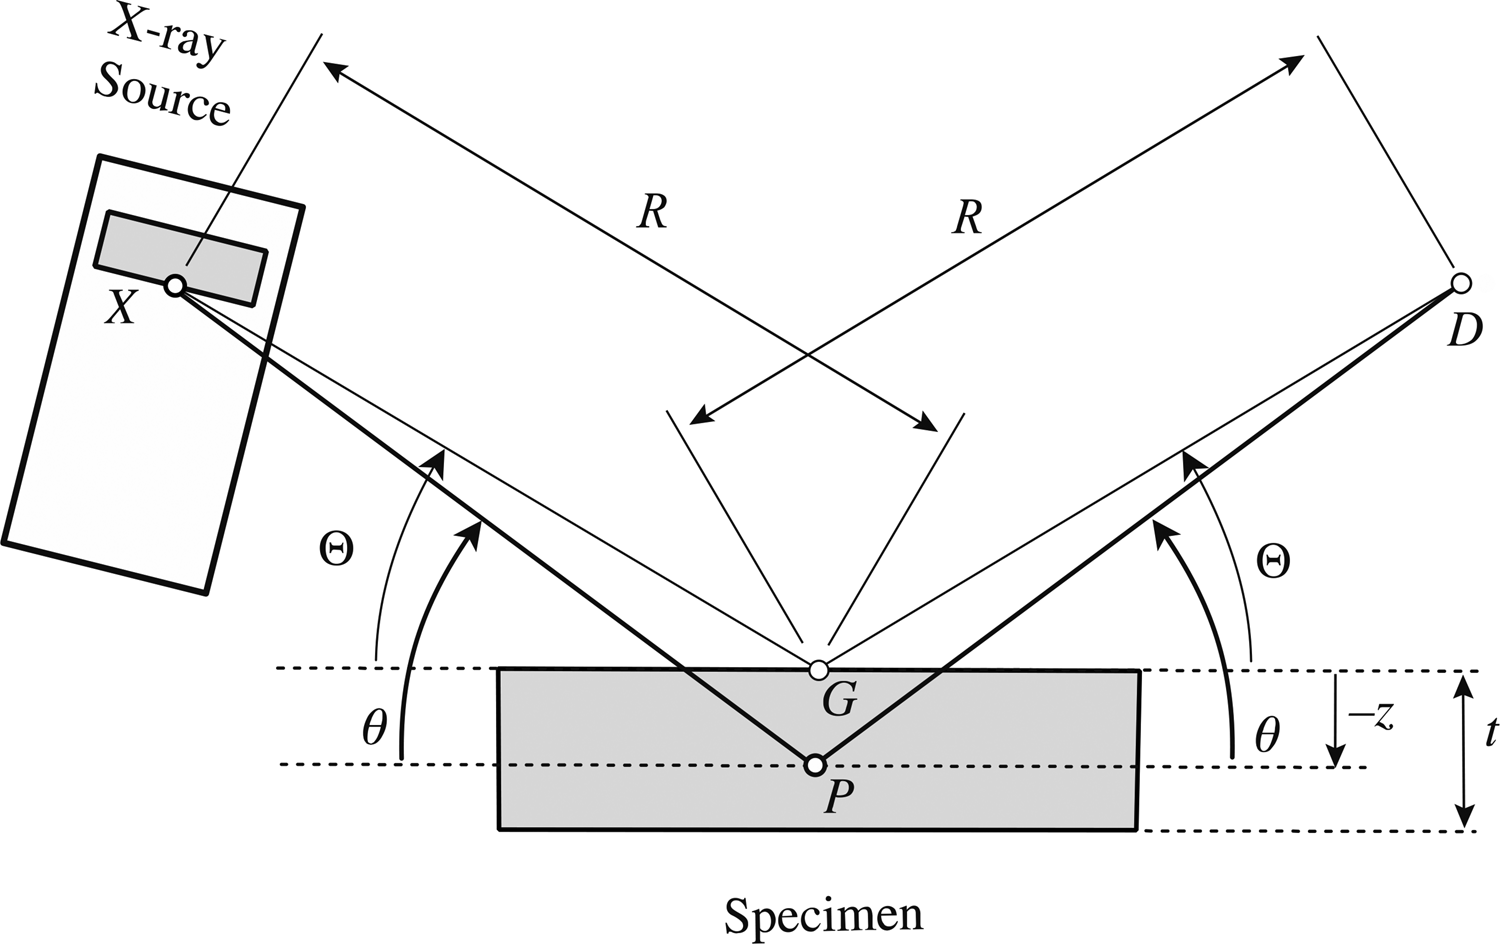
Symbols of instrumental parameters related to the sample transparency aberration are shown in Figure 1. R is the goniometer radius and t is the thickness of the specimen. The penetration depth of the source X-ray is assumed to be μ −1, which is identical to the reciprocal of the linear attenuation coefficient μ of the powder specimen. It is assumed that the center of the specimen face is exactly located at the rotation axis of the goniometer G, and the reflection point P is located at the depth of −z (height of z).
Instrumental parameters related to the sample transparency aberration.

Note that the apparent diffraction angle, or the goniometer angle, is denoted by the capital Greek letter 2Θ, while the true diffraction angle at the reflection point P is denoted by the lowercase Greek letter 2θ in this article.
The difference of the apparent and true diffraction angles Δ2Θ ≡ 2Θ − 2θ is exactly expressed by a function of the apparent diffraction angle 2Θ, goniometer radius R and the depth −z,
 $$f( {z; \;2{\rm \Theta }, \;R} ) = 2{\rm \Theta }-2\arctan \left({\tan {\rm \Theta }-\displaystyle{z \over {R\cos {\rm \Theta }}}} \right)$$
The first-order approximation of the function expressed by Eq. (1) is simply given by
 $$f( {z; \;2{\rm \Theta }, \;R} ) \approx \displaystyle{{2z\cos {\rm \Theta }} \over R}$$
B. Sample transparency aberration function
The intensity of the diffracted beam reflected at the depth −z is expressed by
 $$g( {z; \;2\theta , \;\mu } ) = \displaystyle{{2\mu } \over {\sin \theta }}\exp \left({\displaystyle{{2\mu z} \over {\sin \theta }}} \right)$$
Note that the function g(z; 2θ, μ) expressed by Eq. (3) can be regarded as the density function normalized to the case of hypothetical infinite thickness, t → ∞, on the assumption 2θ ≈ 2Θ. Integration for z ∈ ( −∞, 0] of the function g(z; 2θ, μ) should give the unity, and the loss of intensity caused by the finite thickness t would straightforwardly be simulated by the integration within the finite range, z ∈ [ −t, 0].
Replacement of 2θ in Eq. (3) to 2Θ, application of the first-order approximation given by Eq. (2), and the general formula for the instrumental aberration function (e.g., Ida, Reference Ida2020),
 $$\omega ( {\Delta 2{\rm \Theta }} ) = \int_{{-}t}^0 {{\rm \delta }( {\Delta 2{\rm \Theta }-f( {z; \;2{\rm \Theta }, \;R} ) } ) g( {z; \;2\theta , \;\mu } ) {\rm \;d}z} $$
where δ(x) is the Dirac delta function, give the first-order approximate formula for the sample transparency aberration function as has been already reported (Ida and Kimura, Reference Ida and Kimura1999),
 $$\omega ( {\Delta 2{\rm \Theta }} ) \approx \left\{{\matrix{ {\displaystyle{1 \over \gamma }\exp \left({\displaystyle{{\Delta 2{\rm \Theta }} \over \gamma }} \right)}, & {[ {-u < \Delta 2{\rm \Theta } < 0} ] } \cr 0, & {[ {{\rm elsewhere}} ] } } } \right.$$
 $$\gamma \equiv \displaystyle{{\sin 2{\rm \Theta }} \over {2\mu R}}$$
 $$u\equiv \displaystyle{{2t\cos {\rm \Theta }} \over R}$$
Note that the function expressed by Eqs (5)–(7) is not normalized for the finite thickness t, and the integration of ω(Δ2Θ) about Δ2Θ should still give the relative intensity reduced by the finite thickness. The value γ expressed by Eq. (6) is regarded as decay width, and the value expressed by Eq. (7) is regarded as truncation width, and both the expressions are scaled on 2Θ.
The author would like to emphasize that it is not difficult to evaluate the exact values of the sample transparency aberration function ω(Δ2Θ) by a numerical method without application of any order of approximation or the replacement of 2θ by 2Θ, as shown in one of the previous studies (Ida, Reference Ida2020).
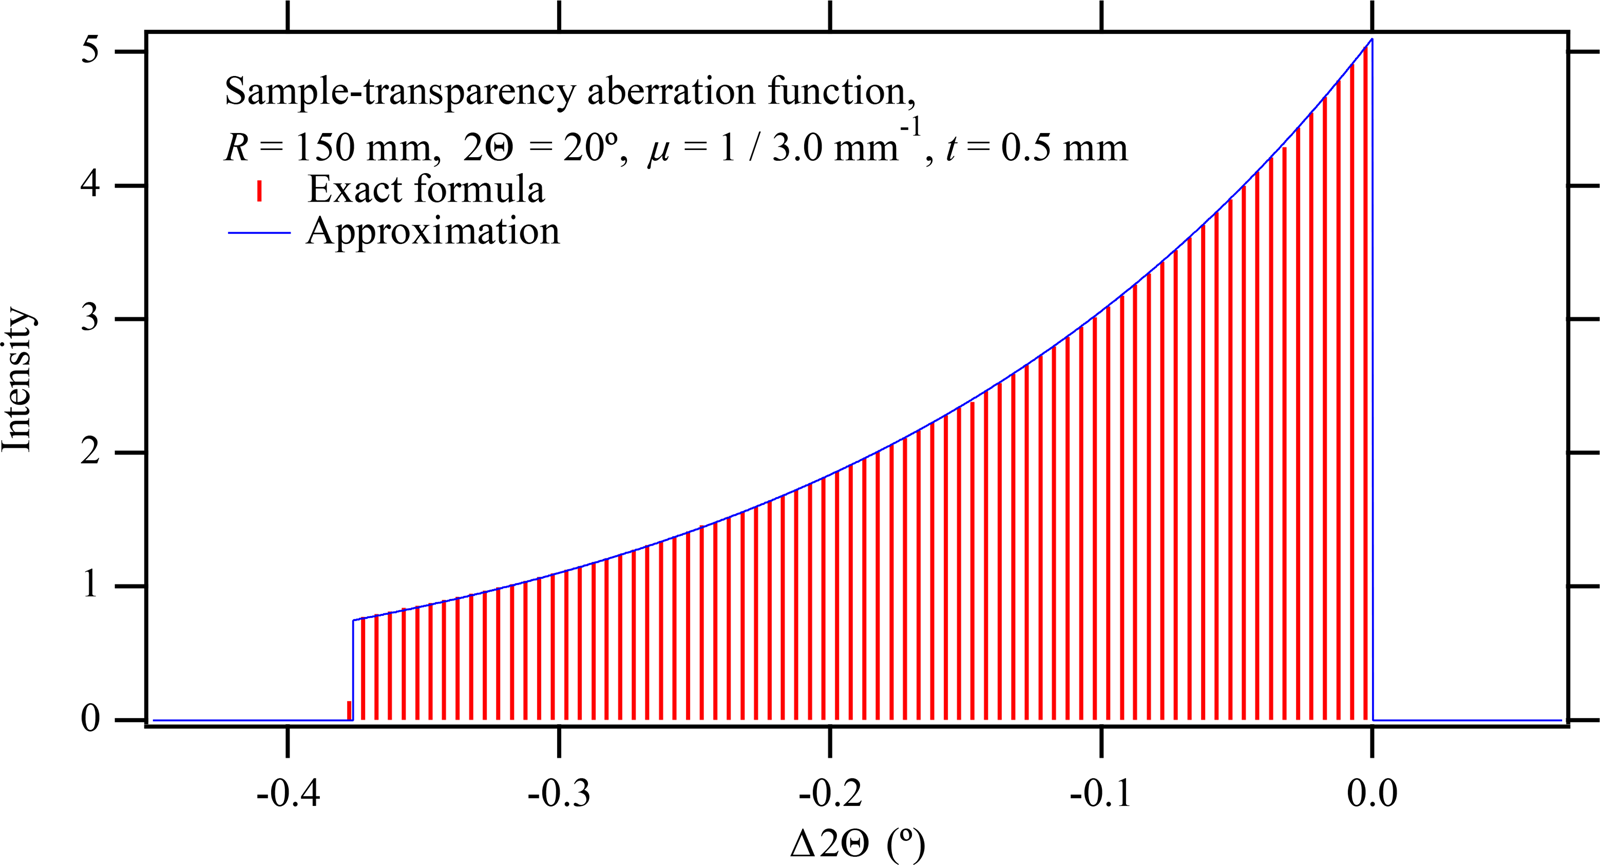
Figure 2 compares the values of the aberration function based on the first-order approximation, given by Eqs (5)–(7), and the results of numerical calculation based on the exact geometrical relation given by Eq. (1), as expressed by 100-bin histogram of 10 000 sample values for the case R = 150 mm, t = 0.5 mm, μ −1 = 3 mm, and  $2{\rm \Theta } = 20^\circ$. The penetration depth of μ −1 = 3 mm is a realistic value for loosely packed powder of organic compounds. It is not difficult to increase the number of bins and sampling points in numerical calculation. It is confirmed that the first-order approximation and simplification does not cause any detectable deviation from the exact values, in this particular case.
Numerical and approximate sample transparency aberration functions for the case R = 150 mm, t = 0.5 mm, μ −1 = 3 mm, and  $2{\rm \Theta } = 20^\circ$. The numerically evaluated function is displayed as the 100-bin histogram for 10 000 sample values.

C. Cumulants of the sample transparency aberration function
It is much easier to evaluate the cumulants of the exact aberration function than the function itself, as it has been shown in the previous study on the equatorial aberration in the continuous-scan integration data with a silicon strip X-ray detector (CSI-SSXD; Ida, Reference Ida2020). In the case of equatorial aberration in the CSI-SSXD data, 4 × 4 point two-dimensional Gauss–Legendre quadrature has given accurate values of cumulants about the exact formula. Evaluation of the cumulants of sample transparency aberration may appear easier than that of equatorial aberration, because it can be evaluated by one-dimensional integral.
The k-th power average s k of the exact sample transparency aberration is calculated by the following equations:
 $$s_k = \displaystyle{1 \over 2}\left[{1-\exp \left({-\displaystyle{{2\mu t} \over {\sin {\rm \Theta }}}} \right)} \right]\mathop \sum \limits_{\,j = 0}^{N-1} W_jf_j^k \;\displaystyle{{\sin {\rm \Theta }} \over {\sin \theta _j}}\;\xi _j^{( ( \sin {\rm \Theta }/\sin \theta _j) -1) } $$
 $$f_j = 2{\rm \Theta }-2\theta _j$$
 $$\sin \theta _j = \left\{{1 + {\left[{\left({1-\displaystyle{{\ln \xi_j} \over {2\mu R}}} \right)\tan {\rm \Theta }} \right]}^{{-}2}} \right\}^{{-}1/2}$$
 $$\xi _j = \displaystyle{1 \over 2}\left[{( {1-X_j} ) \exp \left({-\displaystyle{{2\mu t} \over {\sin {\rm \Theta }}}} \right) + 1 + X_j} \right]$$
where {X j} and {W j} (j = 0, …, N − 1) are abscissa and weights of the N-term Gauss–Legendre quadrature. The formulas of Eqs (8) and (11) assume that X j ∈ ( − 1, 1) and  $\sum\nolimits_{j = 0}^{N-1} {W_j = 2}$, similarly to the way applied in most of numerical libraries (e.g., Abramowitz and Stegun, Reference Abramowitz and Stegun1964; Press et al., Reference Press, Teukolsky, Vetterling and Flannery2007). The first to fourth cumulants, κ k (k = 1, 2, 3, 4), are calculated by
 $$\kappa _1 = \displaystyle{{s_1} \over {s_0}}$$
 $$\kappa _2 = \displaystyle{{s_2} \over {s_0}}-\displaystyle{{s_1^2 } \over {s_0^2 }}$$
 $$\kappa _3 = \displaystyle{{s_3} \over {s_0}}-\displaystyle{{3s_2s_1} \over {s_0^2 }} + \displaystyle{{2s_1^3 } \over {s_0^3 }}$$
 $$\kappa _4 = \displaystyle{{s_4} \over {s_0}}-\displaystyle{{4s_3s_1} \over {s_0^2 }}-\displaystyle{{3s_2^2 } \over {s_0^2 }} + \displaystyle{{12s_2s_1^2 } \over {s_0^3 }}-\displaystyle{{6s_1^4 } \over {s_0^4 }}$$
The reduced cumulants  $\kappa _k^{( {1/k} ) }$ defined by
 $$\kappa _k^{( {1/k} ) } \equiv {\rm sign}( {\kappa_k} ) \vert {\kappa_k} \vert ^{1/k}$$
 $${\rm sign}( x ) \equiv \left\{{\matrix{ 1, & {[ {x > 0} ] } \cr 0, & {[ {x = 0} ] } \cr {-1}, & {[ {x < 0} ] } \cr } } \right.$$
makes the comparison of different-order cumulants easier, as in the case of the comparison of the arithmetic mean (first-order cumulant) and the standard deviation (square root of the second-order cumulant).
The k-th power average  $s_k^{( {\rm A} ) }$ of the approximate sample transparency aberration function ω(Δ2Θ) given by Eq. (5) is calculated by the following recursion formula:
 $$s_k^{( {\rm A} ) } = {-}( {-u} ) ^k{\rm \;exp}( {-u/\gamma } ) -\gamma k\;s_{k-1}^{( {\rm A} ) }, \quad( {k = 1, \;\;2, \ldots } ) $$
 $$s_0^{( {\rm A} ) } = 1-{\rm \;exp}( {-u/\gamma } ) $$
where γ and u are given by Eqs (6) and (7).
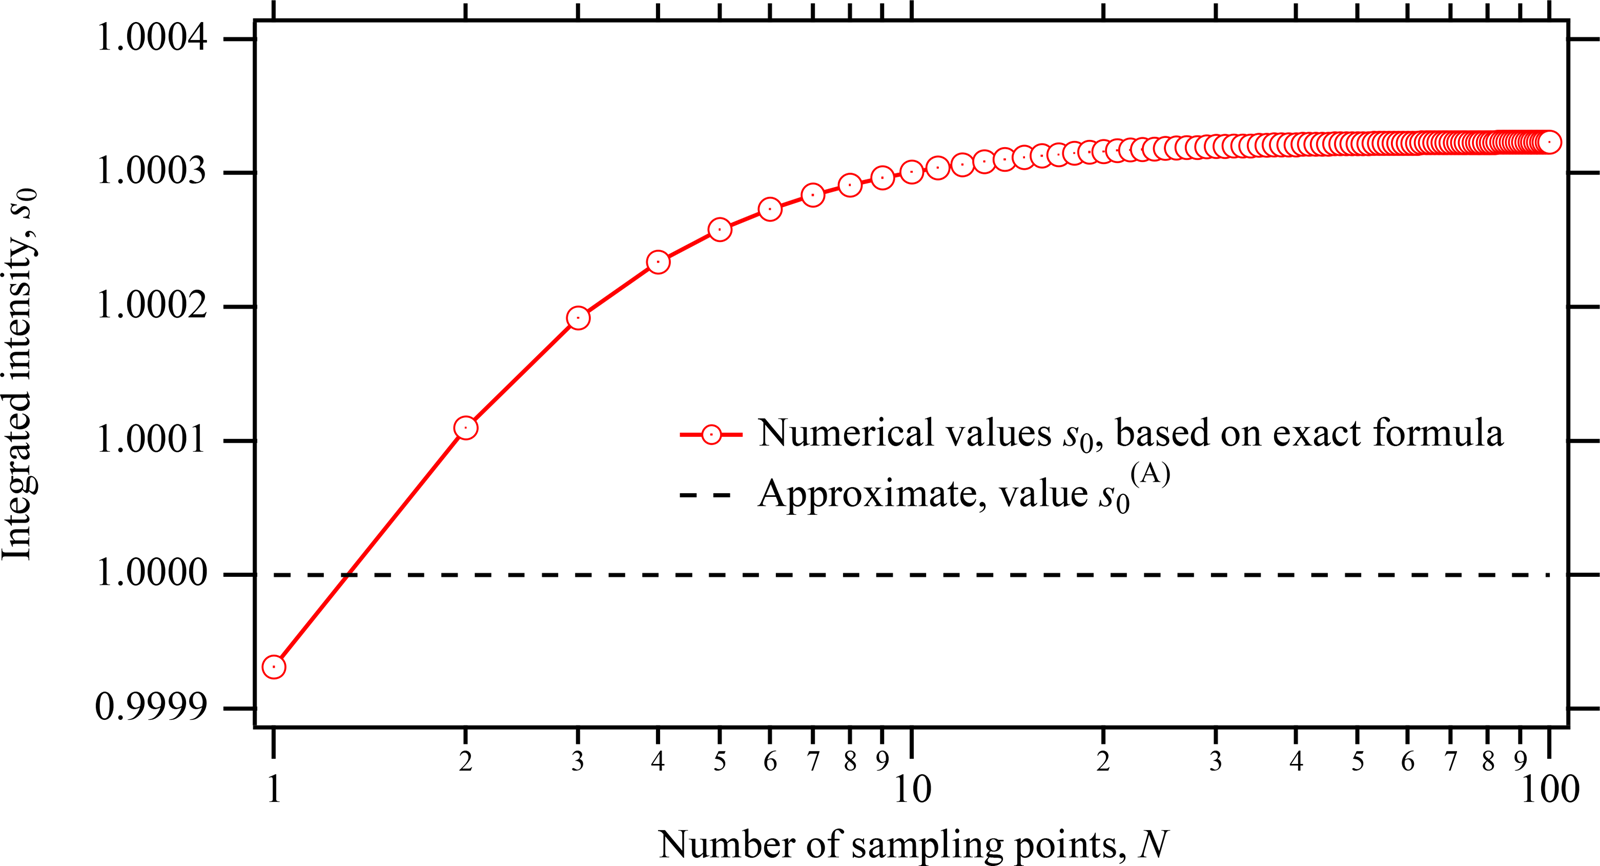
Figure 3 plots the values of the integrated intensity of the exact and approximate aberration functions, s 0 and  $s_0^{( {\rm A} ) }$, calculated for the case R = 150 mm, t = 0.5 mm, μ −1 = 0.1 mm, and
 $2{\rm \Theta } = 20^\circ$. The approximate value
 $s_0^{( {\rm A} ) }$ is directly calculated by Eq. (19), and it results in
 $s_0^{( {\rm A} ) } = 1.0000$ in this case, even though the value is still slightly smaller than unity. The exact value s 0 calculated by numerical integral based on the exact formula, slowly approaches to the value 1.0003 on increasing the number of sampling points for numerical integration. It may be emphasized that the difference between
 $s_0^{( {\rm A} ) }$ and s 0 is practically negligible.
Numerical and approximate values of the integrated intensity of sample transparency aberration functions for the case R = 150 mm, t = 0.5 mm, μ −1 = 0.1 mm, and  $2{\rm \Theta } = 20^\circ$.

One may think it should be strange that the exact value s 0 converges to the value larger than unity, but it would be explained as follows. The value s 0 is defined as it is normalized for the hypothetical case of 2θ = 2Θ, as defined by Eq. (8), to avoid introducing further complexity. The true diffraction angle 2θ is always higher than 2Θ, as can be seen in Figure 1. Since the total path length is proportional to 1/sinθ, the real path length should be shorter than the value calculated on the assumption of 2θ = 2Θ. Shorter path length naturally results in stronger intensity.
The slow convergence on increasing the number of sampling points N looks unfavorable from the point of view of computing efficiency. It also suggests that the Gauss–Legendre quadrature may not be effective to improve the accuracy of the calculation.
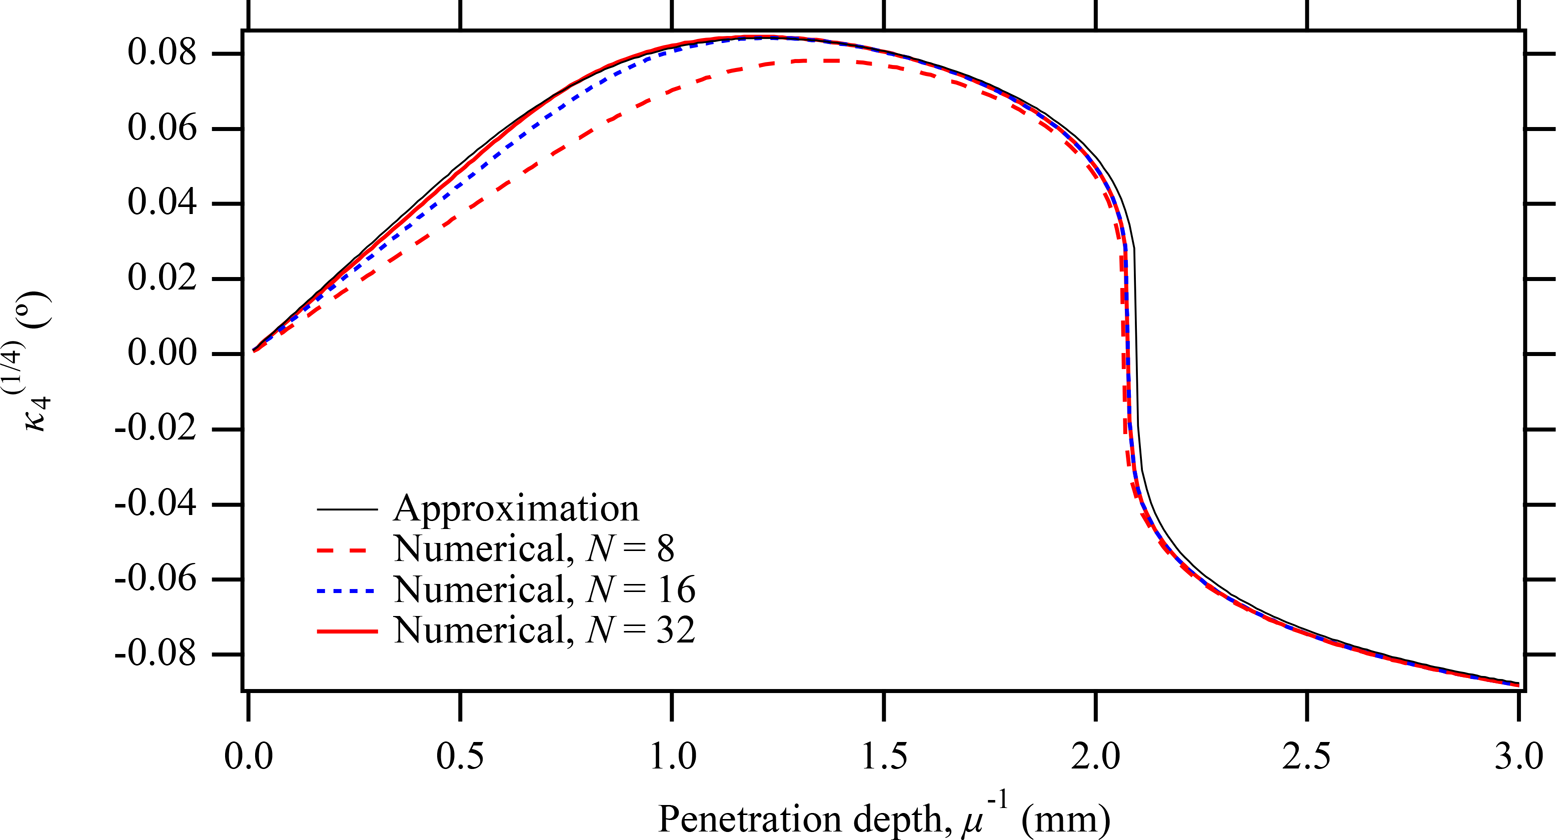
It is naturally expected that the accuracy and efficiency of the calculation depend on the assumed values of parameters. What should be concerned is the penetration depth μ −1, because it should be about 1 mm for organic materials, and about 0.01 mm for inorganic material including heavy elements, while the values of the goniometer radius R and the specimen thickness t do not change significantly, in a realistic measurement system. Figure 4 plots the reduced fourth-order cumulants  $\kappa _4^{( {1/4} ) }$, calculated for the case R = 150 mm, t = 0.5 mm, and
 $2{\rm \Theta } = 20^\circ$, on variation of the penetration depth μ −1, and different number of sampling points N for the numerical integral.
Approximate and numerical values of  $\kappa _4^{( {1/4} ) }$ for the case R = 150 mm, t = 0.5 mm, and
 $2{\rm \Theta } = 20^\circ$ on variation of the penetration depth μ −1.

Evaluation of higher order cumulants generally becomes more difficult in computation, while higher order cumulants are less significant in practical analyses. The numerically evaluated values of  $\kappa _4^{( {1/4} ) }$ for the number of sampling points N = 8 and N = 16 are clearly wrong, as can be seen in Figure 4. The values obtained for N = 32 is practically correct in this case, but it will be difficult to determine the number N to optimize both the accuracy and computing efficiency in general cases.
The values of  $\kappa _4^{( {1/4} ) }$ calculated by the approximate formula are slightly deviated from the exact values. The most significant difference appears at μ −1 ≈ 2.1 mm in Figure 4, where
 $\kappa _4^{( {1/4} ) }$ changes the signal from positive to negative on extending the penetration depth. However, the difference along the horizontal axis μ −1 should have a wider allowable range, because it is practically difficult to evaluate the exact value of the penetration depth of the specimen experimentally, or to prepare a powder specimen with high homogeneity of linear attenuation coefficient μ.
It is concluded that the use of the formula derived from the first-order approximation is more reasonable and secure for treating the sample transparency aberration, because it is difficult to achieve both high accuracy and efficiency on the numerical calculation based on the exact geometrical relation.
D. Convolution of sample transparency aberration
Using the first-order approximation, as described in Section II.C, it is straightforward to derive the mathematical formulas for convolution. The approximate formula of the instrumental function ω(Δ2Θ) given by Eq. (5) can nominally be expressed by the following formula of convolution of component functions ω T(Δ2Θ) and ω S(Δ2Θ) on the 2Θ scale,
 $$\omega ( {{\rm \Delta }2{\rm \Theta }} ) = \omega _{\rm T}( {{\rm \Delta }2{\rm \Theta }} ) \ast \;\omega _{\rm S}( {{\rm \Delta }2{\rm \Theta }} )$$
 $$\omega _{\rm T}( {{\rm \Delta }2{\rm \Theta }} ) = \left\{{\matrix{ {\displaystyle{1 \over \gamma }{\rm \;exp}\left({\displaystyle{{{\rm \Delta }2{\rm \Theta }} \over \gamma }} \right)}, & {[ {{\rm \Delta }2{\rm \Theta } \le 0} ] } \cr 0, & {[ {{\rm \Delta }2{\rm \Theta } > 0} ] } \cr } } \right.$$
 $$\omega _{\rm S}( {{\rm \Delta }2{\rm \Theta }} ) = {\rm \delta }( {{\rm \Delta }2{\rm \Theta }} ) -\exp \left({-\displaystyle{u \over \gamma }} \right){\rm \delta }( {{\rm \Delta }2{\rm \Theta } + u} ) $$
The function ω T(Δ2Θ) represents the decay effect for infinitely thick sample, and the function ω S(Δ2Θ) represents the truncation effect caused by the finite thickness of the sample.
As the decay width γ on the 2Θ scale is expressed by Eq. (6), a scale transform from 2Θ to χ T, expressed by
 $$\chi _{\rm T} = \int \displaystyle{{{\rm d}2{\rm \Theta }} \over \gamma } = 2\mu R\ln \tan {\rm \Theta }$$
should be used for treating the decay effect (e.g., Ida and Toraya, Reference Ida and Toraya2002). The decay effect of the X-ray beam should be expressed by the convolution with a function w T(χ T) on the χ T scale,
 $$w_{\rm T}( {\chi_{\rm T}} ) = \left\{{\matrix{ {\exp ( {\chi_{\rm T}} ) }, & {[ {\chi_{\rm T} \le 0} ] } \cr 0, & {[ {\chi_{\rm T} > 0} ] } \cr } } \right.$$
for the intensity values η T on the χ T scale, calculated from the observed powder scattering intensity values y by the equation,
 $$\eta _{\rm T} = \gamma y = \displaystyle{{\sin 2{\rm \Theta }} \over {2\mu R}}{\rm \;}y$$
The treatment of the effects of the truncation width u on the 2Θ scale, given by Eq. (7), may also be straightforward. Using another scale transform from (2Θ, y) to (χ S, η S), given by
 $$\chi _{\rm S} = \int \displaystyle{{{\rm d}2{\rm \Theta }} \over u} = \displaystyle{R \over t}\;\ln \left[{\displaystyle{2 \over {1-\tan ( {{\rm \Theta }/2} ) }}-1} \right]$$
 $$\eta _{\rm S} = uy\exp \left({-\displaystyle{{u\chi_{\rm S}} \over \gamma }} \right)$$
the effect of the finite thickness t of the specimen is expressed by the convolution with a function w S(χ S) on the χ S scale, given by
 $$w_{\rm S}( {\chi_{\rm S}} ) = {\rm \delta }( {\chi_{\rm S}} ) -{\rm \delta }( {\chi_{\rm S} + 1} ) $$
The observed X-ray scattering intensity profile expressed by (2Θ, y) may appear the convolution with the instrumental function ω(Δ2Θ) given by Eq. (5), or double convolution with the component functions ω T(Δ2Θ) and ω S(Δ2Θ) given by Eqs (21) and (22) within a narrow angular range of 2Θ. But the whole diffraction data cannot be treated as the convolution with an instrumental function ω(Δ2Θ) on the 2Θ scale, while they can exactly be expressed by the double convolution with the function w T(χ T) given by Eq. (24) on the χ T scale and w S(χ S) given by Eq. (28) on the χ S scale.
However, the intensity values η S expressed by Eq. (27) typically need more than 15 bits for the exponent part of the floating point number, while 11 bits are allocated for the exponent part in the IEEE 754-1985 64-bit floating point number, which is commonly used in popular numerical computing systems. IEEE 754-2005 128-bit floating point number, which is not popular at this moment, still has only 15 bits for the exponent part. We can use the values of the logarithm lnη S instead of η S, but arithmetic operations about the logarithm are likely to cause confusion for the users of the theory.
In this article, the author would like to show another route to treat the effect of the finite thickness t of the specimen on sample transparency aberration. The scale transform about abscissa, given by Eq. (26), is unchanged. The following expression about η S for the intensity scaling is used,
 $$\eta _{\rm S} = uy$$
instead of Eq. (27), and a nominal aberration function is then expressed by
 $$w_{\rm S}( {\chi_{\rm S}} ) = {\rm \delta }( {\chi_{\rm S}} ) -\exp \left({-\displaystyle{u \over \gamma }} \right){\rm \delta }( {\chi_{\rm S} + 1} ) $$
Note that the application of the nominal aberration function w S(χ S) expressed by Eq. (30) partly destroys the convolution relation, similarly to that the intensities y on the 2Θ scale cannot exactly be the convolution with the function ω(Δ2Θ) expressed by Eq. (5), in the context for treating whole the powder diffraction pattern.
Since the convolution with the Dirac delta function is identical to the identity conversion, or doing nothing, the convolution with the function given by Eq. (30) can be implemented as the combination of multiplication, horizontal shift, and subtraction, even if the treatment may be irregular in the standard context of convolution.
E. Deconvolutional treatment about sample transparency aberration
The deconvolutional treatment about the truncation effect caused by the finite thickness of t of the specimen on sample transparency aberration is equivalent with the speculation of hypothetical diffraction profile for the infinitely thick (t → ∞) specimen. The treatment will broaden the apparent diffraction peak profile. The application of the deconvolutional treatment may appear discouraging for powder diffraction users, because narrower peak profile is generally more favorable than broadened peak shape. But the recovery of lost intensity, appropriate correction of partially shifted peak locations and partially deformed peak shapes, are expected to be achieved by the deconvolutional treatment about the finite thickness of the specimen. The treatment is still advantageous on combined use of software, where no consideration of finite thickness of the specimen is incorporated. The formulation of the deconvolutional treatment about the sample transparency aberration for finite thickness is described in this section.
The deconvolutional treatment corresponding to the function w S(χ S) given by Eq. (30) is identical to the convolution with the function  $w_{\rm S}^{( {-1} ) } ( {\chi_{\rm S}} )$, given by
 $$w_{\rm S}^{( {-1} ) } ( {\chi_{\rm S}} ) = {\rm \delta }( {\chi_{\rm S}} ) + \mathop \sum \limits_{\,j = 1}^\infty \exp \left({-\displaystyle{u \over \gamma }\;j} \right){\rm \delta }( {\chi_{\rm S} + j} ) $$
When the intensity data on the χ S scale is given by η S(χ S) = ζ S(χ S)*w S(χ S), the deconvolutionally treated intensity data ζ S(χ S) are then calculated by
 $$\zeta _{\rm S}( {\chi_{\rm S}} ) = \eta _{\rm S}( {\chi_{\rm S}} ) + \mathop \sum \limits_{\,j = 1}^\infty \exp \left({-\displaystyle{u \over \gamma }\;j} \right)\eta _{\rm S}( {\chi_{\rm S} + j} ) $$
It may be noted that the deconvolutional treatment on the linear combination of the Dirac delta functions is identical to the deconvolution in the original meaning.
The expressions as infinite series in Eqs (31) and (32) may also appear discouraging, but it is not difficult to implement automatic termination of iterative addition, on the condition that the relative intensity of the next term becomes smaller than a small number, ɛ = 10−6, for example.
A standard method based on the Fourier and inverse Fourier transforms can be applied on the deconvolutional treatment about the decay effect expressed by Eqs (23)–(25), and the details about the implementation are omitted in this article.
III. SIMULATIONS
A. Convolution about sample transparency aberration
A set of artificial powder diffraction data is synthesized as the convolution of Cu Kα 1 X-ray spectroscopic profile with the sample transparency aberration.
The artificial diffraction profile of Cu Kα 1 X-ray is constructed on another scale (e.g., Ida and Toraya, Reference Ida and Toraya2002) given by
 $$\chi _{\rm X} = \int \displaystyle{{{\rm d}2{\rm \Theta }} \over {2\tan {\rm \Theta }}} = \ln \sin {\rm \Theta }$$
 $$\eta _{\rm X} = 2y\tan {\rm \Theta }$$
and locating the Lorentzian functions given by
 $$\eta _{\rm X} = f_{\rm L}( {\chi_{\rm X}-\chi_{{\rm X}, i}; \;w} )$$
 $$f_{\rm L}( {x; \;w} ) = \displaystyle{1 \over {{\rm \pi }w}}\left[{1 + {\left({\displaystyle{x \over w}} \right)}^2} \right]^{{-}1}$$
 $$\chi _{{\rm X}, i} = \ln \sin {\rm \Theta }_i$$
for peak locations {2Θi}. Note that the peak profile is unchanged on the χ X scale, and half width at half maximum (HWHM), w, of the Lorentzian function has the common value on the χ X scale, independent of the peak locations {2Θi}. The value w = 0.000142 is applied here, based on a doublet model for the Cu Kα X-ray spectroscopic profile (Deutsch et al., Reference Deutsch, Förster, Hölzer, Härtwig, Hämäläinen, Kao, Huotari and Diamant2004). Lorentzian peaks are located at  $2{\rm \Theta }_i = 10^\circ , \;30^\circ , \;\ldots , \;130^\circ$.
The decay and truncation components of the sample transparency aberration are successively convolved, by the method described in Section II.D, assuming the values R = 150 mm, μ −1 = 3 mm, and t = 0.5 mm.
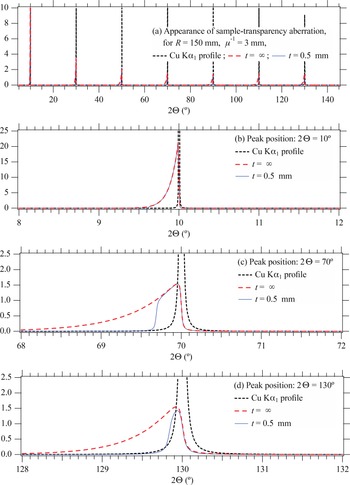
The results of the calculation of convolution are shown in Figure 5.
Convolution of Cu Kα 1 profile and sample transparency aberration for the case R = 150 mm, t = 0.5 mm, and μ −1 = 3 mm. (a) Overall profile, and individual peak profile located at (b)  $2{\rm \Theta } = 10^\circ$, (c)
 $2{\rm \Theta } = 70^\circ$, and (d)
 $2{\rm \Theta } = 130^\circ$.

The convolution process about the decay component of the sample transparency aberration on the scale (χ T, η T) generates the profile for the infinitely thick (t → ∞) specimen. The process about the truncation effect on the (χ S, η S) scale naturally corresponds to the subtraction of the intensities expected for the reflection from the phantom specimen at the depth deeper than the real thickness, that is, −z < −t.
The effect of sample transparency causes significant asymmetric deformation of the diffraction peak profile at low diffraction angles as can be seen in Figure 5(b), where the decay effects of the aberration are dominant, while the simulated peak profile shows low asymmetry at high diffraction angles, as shown in Figures 5(c) and 5(d), where the truncation effects are dominant.
B. Deconvolutional treatments about sample transparency aberration
The deconvolutional treatments described in Section II.E are applied to the artificial powder diffraction data synthesized by the method described in Section III.A.
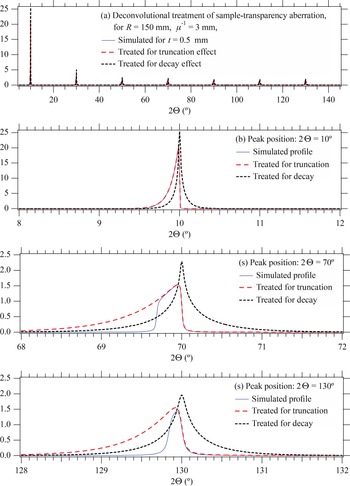
Figure 6 shows the change of the diffraction intensity profile on the deconvolutional treatments. The deconvolutional treatment about the truncation effect naturally results in the profile speculated for the infinitely thick (t → ∞) specimen. The loss of intensity caused by the finite thickness of specimen is recovered on this process. Notable changes in the diffraction peak profile are observed on the deconvolutional treatment about the decay effect of sample transparency. It corrects the average peak shift and asymmetric deformation and gives symmetric peak profile located at the correct position. The shift-corrected symmetrized peak profile has broadened width as compared with the simulated observed peak profile, but the shape of the peak may appear rather sharper than the observed one, as shown in Figures 6(c) and 6(d).
Deconvolutional treatment about sample transparency aberration.

C. Discussions on the symmetrized peak profile
As the symmetrized peak profile shown in Figure 6 appear extremely sharp, one may think it is analogous to the so-called super-Lorentzian peak profile, observed for samples with a broad crystallite size distribution (Ida et al., Reference Ida, Shimazaki, Hibino and Toraya2003). However, the situation is clearly different, because the profile should be the convolution of the Lorentzian function and a sharp symmetrized function in this case.
The standard deviation of the truncated exponential function given by Eq. (21) is unity, and the (excess) kurtosis is 6. Since the deconvolutional treatment does not change the values of the even order cumulants (Ida et al., Reference Ida, Ono, Hattan, Yoshida, Takatsu and Nomura2018), the symmetrized instrumental function also has the kurtosis of 6.
The author has proposed (Ida, Reference Ida2021) a model for a symmetrized instrumental profile, which may be called as the symmetric Rosin-Rammler type function, the positive side of which is identical to the density function of the Rosin-Rammler distribution (Rosin and Rammler, Reference Rosin and Rammler1933), expressed by
 $$f_{{\rm SRR}}( {x; \;g, \;h} ) \equiv \displaystyle{h \over {2g}}\left({\displaystyle{{\vert x \vert } \over g}} \right)^{h-1}\exp \left[{-{\left({\displaystyle{{\vert x \vert } \over g}} \right)}^h} \right]$$
where g is the width parameter, and h is the shape parameter, and the kurtosis becomes 6 for the value of shape parameter h ≈ 0.85. The primitive function F SRR(x;g, h) is simply given by
 $$F_{{\rm SRR}}( {x; \;g, \;h} ) \equiv \displaystyle{{{\rm sign}( x ) } \over 2}\left\{{1-\exp \left[{-{\left({\displaystyle{{\vert x \vert } \over g}} \right)}^h} \right]} \right\}$$
and it is also easy to evaluate the inverse function of the primitive function. Then, an efficient algorithm (Ida, Reference Ida1998) can be applied to evaluate the convolution with the Lorentzian function.
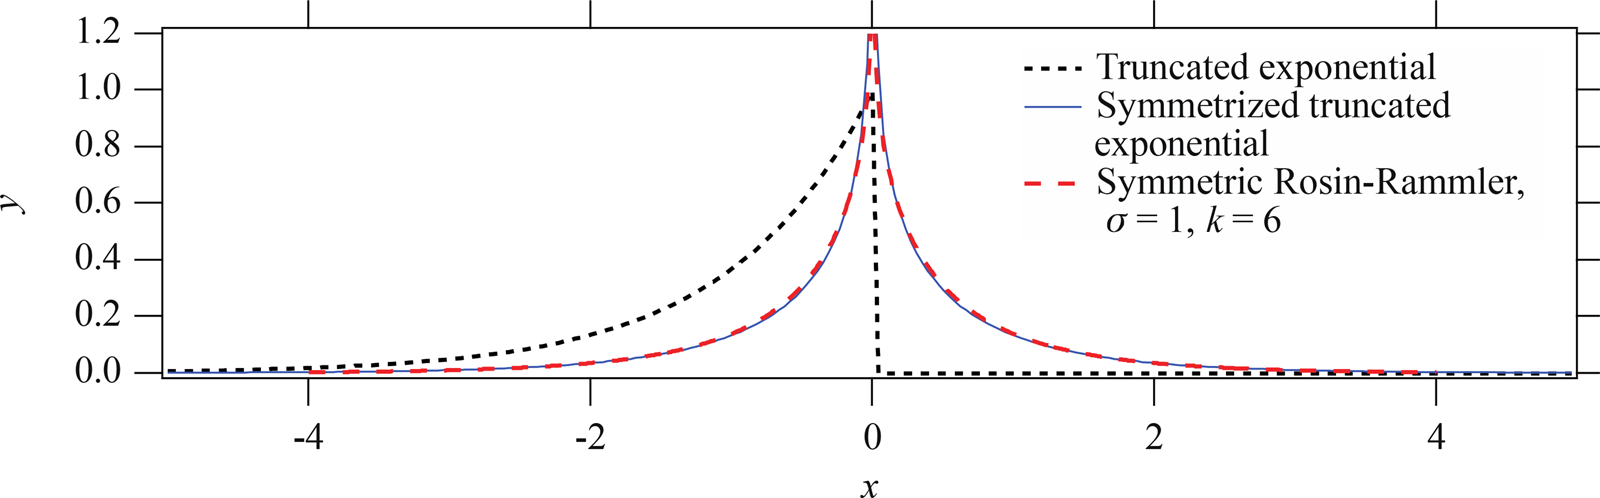
Figure 7 shows truncated exponential and symmetrized truncated exponential functions, and symmetric Rosin-Rammler function for the kurtosis of 6. The symmetrized truncated exponential function is numerically evaluated as the inverse Fourier transform of the complex absolute of the Fourier transform of the truncated exponential function. It should be noted that the symmetrized truncated exponential function cannot be identical to the symmetric Rosin-Rammler function, but it is difficult to find the difference in the plotted curves as demonstrated in Figure 7.
Truncated exponential (finely broken line), symmetrized truncated exponential (thin solid line), and symmetric Rosin-Rammler type function (coarsely broken line) with the standard deviation of unity, and the kurtosis of 6.

The Lorentzian HWHM is estimated at  $w\approx 0.035^\circ$, and the decay parameter γ, which is identical to the standard deviation σ of the truncated exponential function, is estimated at
 $\gamma = \sigma \approx 0.439^\circ$ on the 2Θ scale, for the peak located at
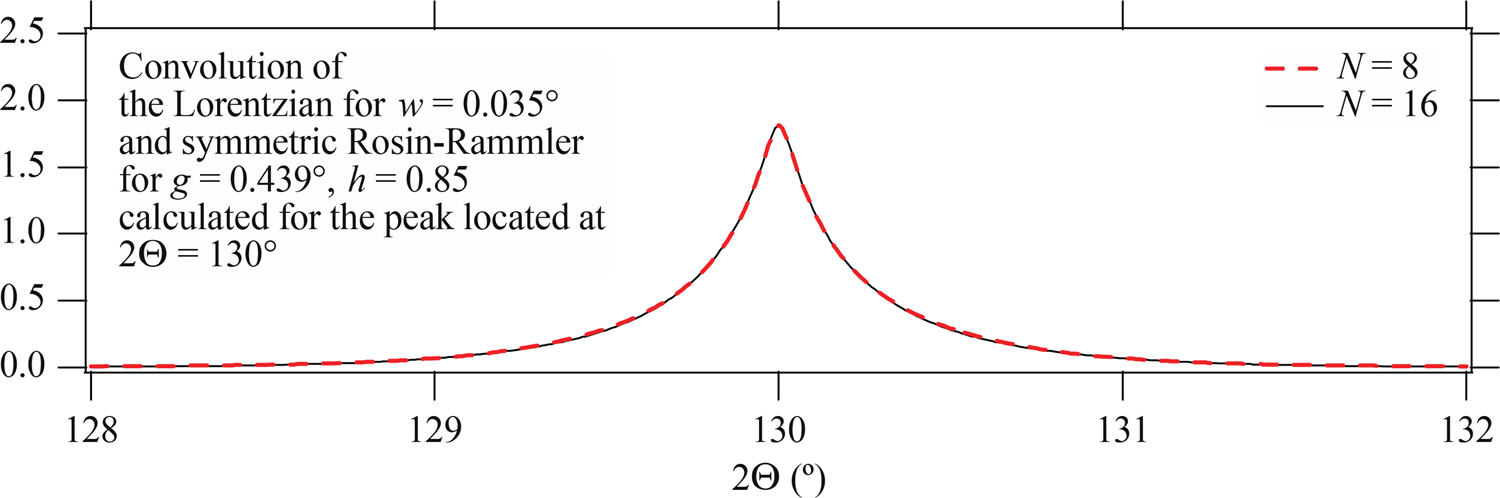
 $2{\rm \Theta } = 130^\circ$. Figure 8 shows the peak profile calculated as the numerical convolution of the Lorentzian and symmetric Rosin-Rammler type function.
Peak profile calculated by the Gauss–Legendre quadrature with sampling points of N = 8, and N = 16, as the convolution of the Lorentzian for  $w = 0.035^\circ$ and the symmetric Rosin-Rammler type function with
 $\sigma = 0.439^\circ$ and h = 0.85.

Similarity of the calculated profile shown in Figure 8 and the deconvolutionally treated profile in Figure 6(d) suggests that the symmetrized peak profile, mainly affected by the sample transparency aberration can certainly be modeled by the function defined as the convolution of the Lorentzian and the symmetric Rosin-Rammler type function.
Further details about the system of the symmetric model profile function are described in another article (Ida, Reference Ida2021).
IV. CONCLUSION
Effects of sample transparency aberration for the finite thickness of the sample are formulated as the double convolution on the different scale transforms for the decay and the truncation effects.
The deconvolutional treatments based on the convolution formulas automatically recovers the intensity loss and corrects peak shift and asymmetric deformation of the peak profile. The treated peak profile is broadened from the observed peak profile, but it does not necessarily mean disadvantage on peak profile analysis, because the profile is modeled by the convolution with a sharp symmetric function with the kurtosis of 6.
SUPPLEMENTARY MATERIAL
Python codes for deconvolutional treatments, including the treatment of sample transparency effect, example data and configuration files are given, and the assignment of the files are described in “00demo.pdf”. The supplementary material for this article can be found at https://doi.org/10.1017/S0885715622000021.