INTRODUCTION
Furrow irrigation is the dominant irrigation system for the production of field crops, being preferred over other irrigation methods (e.g. flood and/or basin irrigation) because of substantial water savings and low capital investments (Iqbal et al., Reference Iqbal, Guber and Khan2016; Siyal et al., Reference Siyal, Bristow and ˇSim˚unek2012; Siyal and Siyal, Reference Siyal and Siyal2013; Zhou et al., Reference Zhou, Li, Jin and Song2009). Despite these benefits, furrow irrigation is associated with large nitrogen (N) loss through leaching and run-off (Iqbal et al., Reference Iqbal, Guber and Khan2016; Siyal et al., Reference Siyal, Bristow and ˇSim˚unek2012; Siyal and Siyal, Reference Siyal and Siyal2013), which affects the environment and contaminate water resources. In Pakistan, a wide range of water samples (total 747) were collected from different areas, and approximately 19% of them had a nitrate concentration above the safe limit, i.e. 10 mg L−1 (Tahir and Rasheed, Reference Tahir and Rasheed2008), suggesting contamination from furrow irrigation (Siyal et al., Reference Siyal, Bristow and ˇSim˚unek2012). Furrow irrigation forces small holders in semi-arid areas of Pakistan to pay more for costly mineral fertilizers as a result of poor N use efficiency resulting from high N losses (Siyal and Siyal, Reference Siyal and Siyal2013). These constraints have made furrow irrigation questionable for sustainable agriculture, and then more efficient irrigation methods that minimize N losses and reduce costs while increasing maize yield are needed.
In Pakistan, N is mostly applied in agricultural fields through chemical and organic fertilizers (Follett and Hatfield, Reference Follett and Hatfield2001). There is a strong causal link between chemical fertilizers and adverse environmental effects such as surface and subsurface contamination and emission of greenhouse gases (Follett and Hatfield, Reference Follett and Hatfield2001; Snyder et al., Reference Snyder, Bruulsema, Jensen and Fixen2009). This has increased the use of more stable sources of N such as organic manure, such as poultry manure (PM), farmyard manure (FYM) and pressmud (PrM) (Iqbal et al., Reference Iqbal, Guber and Khan2016, Reference Iqbal, Thierfelder, Khan, Javeed, Arif and Shehzad2017). Liu et al. (Reference Liu, Yan, Mei, He, Bing, Ding, Liu, Liu and Fan2010) and Iqbal et al. (Reference Iqbal, Thierfelder, Khan, Javeed, Arif and Shehzad2017) have shown that using organic manures is a more sustainable, economic and safe way of providing N to crops. These manures may enhance soil physicochemical properties (electrical conductivity, pH, organic matter and water retention capacity) and then crop yield (Khaliq and Abbasi, Reference Khaliq and Abbasi2015; Thangarajan et al., Reference Thangarajan, Bolan, Tian, Naidu and Kunhikrishnan2013). One option to reduce N loss is to use organic manures that release nutrients slowly (Laird et al., Reference Laird, Fleming, Wang, Horton and Karlen2010). However, continuous application of manures in soils with low nutrient holding capacity under furrow irrigation may have the same level of threat as chemical fertilizer (Iqbal et al., Reference Iqbal, Guber and Khan2016). Alternatively, the use of organic manure with increasing ridge size would reduce the number of furrows in each field that can potentially leach N from soil, without compromising plant population and yield. At this time, there are no reliable data proving that N loss is minimized when increasing ridge size and using manure.
We therefore evaluated different organic manures – commonly found in Pakistan – under different ridge to furrow ratios. We hypothesized that a combination of large ridge size with organic manure reduces N loss through run-off and leaching and increases maize yield. The specific objectives of this research were to quantify the N dynamics and changes in soil properties after application of organic manures in different ridge to furrow ratios, and also evaluate maize yield in each soil management. Maize was chosen as the test crop because it is the most important cereal worldwide and very sensitive to N fertilization (Berrada and Halvorson, Reference Berrada and Halvorson2012; Shiferaw et al., Reference Shiferaw, Boddupalli, Prasanna and Bänziger2011).
MATERIALS AND METHODS
Site description
The research was conducted at the Agronomic Research Area at The University of Agriculture Peshawar (34°0′28″N, 71°34′24″E), Pakistan during spring time in 2016. Maize, wheat and sugarcane are the important crops of this area and manures (e.g. PM, FYM and PrM) are normally being incorporated in soils to enhance their fertility for crop production. The Peshawar has a semi-arid climate with very hot summers and mild winters. Annual air temperature averages 22.7 °C and annual rainfall averages 360 mm. The experimental soil was a well-drained silty clay loam, with an electrical conductivity (ECe) of 0.34 dS m−1 and pH of 8.1 within soil upper layer (until 15 cm). The soil had adequate available potassium (0.109 g kg−1) but was deficient in nitrogen (inorganic 10.35 kg ha−1, organic 0.032 g kg−1 and total nitrogen 0.037 g kg−1), available phosphorus (0.004 g kg−1) and organic matter (0.58%).
Experiment
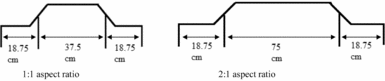
The field experiment was carried out in a Randomized Complete Block Design (RCBD), with split plot arrangement using four replications and a net plot area of 6 × 3 m. The experiment consisted of two factors: ridge to furrow ratios as 1:1 and 2:1 (Figure 1); and organic manures, using PM, FYM and PrM to fulfill N amount (250 kg ha−1) recommended by the University extension services for maize production. The PM, FYM and PrM was composed by 210–19.8–14.5, 6.7–5.3–3.4 and 13.3–4.5–5.5 g kg−1 of N–P–K, respectively. There was also an unfertilized control treatment. Ridge to furrow ratios were randomized as main plots, whereas organic manures were as subplots.
Sketch of furrow geometry for two ridge to furrow aspect ratios.

Surface soil samples (upper 15 cm layer) were incubated under field condition using the in-situ buried nylon bag (9.5 × 18 cm) technique to assess N dynamics (15 days intervals) during the whole maize growing season (Cusick et al., Reference Cusick, Powell, Kelling, Hensler and Munoz2006). The soil was ground (<0.5 mm), sieved (2 mm) and mixed with manure (PM, FYM and PrM) to achieve a total application rate equivalent to 250 kg N ha−1 as per treatment, and then placed in nylon bags. For control, only soil was placed in the bags. The bags spaced 25 cm were buried (15 cm depth) in the centre of rows in each plot. Three bags were used for analysis at each sampling interval. The soil moisture content was maintained at 60% of field capacity (FC) through manual irrigation. Irrigation amounts were determined as the weight difference between the theoretical maximum weight at 60% FC and the bag weight (Aussenac, Reference Aussenac2000).
Crop husbandry
Field was plowed once and cultivated twice followed by levelling once with the tractor mounted plough, cultivator and leveller, respectively. Then, seedbed field was cultivated twice and levelled once. The maize (Zea mays L.) hybrid CS200 was sown on March 2, 2016, on ridges (Figure 1) with a manual dibbling method (placing two seeds per hill) using a seed rate of 30 kg ha−1. Space between maize plants within ridges was 25 cm and between ridges was 75 cm. FYM and PM were collected from the farm at the University of Agriculture Peshawar, and PrM was collected from Khazana Sugar Mill Pvt. Ltd. Organic manures were incorporated manually with a spade into the top 15 cm soil layer before seed sowing. The applied manures were balanced for P and K, and remaining quantities were applied at the time of crop sowing through single super phosphate (SSP) and sulfate of potash (SOP) to achieve125 kg P ha−1 and 125 kg K ha−1. Irrigation was applied at a rate of 340 m3 ha−1 using furrows delivered as eight events at 8 to 15-day intervals. Plants were thinned at the 3–5 leaf stage to maintain plant population at 96 plants per plot. Weeds were removed by hoeing twice. Furdan® (active ingredient carbofuran – 44 wt. %) was applied (17.3 kg ha−1) to avoid stem borer and shoot fly attack at seedling and later stages.
Sampling and measurements
Two adjacent cores (diameter = 3.2 cm) of soil were collected at 15 cm depth in each nylon bag in each plot every 15 days, mixed to make a composite sample, and then analysed for inorganic N (NH4+–N and NO3–N). Mineral N was measured in an extract obtained by shaking soil sample with KCl (1:6 soil to solution) in a rotary shaker. Extracts were filtered with a Whatman's No. 42 filter paper and analysed colorimetrically for NO3–N and NH4+–N concentrations (Alef and Nannipier, Reference Alef and Nannipier1995). The ammonification and nitrification were regarded as NH4+–N and NO3–N concentrations at different intervals (n) in soil. Cumulative ammonification and nitrification is the NH4+–N and NO3–N, respectively at time t = n and t = n + 1. The mineralizable N–No (kg ha−1) was estimated as the difference of mineral N before incubation and after 120 days.
Inorganic N in soil was determined after the crop harvest as above. Total organic nitrogen was determined before sowing and after harvest by the Kjeldhal method. The N losses in soil were estimated as follows:
 $$\begin{equation}
N\ {\rm{losses\ }}\left( {{\rm{kg\ h}}{{\rm{a}}^{ - 1}}} \right) = \left( {{\rm{Total\ }}{N_{{\rm{initial}}}} + {N_{{\rm{appl}}}}} \right) - \left( {{N_{{\rm{uptake}}}} + {\rm{Total\ }}{N_{{\rm{harvest}}}}} \right)
\end{equation}$$
where: Total N initial is the initial amount of total N (kg ha−1) in the soil before manure application, N appl is the N applied (kg ha−1) as manure treatment, N uptake is the aboveground N uptake (kg ha−1) by the plants, and Total N harvest is the amount of total soil N (kg ha−1) after harvesting the crop.
Soil organic matter was determined by the Modified Walkley–Black procedure(Nelson and Sommers, Reference Nelson, Sommers and Page1996). Soil ECe was determined by the Conductivity bridge method, and pH was measured potentiometrically with glass electrode in a mixture of soil: water at 1:2.5 w v−1 (Rhoades, Reference Rhoades and Sparks1996). Water holding capacity (WHC) was determined by the measuring the weight loss in oven-dried soil as follows (US Salinity Lab. Staff, 1954):
 $$\begin{equation}
{\rm{WHC\ }}\left( {\rm{\% }} \right) = {\rm{Loss\ in\ soil\ weight\ on\ drying}}/{\rm{Weight\ of\ oven\ dry\ soil\ }} \times 100
\end{equation}$$
Total plant yield was measured by harvesting (excluding roots) the central two rows from each plot and then plants and cobs were sun dried and weighed. Grain yield was recorded by threshing the cobs. Harvest index (HI) was calculated as a ratio of grain yield (Mg ha−1) and total plant yield (Mg ha−1) expressed as percentage (Hunt, Reference Hunt1978). For plant N uptake, 10 whole plant samples from each plot were taken, ground, and their N concentrations determined using the Kjeldhal digestion method (Bremner and Mulvaney, Reference Bremner, Mulvaney and Page1982). The N uptake was expressed as the product of N concentration (%) in the plant sample and crop yield (kg ha−1). For N recovery efficiency (NRE) the following procedure was adopted (Keeney, Reference Keeney and Stevenson1982; Zhang et al., Reference Zhang, Li, Wang, Hu, Christie, Zhang and Li2016):
 $$\begin{equation}
{\rm{NRE\ }}\left( {{\rm{kg\ k}}{{\rm{g}}^{ - 1{\rm{\ }}}}} \right) = {N_{{\rm{uptake}} - {{T}}}} - {{{N_{{\rm{uptake}} - {\rm{ctrl}}}}}}/{{{N_{{\rm{appl}}}}}}
\end{equation}$$
where: N uptake-T is the N uptake (kg) in the manure treatment, N uptake- ctrl is the N uptake (kg) in the control treatment, and N appl is the total amount of N (kg ha−1) applied.
Nitrogen use efficiency (NUE) was calculated by the procedure adopted by Cassman et al. (Reference Cassman, Dobermann, Walters and Yang2003); Zhang et al. (Reference Zhang, Li, Wang, Hu, Christie, Zhang and Li2016):
 $$\begin{equation}
{\rm{NUE\ }}\left( {{\rm{kg\ k}}{{\rm{g}}^{ - 1}}} \right) = {Y_T} - {Y_{{\rm{ctrl}}}}/{N_{{\rm{appl}}}}
\end{equation}$$
where: YT is the grain yield (kg ha−1) in the manure treatment, Y ctrl is the grain yield (kg ha−1) in the control treatment, and N appl is the same as in eq. (3).
N content in grain samples from each plot was determined by sulphuric acid digestion and micro distillationmicro–Kjeldhal method (cite the reference). Then grain protein content was determined by multiplying the grain N content by 6.25 (Helrich, Reference Helrich1990). The grain oil content was determined following the Soxhlet fat extraction method (Low, Reference Low1990). For starch content, soluble sugars were removed from samples with alcohol, and then starch was extracted with perchloric acid and measured as done by Thimmaiah (Reference Thimmaiah2004).
Statistical analysis
MSTATC statistical computer package was used to analyse the data. The significant differences among ridge to furrow ratios, organic manures and their interactions for soil N dynamics, soil physicochemical properties, maize yield and quality were analysed by using Fisher's analysis of variance (two-way ANOVA) with an associated least significant difference (LSD) at 5% probability level (Steel et al., Reference Steel, Torrie and Dickey1997). To assess the variability within treatments for N mineralization, standard errors were used.
Economic analysis
Economic analysis was conducted to estimate the incomes and benefit cost ratio (BCR) following the procedure of CIMMYT (1988). Cost of production was calculated by adding the cost of manpower, transportation, fertilizers, seed, tillage, cultivation, irrigation, harvesting and land rent and local markup (9% per annum) on investment. The gross income (GI), net income (NI) and the BCR were calculated as follow:
 $$\begin{equation}
{\rm{GI\ }}\left( {US{\rm{\$ \ h}}{{\rm{a}}^{ - 1}}} \right) = Y \times P\\
\end{equation}$$
 $$\begin{equation}
{\rm{NI\ }}\left( {US{\rm{\$ \ h}}{{\rm{a}}^{ - 1}}} \right) = {\rm{GI}} - {\rm{COP}}\\
\end{equation}$$
 $$\begin{equation}
{\rm{BCR}} = {\rm{GI}}/{\rm{COP}}
\end{equation}$$
RESULTS
Soil nitrogen dynamics
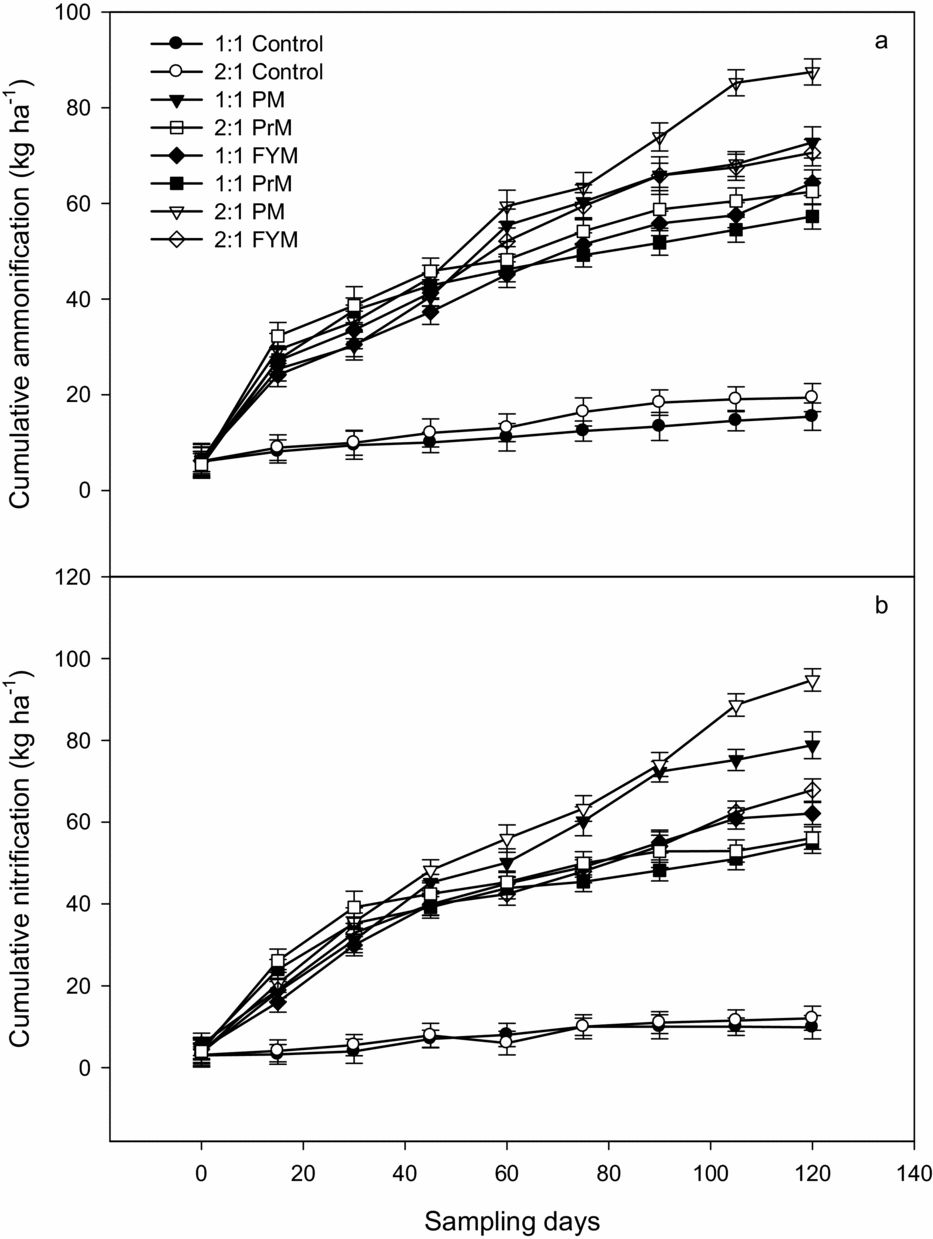
In general, cumulative ammonification and subsequent nitrification increased in all manure treatments, increasing cumulative N mineralization during incubation (Figure 2a, b). The increase of ridge to furrow ratio from 1:1 to 2:1 increased the mineralization and subsequently ammonification and nitrification processes in all manure treatments. Ammonification and nitrification were higher up to 30 days in soils treated with PrM. From 30 days up to maize harvesting (120 days), both processes were intensified with the application of PM in 2:1 ridge to furrow ratio.
Effects of ridge to furrow ratio and organic manures (C, control; PM, poultry manure; FYM, farm yard manure and PrM, pressmud) on the cumulative nitrogen ammonification (a) and nitrification (b) during 120 days field incubation. Each manure treatment is equivalent to 250 kg N ha−1. Vertical bars are means ± standard error.

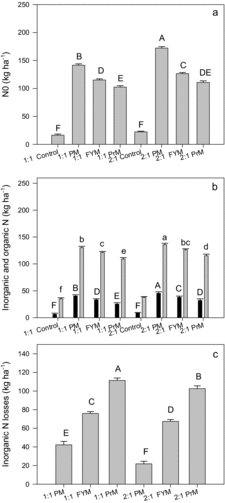
Mineralizable-N (N0) was significantly influenced (p < 0.05) by ridge to furrow ratio and organic manures interaction (Figure 3a). The highest N–N0 was in 2:1 PM while the lowest was found in 1:1 control and 2:1 control. After the maize harvest, soil inorganic and organic N were also significantly affected (p < 0.05) by ridge to furrow ratio and organic manures interaction (Figure 3b). PM was most beneficial for soil inorganic and organic N in 2:1 arrangement. The lowest N was found in 1:1 control and 2:1 control.
Effects of ridge to furrow ratio and organic manures (C, control; PM, poultry manure; FYM, farm yard manure and PrM, pressmud) on the mineralizable N–No (a), inorganic and organic N (b) and inorganic N losses (c). Each manure treatment is equivalent to 250 kg N ha−1. Means in a bar in a chart not sharing the same letter differ significantly (p < 0.05). Vertical bars are means ± standard error. LSDNo for ridge aspect × manures interactions: 10.67. LSDinorganic N for ridge aspect × manures interactions: 2.32. LSDorganic N for ridge aspect × manures interactions: 2.05. LSDN losses for ridge aspect × manures interactions: 8.07.

Applying different organic manures and varying ridge to furrow ratio led to different N losses from soil (Figure 3c). In general, increasing ridge to furrow ratio from 1:1 to 2:1 decreased N losses in all manure treatments. The N losses were lowest with application of PM in 2:1 ratio, and highest with application of PrM in 1:1 ratio.
Changes in soil physicochemical properties
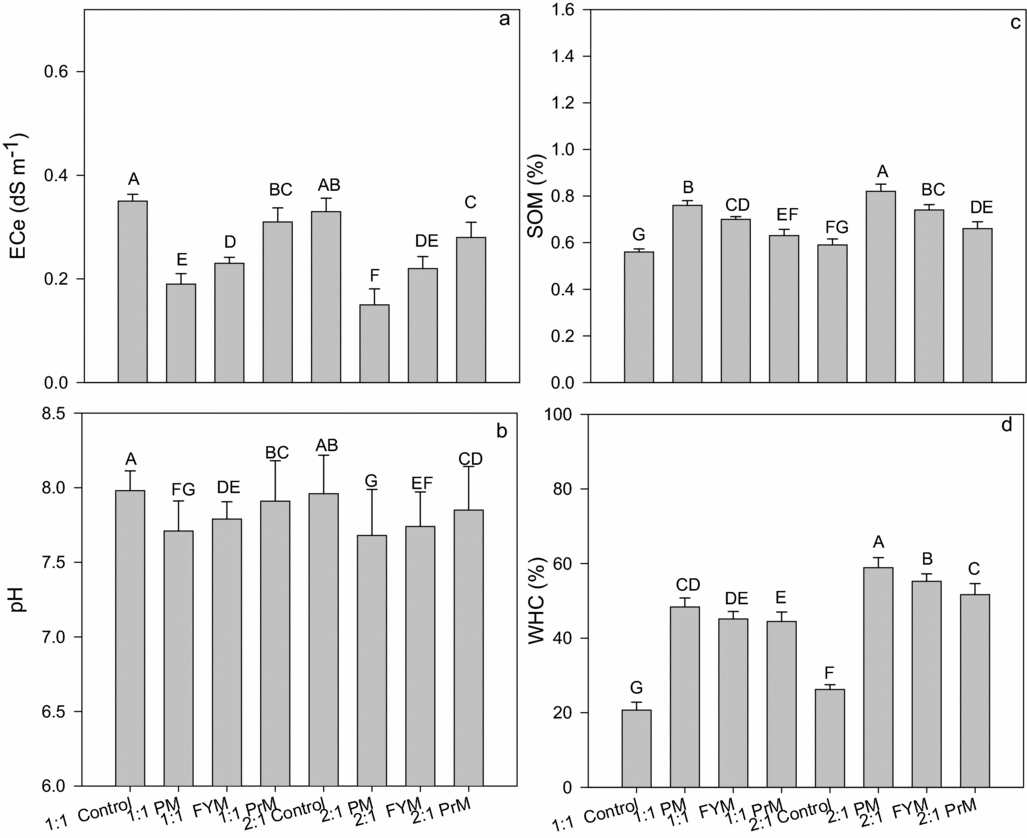
Ridge to furrow ratios × organic manure interaction was significant (p < 0.05) for soil ECe and pH (Figure 4a,b). The combination of PM with 2:1 ratio caused the lowest ECe and pH values and both variables were highest in 1:1 control and 2:1 control. Ridge to furrow ratios × organic manure interaction was also significant for SOM and WHC (Figure 4c,d). PM under 2:1 ratio raised SOM and WHC while the lowest SOM and WHC values were found in 1:1 control. SOM was similar in 1:1 and 2:1 control.
Effects of ridge to furrow ratio and organic manures (C, control; PM, poultry manure; FYM, farm yard manure and PrM, pressmud) on the soil ECe (a), pH (b), soil organic matter (SOM) (c) and water holding capacity (WHC) (d) after the crop harvesting. Means in a bar in a chart not sharing the same letter differ significantly (p < 0.05). Vertical bars are means ± standard error. LSDECe for ridge aspect × manures interactions: 0.03. LSDpH for ridge aspect × manures interactions: 0.04. LSDSOM for ridge aspect × manures interactions: 0.03. LSDWHC for ridge aspect × manures interactions: 0.05.

Changes in agronomic aspects
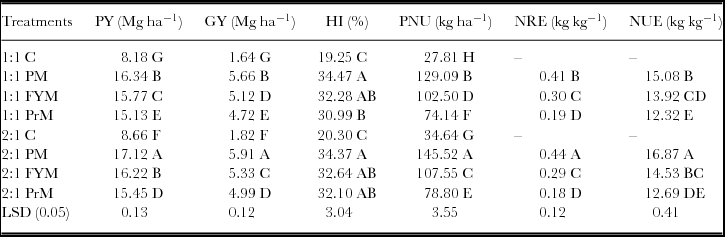
Plant yield and grain yield were significantly influenced (p < 0.05) by ridge to furrow ratio × organic manures interaction (Table 1). Total plant yield and grain yield were highest in 2:1 PM (17.12 and 5.91 Mg ha–1) and lowest in 1:1 control (8.18 and 1.64 Mg ha–1). HI was significantly affected (p < 0.05) by ridge to furrow ratios × organic manure interaction (Table 1). HI (34.5%) was highest in 2:1 PM, although it was statistically similar in 1:1 PM, 2:1 FYM, 1:1 FYM and the 2:1 PrM. The lowest HI (19.3%) was noticed in 2:1 control and 1:1 control.
Effects of ridge to furrow ratio and organic manures (C, control; PM, poultry manure; FYM, farm yard manure and PrM, pressmud) on plant (PY) and grain (GY) yields, harvest index (HI), plant N uptake (PNU), nitrogen recovery efficiency (NRE) and nitrogen use efficiency (NUE).

Means sharing similar letter(s) do not differ significantly (p < 0.05). LSD is the least significant difference.
Uptake of N was also significantly affected (p < 0.05) by ridge to furrow ratio and organic manures interaction (Table 1). While the highest N uptake (145.52 kg ha−1) was found in 2:1 PM, the lowest values occurred in 1:1 control (27.81kg ha−1). Both NRE and NUE were significantly influenced (p < 0.05) by ridge to furrow ratios and organic manures interaction (Table 1) and the highest NRE and NUE values were noticed in 2:1 PM (0.44 and 16.87 kg kg−1, respectively).
Changes in grain quality
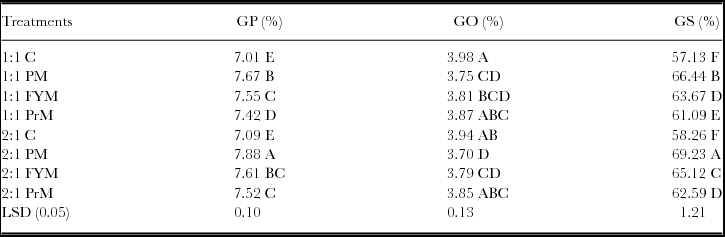
Ridge to furrow ratios × organic manures significantly influenced (p < 0.05) grain protein and starch (Table 2), with the highest concentrations (7.9% and 69.2%, respectively) occurring in 2:1 ratio. The lowest grain and protein concentrations (7.0% and 57.1%) were observed in 1:1 control and 2:1 control. Grain oil changed due to ridge to furrow ratios × organic manures (Table 2). The highest grain oil was reached in 1:1 control, 2:1 control, 1:1 PrM and 2:1 PrM, whereas the lowest values were found in 2:1 PM and 1:1 PM.
Effects of ridge to furrow ratio and organic manures (C, control; PM, poultry manure; FYM, farm yard manure and PrM, pressmud) on grain protein (GP), oil (GO) and starch (GS).

Means sharing similar letter(s) do not differ significantly (p < 0.05). LSD is the least significant difference.
Gross and net income and benefit cost ratio
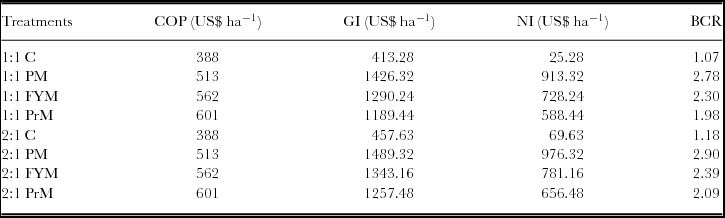
In general, production on different ridge to furrow ratios with various organic manures substantially influenced the gross and NI and BCR (Table 3). The combination PM and 2:1 had the highest GI (US$1489 ha−1), NI (US$ 976 ha−1) and BCR (2.90), while the control on 1:1 had the lowest GI (US$413 ha−1), NI (US$25 ha−1) and BCR (1.07).
Effects of ridge to furrow ratio and organic manures (C, control; PM, poultry manure; FYM, farm yard manure; and PrM, pressmud) on cost of production (COP), gross income (GI), net income (NI) and benefit cost ratio (BCR).

DISCUSSION
Nitrogen (N) application to agricultural fields through organic manure can have equally adverse impacts on the environment as chemical fertilizer due to increased N leaching and run-off in soils with poor nutrient holding capacity (Amin et al., Reference Amin, Simunek and Lægdsmand2014; Iqbal et al., Reference Iqbal, Guber and Khan2016). This often results in low yields because of N unavailability to crops (Iqbal et al., Reference Iqbal, Thierfelder, Khan, Javeed, Arif and Shehzad2017) and no serious efforts were made to address this issue. Thus, this research investigated the effects of combining ridge to furrow size ratios with manure applications to reduce N losses and increase maize yield. Previous studies compared ridge to furrow ratios to assess the downward movement of water in ridges. While Jiang et al. (Reference Jiang, Gao, Liang, Wang, Gao, Qu and Feng2012) studied the furrow sizes and mulched ridges to conserve water, Chen et al. (Reference Chen, Zhao, Wu, Wang, Zhang and Zhang2011) compared different ridge widths to find ways to limit water infiltration. However, no efforts were undertaken to control N losses under furrow irrigation after the application of organic manures. To the best of our knowledge, this is the first study aimed to control N losses using organic manures under varying ridge to furrow arrangements. An in-situ buried polyethylene bag technique (Cusick et al., Reference Cusick, Powell, Kelling, Hensler and Munoz2006) was implemented in this study to capture the tricky N transformations under field conditions, allowing us to observe N transformations quite precisely. Overall, the research supported the hypothesis that application of organic wastes in larger ridge to furrow ratio reduces N loss and increases maize yield.
As compared to 1:1 ratio, using organic manures in ridge to furrow ratio of 2:1 increased the cumulative N mineralization, ammonification and nitrification (Figure 2a,b). This indicates that ridge to furrow ratio is an important factor during N transformation. Initially (upto 30 days), higher N transformation following PrM application might be due to more unstable pool of N in this manure, causing asynchrony between N release and plant uptake (Table 1). On the other hand, higher transformation following PM application in 2:1 ratio after 30 to 120 days indicates greater potential of PM to release N throughout the maize growing period, as reported in previous studies (e.g. Alizadeh et al., Reference Alizadeh, Fallah and Raiesi2012; Canali et al., Reference Canali, Trinchera, Intrigliolo, Pompili, Nisini, Mocali and Torrisi2004).
This study confirmed the results from previous studies (e.g. Ahmad et al., Reference Ahmad, Farmanullah, Jamal and Shah2014; Guntiñasa et al., Reference Guntiñasa, Leirós, Trasar-Cepeda and Gil-Sotres2012), in which manure, specifically PM, application increased the mineralizable-N pool. While the mineralizable-N pool is affected by organic manures, PM is be most beneficial one (Figure 3a). In addition, highest mineralizable-N measured in ridge to furrows ratio of 2:1with PM application suggests greater benefits because this ridge size provides a wider area for N accumulation and is less liable to leaching during furrow irrigation.
Manure amendments release nutrients slowly and the environmental risk is decreased if nutrient supplying is synchronized with plant demand (Brandjes et al., Reference Brandjes, de Wit, van der Meer and Van Keulen1996). However, organic manures may be different in their nutrient sorption capacity. Herein, properties of organic manures as well as different ridge to furrow ratios affected the accumulation of both organic and inorganic N forms in soil, and subsequently mineral N loss (Figure 3b,c). The PM application in the 2:1 ratio increased N accumulation and decreased N losses because (i) it had the highest N content among all manures and added more N to soil, and (ii) the 2:1 ratio had less water flux at the centre thereby reducing N leaching. The PrM application caused the highest N losses in the 1:1 ratio because of initial higher mineralization rate (upto 30 days) combined with less N accumulation area. We can therefore summarize that organic manure application under furrow irrigation can contribute to N loss; however, such loss may be reduced if manure is applied in ridges that are wider.
Applying organic manures in soils can change pH, which further alters nutrients availability at soil-plant interface (Eghball et al., Reference Eghball, Ginting and Gilley2004). Furthermore, it can also reduce the ECe in soils (Haynes and Mokolobate, Reference Haynes and Mokolobate2001), where high salt concentration is a common problem (Korkanc and Korkanc, Reference Korkanç and Korkanç2016). In this study, manures decreased pH and ECe of the predominantly saline soil (Figure 4a,b). This reduction was greatest where PM was applied in 2:1 ridge to furrow ratio, which suggests that PM efficiently decomposes in this system resulting in the release of organic acids able to reduce soil pH and ECe (Haynes and Mokolobate, Reference Haynes and Mokolobate2001). Although the reductions in both pH and ECe were small (Figure 4a,b), they increased N availability for plant uptake.
Many studies have reported that applying manures increase SOM and subsequently water retention capacity of soil (e.g. Celik et al., Reference Celika, Ortas and Kilic2004; Evanylo et al., Reference Evanylo, Sherony, Spargo, Starner, Brosius and Haering2008). Overall, we recorded a small increase in both properties following manure application (Figure 4c,d). However, we observed the highest increase of SOM and WHC with PM application in 2:1 ridge to furrow configuration (Figure 4c,d), which suggests greater benefits in this system. There was an overall positive effect of organic manures application in both ridge to furrow ratios on plant and grain yield (Table 1), which highlights the potential of using manures under poor semi-arid conditions. The benefit to yield was highest when PM was applied in the 2:1 ridge to furrow ratio (Table 1). The abundant mineralization and uptake of N by plants were responsible for increasing yields, which had a strong relationship with the HI (Iqbal et al., Reference Iqbal, Thierfelder, Khan, Javeed, Arif and Shehzad2017). We observed the highest HI in 2:1 PM and the magnitude of HI values was comparable to the data recorded by Iqbal et al. (Reference Iqbal, Thierfelder, Khan, Javeed, Arif and Shehzad2017).
N uptake is crucial for crop performance and to reduce the environmental risks (Erisman et al., Reference Erisman, Sutton, Galloway, Klimont and Winiwarter2008). Application of PM in the 2:1 ridge to furrow ratio resulted in higher N uptake by plants (Table 1), which suggests synchrony between N mineralization and plant uptake, reduces N losses and increases maize yield. NUE allows a systematic assessment of effectiveness of N uptake, finally translating into grain yield (Cassman et al., Reference Cassman, Dobermann, Walters and Yang2003). However, drawing conclusions only from NUE is insufficient to understand the effectiveness of any practice until nitrogen recovery efficiency (NRE) is examined (Salvagiotti et al., Reference Salvagiotti, Castellarin, Miralles and Pedrol2009). In this study, NRE and NUE were different among organic manures and ridge to furrow ratios, suggesting that they could change under varying management practices. Both efficiencies were highest when PM was applied in the 2:1 ridge to furrow size (Table 1), which is in agreement with previous studies (Iqbal et al., Reference Iqbal, Thierfelder, Khan, Javeed, Arif and Shehzad2017; Zhang et al., Reference Zhang, Li, Wang, Hu, Christie, Zhang and Li2016).
Optimization of grain protein, starch and oil content is required to reach adequate nutrition level. In general, protein concentration was close to 8% (Table 2), suggesting optimum nutritional status (Hurburgh, Reference Hurburgh2003) and highlighting the potential of organic manures as fertilizers. We noticed the highest grain protein and starch concentrations when PM was applied in the 2:1 ridge to furrow configuration, with oil concentration being the lowest one (Table 2). This is explained by a positive correlation between plant N uptake and protein and starch contents (Hanan et al., Reference Hanan, Siam, Abd-El-L-Kader and El-Alia2008; Iqbal et al., Reference Iqbal, Thierfelder, Khan, Javeed, Arif and Shehzad2017), and a negative correlation with oil production (Iqbal et al., Reference Iqbal, Thierfelder, Khan, Javeed, Arif and Shehzad2017; James, Reference James2004). However, the reduction in oil concentration was small and did not influence the overall grain quality (Table 2), as noticed by Iqbal et al. (Reference Iqbal, Thierfelder, Khan, Javeed, Arif and Shehzad2017).
Organic manures are cheap sources of nutrients, which may save costs and nutrients as N, easily lost by leaching (Zhang et al., Reference Zhang, Li, Wang, Hu, Christie, Zhang and Li2016). In this research, applying PM in the 2:1 ridge to furrow ratio resulted in the highest income and BCR (Table 3), which were caused by increased maize yield. The income and BCR achieved in this study were comparable to a recent study (Iqbal et al., Reference Iqbal, Thierfelder, Khan, Javeed, Arif and Shehzad2017) and confirm that farmers could improve their income with application of PM in 2:1 ridge to furrow ratio under semi-arid conditions.
CONCLUSIONS
The use of organic manure under furrow irrigation for the production of maize reduces N losses in a semi-arid environment, with increasing ridge to furrow size from 1:1 to 2:1 being an effective strategy for improving soil fertility. Amendments with PM led to the highest maize yields, NI and BCR, which would benefit farmers and reduce environmental risks due to N leaching. As our results may be affected by soil type, this research should be expanded and results confirmed in other field crops and study conditions.
Acknowledgements
The authors are grateful to the Higher Education Commission of Pakistan for providing the funds under the Start Up Research Grant Program (21-571/SRGP). We are also grateful to the CGIAR Research Program on MAIZE, which provided time for Dr. Christian Thierfelder to contribute to this study.