INTRODUCTION
Nitrogen (N) and phosphorus (P) are essential nutrients in plant metabolism (Marschner Reference MARSCHNER1995), and their availabilities in soils frequently regulate plant growth and productivity in terrestrial ecosystems (Elser et al. Reference ELSER, BRACKEN, CLELAND, GRUNER, HARPOLE, HILLEBRAND, NAGI, SEABLOOM, SHURIN and SMITH2007, Harpole et al. Reference HARPOLE, NGAI, CLELAND, SEABLOOM, BORER, BRACKEN, ELSER, GRUNER, HILLEBRAND, SHURIN and SMITH2011). N and P concentrations in green leaves are important leaf traits of plant species, because they relate functionally to photosynthetic assimilation rates and growth rates (Aerts & Chapin Reference AERTS and CHAPIN2000, Ågren Reference ÅGREN2008, Wright et al. Reference WRIGHT, REICH, WESTOBY, ACKERLY, BARUCH, BONGERS, CAVENDER-BARES, CHAPIN, CORNELISSEN, DIEMER, FLEXAS, GARNIER, GROOM, GULIAS, HIKOSAKA, LAMONT, LEE, LEE, LUSK, MIDGLEY, NAVAS, NIINEMETS, OLEKSYN, OSADA, POORTER, POOT, PRIOR, PYANKOV, ROUMET, THOMAS, TJOELKER, VENEKLAAS and VILLAR2004). In addition, foliar N and P are the important components controlling carbon and nutrient cycles and food webs in terrestrial ecosystems (Chapin et al. Reference CHAPIN, MATSON and VITOUSEK2011). Therefore, knowledge of foliar N and P attributes in relation to nutrient availabilities provides important insight into understanding plant nutritional strategies and terrestrial ecosystem functions. In tropical regions, tree growth and productivity are frequently limited by low P availability in soils (Cleveland et al. Reference CLEVELAND, TOWNSEND, TAYLOR, ALVAREZ-CLARE, BUSTAMANTE, CHUYONG, DOBROWSKI, GRIERSON, HARMS, HOULTON, MARKLEIN, PARTON, PORDER, REED, SIERRA, SILVER, TANNER and WIEDER2011, Vitousek Reference VITOUSEK1984). Therefore, foliar P attributes and P-use strategies of tropical tree species have been investigated in relation to soil P availability (Cordell et al. Reference CORDELL, GOLDSTEIN, MEINZER and VITOUSEK2001, Hidaka & Kitayama Reference HIDAKA and KITAYAMA2009, Reference HIDAKA and KITAYAMA2011). On the other hand, how tropical tree species control foliar N dynamics in relation to efficient foliar P-use under P limitation remains unclear, although it is suggested that soil P availability may influence N cycle in tropical rain forests (Hall et al. Reference HALL, ASNER and KITAYAMA2004, Kitayama et al. Reference KITAYAMA, AIBA, MAJALAP and OHSAWA1998, Quesada et al. Reference QUESADA, LLOYD, SCHWARZ, PATINO, BAKER, CZIMCZIK, FYLLAS, MARTINELLI, NARDOTO, SCHMERLER, SANTOS, HODNETT, HERRERA, LUIZÃO, ARNETH, LLOYD, DEZZEO, HILKE, KUHLMANN, RAESSLER, BRAND, GEILMANN, MORAES FILHO, CARVALHO, ARAUJO FILHO, CHAVES, JUNIOR, PIMENTEL and PAIVA2010).
The stoichiometric balance between N and P in green leaves has been a particular focus in understanding life-history strategies of plant species (e.g. photosynthesis and growth rates) (Ågren Reference ÅGREN2008, Niklas et al. Reference NIKLAS, OWENS, REICH and COBB2005, Reich et al. Reference REICH, OLEKSYN and WRIGHT2009). Earlier studies showed that N and P concentrations in green leaves are positively correlated with each other within and among various plant species (Kerkhoff et al. Reference KERKHOFF, FAGAN, ELSER and ENQUIST2006, Niklas et al. Reference NIKLAS, OWENS, REICH and COBB2005, Reich et al. Reference REICH, OLEKSYN, WRIGHT, NIKLAS, HEDIN and ELSER2010, Wright et al. Reference WRIGHT, REICH, WESTOBY, ACKERLY, BARUCH, BONGERS, CAVENDER-BARES, CHAPIN, CORNELISSEN, DIEMER, FLEXAS, GARNIER, GROOM, GULIAS, HIKOSAKA, LAMONT, LEE, LEE, LUSK, MIDGLEY, NAVAS, NIINEMETS, OLEKSYN, OSADA, POORTER, POOT, PRIOR, PYANKOV, ROUMET, THOMAS, TJOELKER, VENEKLAAS and VILLAR2004). It was suggested that a general 2/3- or 3/4-power law exists in the scaling relationship of N to P concentrations in green leaves among plant species across biomes (Niklas et al. Reference NIKLAS, OWENS, REICH and COBB2005, Reich et al. Reference REICH, OLEKSYN, WRIGHT, NIKLAS, HEDIN and ELSER2010). This finding suggests that foliar N:P ratio increases with decreasing foliar P concentration among plant species, although foliar N concentration decreases with decreasing foliar P concentration. Because foliar P concentration generally decreases with decreasing soil P availability (Cleveland et al. Reference CLEVELAND, TOWNSEND, TAYLOR, ALVAREZ-CLARE, BUSTAMANTE, CHUYONG, DOBROWSKI, GRIERSON, HARMS, HOULTON, MARKLEIN, PARTON, PORDER, REED, SIERRA, SILVER, TANNER and WIEDER2011, Hidaka & Kitayama Reference HIDAKA and KITAYAMA2009), plant species will control the stoichiometric balance between N and P in green leaves and consequently disproportionately increase foliar N:P ratio in response to a lower P availability in soils. On the other hand, how the positive correlation between foliar N and P varies in response to a lower P availability in soils is poorly understood.
Nutrient resorption prior to leaf abscission is one of the important foliar strategies to conserve growth-limiting nutrients, because the retranslocated nutrients are used for new leaves and other organs for plant productivity and growth (Aerts Reference AERTS1996, Killingbeck Reference KILLINGBECK1996). Species-level N and P resorption efficiencies (i.e. the proportion of reduction in N and P concentration from green to senesced leaves) (NRE and PRE, respectively) have been frequently investigated in various vegetations (Kobe et al. Reference KOBE, LEPCZYK and IYER2005, Vergutz et al. Reference VERGUTZ, MANZONI, PORPORATO, NOVAI and JACKSON2012, Yuan & Chen Reference YUAN and CHEN2009). Reed et al. (Reference REED, TOWNSEND, DAVIDSON and CLEVELAND2012) suggested that the ratio of NRE per PRE (i.e. N:P resorption ratio) reflects soil P availability in tropical rain forests, and that tropical tree species growing on P-poor soils translocate more P than N prior to leaf abscission. On the other hand, the importance of N resorption of tropical tree species is not well characterized with soil P availability. Although several experiments showed that P fertilization decreases or does not change NRE of tropical tree species (Cordell et al. Reference CORDELL, GOLDSTEIN, MEINZER and VITOUSEK2001, Mayor et al. Reference MAYOR, WRIGHT and TURNER2014, Treseder & Vitousek Reference TRESEDER and VITOUSEK2001), how tropical tree species control N resorption on P-poor soils remains unclear.
Our aim in this study is to test the following hypotheses for understanding how foliar N and P attributes co-vary with each other along a gradient of soil P availability. First, the magnitude of reduction of foliar N concentration with decreasing P availability is smaller than that of foliar P concentration, because soil P availability more strongly and directly influences foliar P than foliar N. Secondly, tree species translocate more P than N prior to leaf abscission and N:P resorption ratio decreases with decreasing P availability. We investigated N and P concentrations and N:P ratios in green and senesced leaves, NRE, PRE and N:P resorption ratio of 30 tropical tree species across three forests with differing soil P availability on Mount Kinabalu, Borneo.
METHODS
Study sites
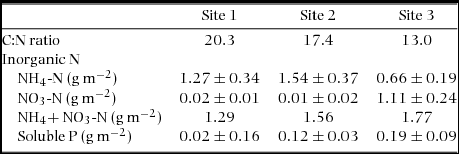
This study was conducted in three tropical montane rain forests on the southern slopes of Mount Kinabalu (6°05′ N, 116°33′ E, 4095 m asl), Sabah, Malaysian Borneo. These forests are the same as those in Hidaka & Kitayama (Reference HIDAKA and KITAYAMA2011) and are called lower slope sites in Takyu et al. (Reference TAKYU, AIBA and KITAYAMA2002). The three study sites were nearly the same in altitude (1560–1860 m asl) and had a comparable climate (mean annual air temperature was 18°C and mean annual precipitation was 2700 mm) (Kitayama Reference KITAYAMA1992). On the other hand, the three sites were different in soil P availability due to the differences in geological substrates (Quaternary and Tertiary sedimentary rocks and ultrabasic rock) (Takyu et al. Reference TAKYU, AIBA and KITAYAMA2002). Hereafter, we name the three sites as Site 1 (ultrabasic), Site 2 (Tertiary sediment) and Site 3 (Quaternary sediment) in the increasing order of soil P availability (0.02, 0.12 and 0.19 g m−2 soluble P, respectively) (Table 1). Inorganic-N pool (i.e. NO3 + NH4) in soils and rates of net soil N mineralization decreased, and soil C:N ratio increased with decreasing soil P availability across the three forests (Table 1) (Hall et al. Reference HALL, ASNER and KITAYAMA2004, Kitayama et al. Reference KITAYAMA, AIBA, TAKYU, MAJALAP and WAGAI2004, Takyu et al. Reference TAKYU, AIBA and KITAYAMA2002). It was suggested that soil N availability was down-regulated by soil P availability via activity of microbes (i.e. ammonifier and nitrifying bacteria) (Hall et al. Reference HALL, ASNER and KITAYAMA2004, Kitayama et al. Reference KITAYAMA, AIBA, MAJALAP and OHSAWA1998, Reference KITAYAMA, AIBA, TAKYU, MAJALAP and WAGAI2004). Although soil N availability decreased with decreasing soil P availability across the three sites, the magnitude of soil P variation was greater than that of soil N variation, and soil P availability rather than soil N availability more strongly influenced plant nutritional strategies and ecosystem processes (Kitayama & Aiba Reference KITAYAMA and AIBA2002, Kitayama et al. Reference KITAYAMA, AIBA, TAKYU, MAJALAP and WAGAI2004, Takyu et al. Reference TAKYU, AIBA and KITAYAMA2003).
Soil properties (top 15 cm depth) of nitrogen (N) and phosphorus (P) in three tropical montane rain forests on Mount Kinabalu. Data are from Takyu et al. (Reference TAKYU, AIBA and KITAYAMA2002, Reference TAKYU, AIBA and KITAYAMA2003).
Sampling and chemical analysis
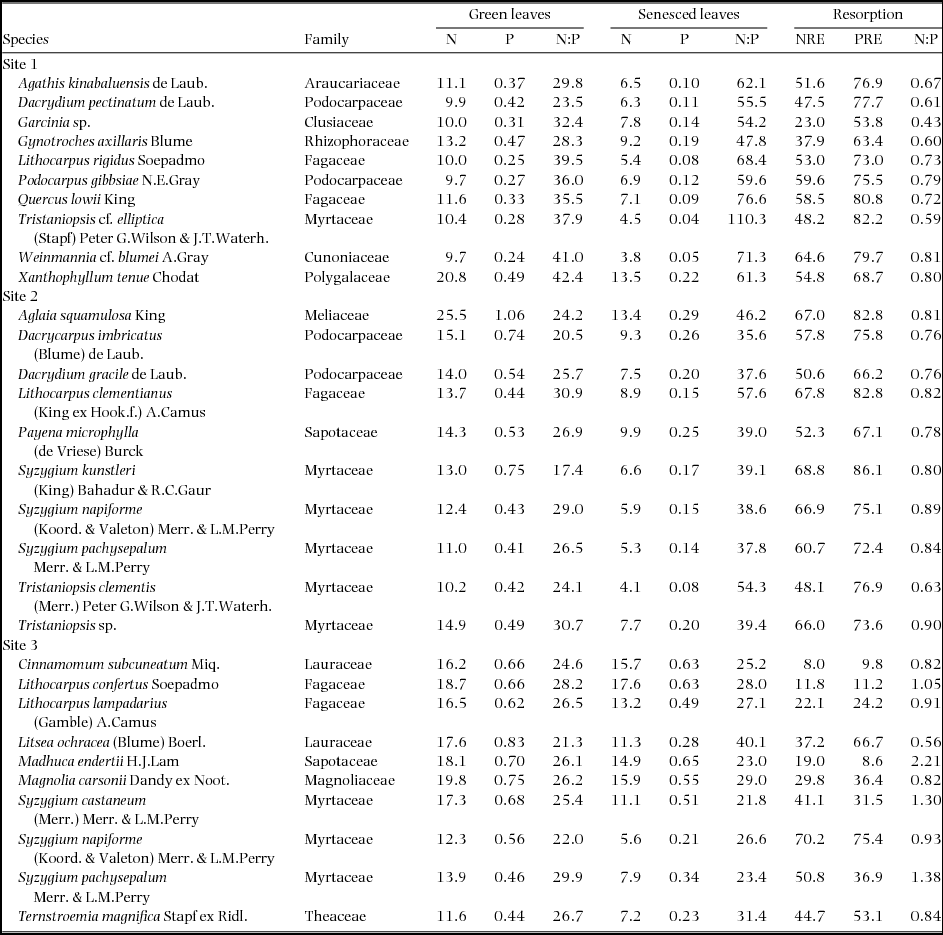
In each forest, we selected 10 dominant tree species (Table 2), of which seven species were previously studied for understanding foliar P-use strategies (Hidaka & Kitayama Reference HIDAKA and KITAYAMA2011) and three species were additionally selected in this study. We collected sun leaves of three to five trees per species from crown tops using a catapult, and collected fresh fallen leaf litter at 2-d intervals using litter traps on the ground within each permanent plot (2000 m2 in Site 1, 10000 m2 in Site 2 and Site 3). After drying these samples at 60°–70°C for 72 h to a constant weight, each sample including veins after removing petiole was ground for the measurement of nutrients. N concentration was measured using a CN analyser (JM 1000CN, J-Science Lab Co., Kyoto, Japan). P and calcium (Ca) concentrations were measured using an inductively coupled plasma atomic emission spectrometer (ICPS-7510; Shimadzu Co., Kyoto, Japan) after digesting samples with H2SO4 and H2O2. After calculating mean concentrations of N, P and Ca in green and senesced leaves in each species, mean NRE and PRE per species was respectively calculated as the following equation for correcting a loss of leaf mass by using Ca concentrations: NRE (%) or PRE (%) = 100 – (N or P concentration in green leaves/N or P concentration in senesced leaves) × (Ca concentration in senesced leaves/Ca concentration in green leaves) × 100.
Nitrogen (N) and phosphorus (P) concentrations (mg g−1) and N:P ratios (mass basis) in green and senesced leaves, N and P resorption efficiencies corrected with calcium concentrations (NRE and PRE, respectively) (%), and N:P resorption ratio (i.e. ratio of NRE per PRE) of 30 tree species in three tropical montane rain forests on Mount Kinabalu. A part of the data is from Hidaka & Kitayama (Reference HIDAKA and KITAYAMA2011).

Statistical analysis
We tested the differences in mean values of foliar N and P attributes among the three forests by ANOVA with a post hoc Tukey HSD test. The relationships of nutrient concentrations between green and senesced leaves, and between N and P concentrations in green and senesced leaves were analysed after base-10 log-transformation, because earlier studies have shown that these are best expressed as scaling relationships (Kobe et al. Reference KOBE, LEPCZYK and IYER2005, Reich et al. Reference REICH, OLEKSYN, WRIGHT, NIKLAS, HEDIN and ELSER2010). We also tested the difference in their relationships in standardized major axis (SMA) among the three forests by using SMATR (Warton et al. Reference WARTON, DUURSMA, FALSTER and TASKINEN2012). According to our hypothesis, slopes of SMA between foliar N and P concentrations for both green and senesced leaves will become flatter with decreasing P availability, although foliar N concentration decreases with decreasing P availability. Statistical analyses were performed using R 2.14.1 (http://www.R-project.org).
RESULTS
Foliar N concentrations and N resorption efficiency
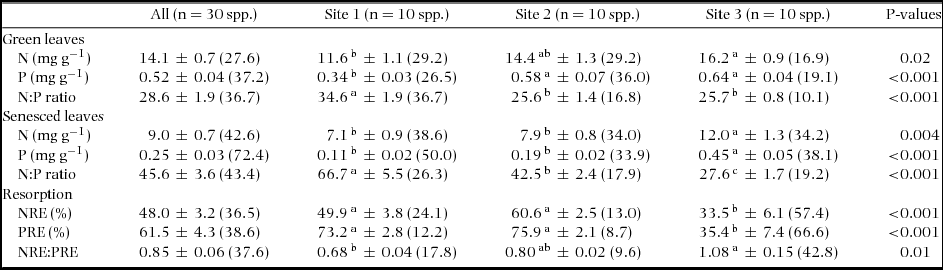
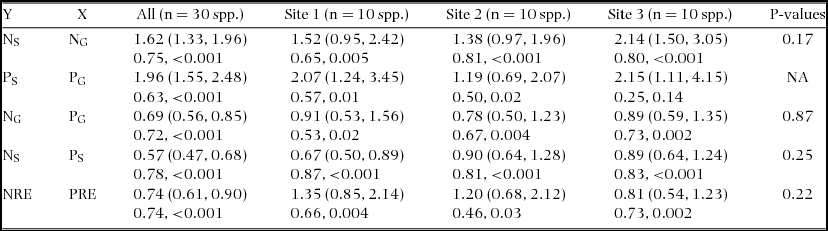
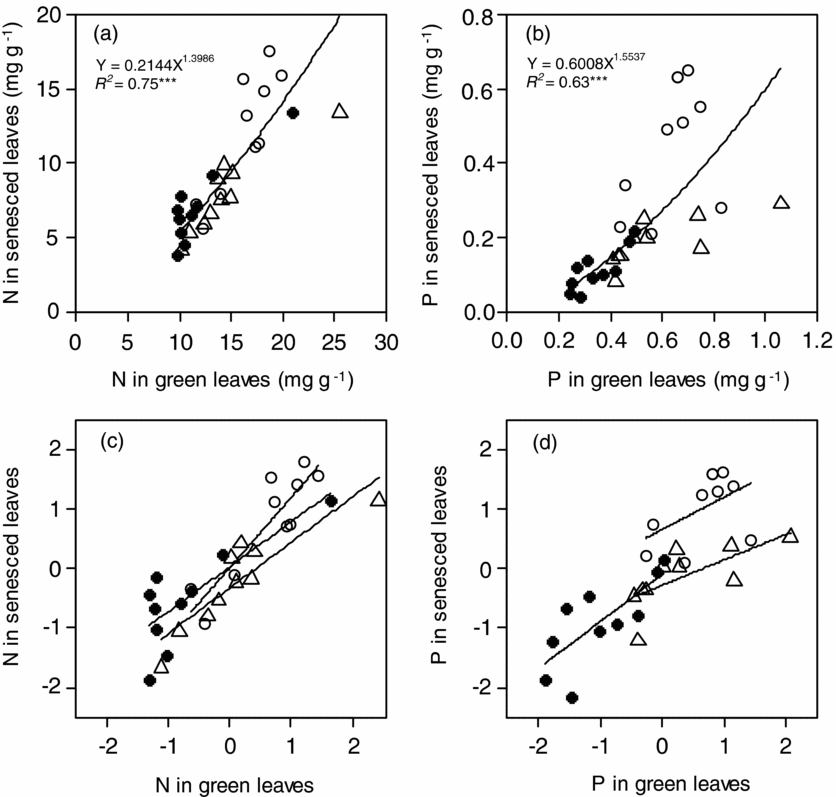
N concentration in green leaves (NG) varied 2.6-fold from 9.7 mg g−1 in Podocarpus gibbsiae and Weinmannia cf. blumei at Site 1 to 25.5 mg g−1 in Aglaia squamulosa at Site 2, and N concentration in senesced leaves (NS) varied 4.6-fold from 3.8 mg g−1 in Weinmannia cf. blumei at Site 1 to 17.6 mg g−1 in Lithocarpus confertus at Site 3 (Table 2). Both mean NG and NS significantly increased from Site 1 to Site 3 with increasing soil P availability (Table 3). Across the three sites, NG and NS were positively correlated with each other, and the value of the scaling exponent in the relationship was significantly higher than 1 (1.40 ± 0.15) (Figure 1a), and the SMA slope of NS to NG was significantly higher than 1 (Table 4). NG and NS were also significantly and positively correlated with each other within each site, and the SMA slopes were higher than 1 at Site 3, but not different from 1 at Site 1 and Site 2, and were not different among the three sites (Figure 1c, Table 4). N resorption efficiency varied 8.6-fold from 8.0% in Cinnamomum subcuneatum at Site 3 to 68.8% in Syzygium kunstleri at Site 2 (Table 2), and the mean was significantly higher at Site 1 and Site 2 than at Site 3 (Table 3).
Mean values ± SE (CV) of nitrogen (N) and phosphorus (P) concentrations (mg g−1) and N:P ratios (mass basis) in green and senesced leaves, N and P resorption efficiencies corrected with calcium concentrations (NRE and PRE, respectively) (%), and N:P resorption ratio (NRE:PRE) of tree species on three tropical montane rain forests with differing soil P availability on Mount Kinabalu, Borneo. P-values are shown for testing differences in the mean values among the three sites. Pairwise significant differences at P < 0.05 among sites are shown in different letters.
Standardized major axis (SMA) relationships of N and P concentrations in green and senesced leaves (NG, PG, NS and PS, respectively) and of N and P resorption efficiencies (NRE and PRE, respectively) of tree species on three tropical montane rain forests with differing soil P availability on Mount Kinabalu, Borneo. Slopes (lower and upper 95% confidence intervals) for SMA regressions in the upper line and R2 and P-values in the lower line. P-values are shown for testing differences in slopes among the three sites.
The relationships of N (a) and P (b) concentrations in green and senesced leaves, and their relationships in standardized major axis (SMA) after base-10 log-transformation (c, d) of 30 tropical tree species on Mount Kinabalu. Symbols: Site 1 (solid circles), Site 2 (triangles) and Site 3 (open circles). Detailed SMA slopes are shown in Table 3.
Foliar P concentrations and P resorption efficiency
P concentration in green leaves (PG) varied 4.4-fold from 0.24 mg g−1 in Weinmannia cf. blumei at Site 1 to 1.06 mg g−1 in Aglaia squamulosa at Site 2, and P concentration in senesced leaves (PS) varied 16-fold from 0.04 mg g−1 in Tristaniopsis cf. elliptica at Site 1 to 0.65 mg g−1 in Madhuca endertii at Site 3 (Table 2). Both mean PG and PS significantly increased from Site 1 to Site 3 with increasing soil P availability (Table 3). Across the three sites, PG and PS were positively correlated with each other, and the value of the scaling exponent in the relationship was significantly higher than 1 (1.55 ± 0.22) (Figure 1b), and the SMA slope of PS to PG was significantly higher than 1 (Table 4). PG and PS were also positively correlated with each other at Site 1 and Site 2 but not at Site 3, and the SMA slopes were higher than 1 at Site 1, but not different from 1 at Site 2 (Figure 1d, Table 4). P resorption efficiency varied 10-fold from 8.6% in Madhuca endertii at Site 3 to 86.1% in Syzygium kunstleri at Site 2 (Table 2), and the mean was significantly higher at Site 1 and Site 2 than at Site 3 (Table 3).
Relationships between foliar N and P in the concentrations and resorption efficiencies
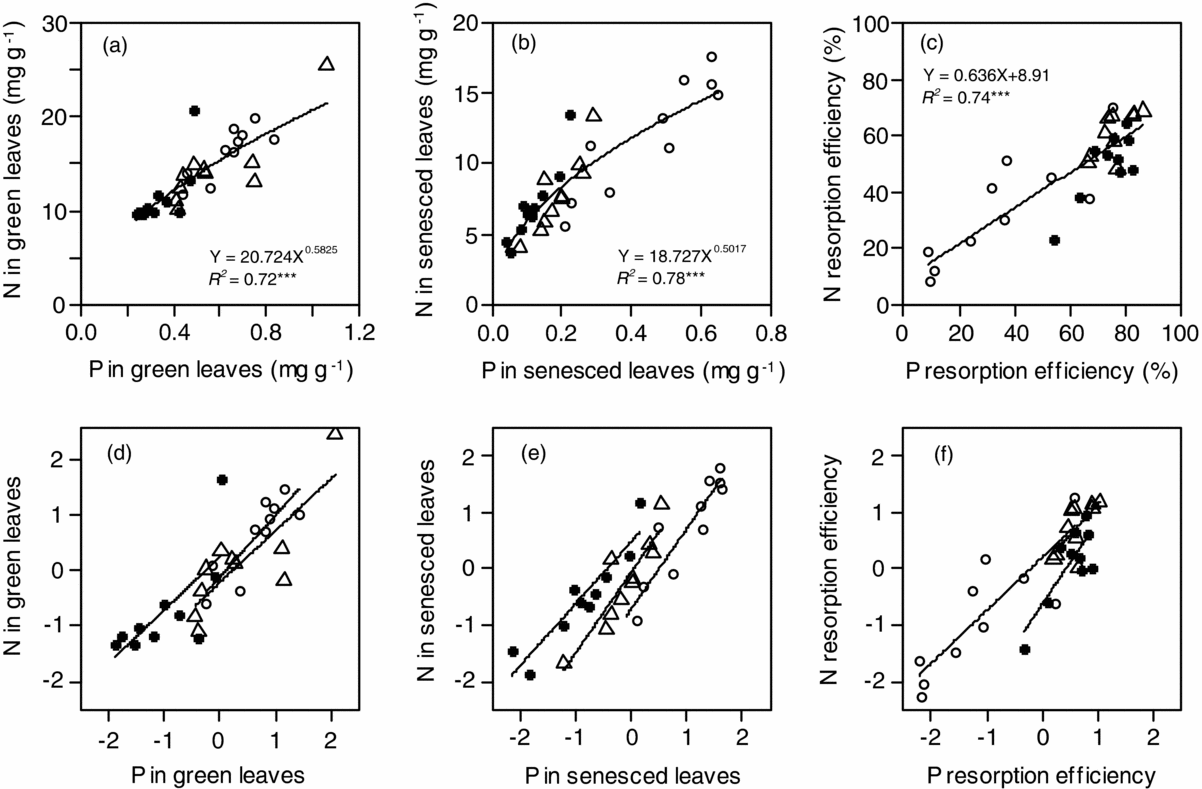
N and P concentrations were positively correlated with each other in both green and senesced leaves across the three sites, and the values of the scaling exponent in the relationships were both significantly lower than 1 (0.58 ± 0.07 in green leaves, 0.50 ± 0.05 in senesced leaves) (Figure 2a, b), and the SMA slopes of NG to PG and of NS to PS across three forests were significantly lower than 1 (Table 4). N and P concentrations were also positively correlated with each other in both green and senesced leaves within each site (all P < 0.05) (Figure 2d, e, Table 4), and the SMA slopes of NG to PG and of NS to PS within each site were not different among sites (Table 4). N:P ratio in green leaves varied 2.4-fold from 17.4 in Syzygium kunstleri at Site 2 to 42.4 in Xanthophyllum tenue at Site 1 (Table 2), and the mean was significantly higher at Site 1 than at Site 2 and Site 3 (Table 3). N:P ratio in senesced leaves varied 5.1-fold from 21.8 in Syzygium castaneum at Site 3 to 110 in Tristaniopsis cf. elliptica at Site 1 (Table 2), and the mean value increased significantly with decreasing soil P availability (Table 3).
The relationships between N and P concentrations in green (a) and senesced (b) leaves, and between N- and P-resorption efficiencies (c), and their relationships in standardized major axis (SMA) after base-10 log-transformation (d, e, f) of 30 tropical tree species on Mount Kinabalu. Symbols are the same as in Figure 1. Detailed SMA slopes are shown in Table 3.
NRE and PRE were positively correlated with each other across the three sites (P < 0.001) (Figure 2c) and within each site (all P < 0.05) (Figure 2f). N:P resorption ratio was significantly higher at Site 3 than at Site 1, and was not different between Site 1 and Site 2 and between Site 2 and Site 3 (Table 3).
DISCUSSION
In this study, we found strong and positive correlations between foliar N and P in the concentrations and resorption efficiencies within each forest and across the three forests with differing soil P availability. Such positive correlations across the forests may be partly influenced by the difference of soil N availability among the forests; it was suggested that soil N availability was down-regulated by soil P availability in our study sites (Hall et al. Reference HALL, ASNER and KITAYAMA2004, Kitayama et al. Reference KITAYAMA, AIBA, MAJALAP and OHSAWA1998, Reference KITAYAMA, AIBA, TAKYU, MAJALAP and WAGAI2004). On the other hand, the positive correlations within each forest cannot be explained by co-variation of soil N and P availability alone, because the small-scale spatial heterogeneity of soil N does not always correspond to soil P. Rather, observed patterns within each forest can be explained by plant nutritional strategies; foliar N-use strategy is influenced by foliar P-use strategy in each tree species in response to soil P availability.
Against our hypothesis, there was no difference in SMA slopes between foliar N and P concentration for both green and senesced leaves among the three forests. This result suggests that foliar N strongly decreases with decreasing foliar P within each forest and across the three forests, although the scaling relationship of foliar N to P (Figure 2a, b) suggests that soil P availability more strongly and directly influences the variation of foliar P than that of foliar N. We suggest that down-regulation of N concentrations in green leaves on P-poor soils is one of several possible mechanisms explaining why N concentrations decrease with decreasing P concentrations in both green and senesced leaves. When photosynthetic rates are limited by low P concentrations in green leaves, tree species will down-regulate the investment of N to the proteins of photosynthetic machinery (i.e. ribulose-1,5-bisphosphate carboxylase oxygenase). In addition, in order to prolong leaf lifespan as a strategy of conserving P on P-poor soils, tree species on P-poor soils tend to have tougher leaves and/or decrease N concentration of green leaves to reduce herbivory risks (Coley et al. Reference COLEY, BRYANT and CHAPIN1985, Endara & Coley Reference ENDARA and COLEY2011). Such down-regulation of foliar N may give rise to the observed positive correlation between foliar N and P concentrations along a gradient of soil P availability. Furthermore, the down-regulation of foliar N coupled with low foliar P concentrations will decrease decomposition rates and consequently decrease soil N availability on P-poor soils, eventually causing a positive correlation between foliar N and P.
Stoichiometry of N and P in plant cells provides another explanation. Theoretical studies have applied a biochemical relationship in plant cells between N in proteins and P in ribosomes used for protein synthesis (Ågren Reference ÅGREN2008, Niklas et al. Reference NIKLAS, OWENS, REICH and COBB2005), and suggest that the scaling exponent of N to P in green leaves becomes lower than 2/3 or 3/4 when plants have relatively slow growth rates under P limitation. In agreement with their suggestion, our species have a lower value (0.582) than 2/3 or 3/4 in the scaling exponent of N to P in green leaves (Figure 2a) under P limitation, which is suggested by the extremely high foliar N:P ratios of our species (Table 1) compared with those of other tropical regions (mean value 26.1 on relatively P-poor Oxisols and Ultisols, Townsend et al. Reference TOWNSEND, CLEVELAND, ASNER and BUSTAMANTE2007). An experimental observation suggests that relative growth rates partly explain a within-site variation of foliar N:P ratios among tropical tree species (Cernusak et al. Reference CERNUSAK, WINTER and TURNER2010). On the other hand, some studies argue that such a stoichiometric view based on plant growth rates does not always explain the balance between foliar N and P, because various forms of P-containing biochemical compounds in addition to ribosomes are involved in determining the relationship between foliar N and P (Hidaka & Kitayama Reference HIDAKA and KITAYAMA2011, Matzek & Vitousek Reference MATZEK and VITOUSEK2009). In addition, such a stoichiometric view based on plant growth rates does not consider that plants store excess P in vacuoles, but not N (Ostertag Reference OSTERTAG2010, Veneklaas et al. Reference VENEKLAAS, LAMBERS, BRAGG, FINNEGAN, LOVELOCK, PLAXTON, PRICE, SCHEIBLE, SHANE, WHITE and RAVEN2012). Further physiological and ecological studies are necessary to explain why N concentration tightly and positively relates to P concentration in green leaves and how high foliar N:P ratios are regulated on P-poor soils in tropical rain forests.
Reed et al. (Reference REED, TOWNSEND, DAVIDSON and CLEVELAND2012) suggested that the ratio of NRE per PRE (i.e. N:P resorption ratio) reflects soil P availability in tropical rain forests. Our result that N:P resorption ratio increased with decreasing soil P availability agrees with their suggestion. Tree species translocate more P than N prior to leaf abscission with decreasing soil P availability. On the other hand, the reason why NRE and PRE are positively correlated with each other across tree species within each forest (Table 4, Figure 2f) remains unclear. Such a positive correlation between NRE and PRE was found also in other tropical forests (Cai & Bongers Reference CAI and BONGERS2007, Lal et al. Reference LAL, ANNAPURNA, RAGHUBANSHI and SINGH2001) and in wetlands (Güsewell Reference GÜSEWELL2005). In addition, Tully et al. (Reference TULLY, WOOD, SCHWANTES and LAWRENCE2013) found a positive correlation between NRE and PRE in a symbiotic N-fixing tree species irrespective of soil P availability in tropical rain forests in Costa Rica. Earlier studies suggested that interspecific variation in NRE and PRE within a tropical rain forest reflect small-scale edaphic differences (Reed et al. Reference REED, TOWNSEND, DAVIDSON and CLEVELAND2012) or a wide range of adaptive nutrient-use strategies and genetically constrained flexibility in nutrient resorption among tree species (Hättenschwiler et al. Reference HÄTTENSCHWILER, AESCHLIMANN, COÛTEAUX, ROY and BONAL2008, Mayor et al. Reference MAYOR, WRIGHT and TURNER2014). As stated earlier, the co-variation of soil N and P availabilities within a forest is unlikely. Tree species at Site 1 (lower P availability) translocated P from their leaves by hydrolysing phospholipids and nucleic acids (Hidaka & Kitayama Reference HIDAKA and KITAYAMA2011), although PRE was not different between Site 1 and Site 2 (Table 3). Because nutrient resorption costs carbon and N in enzymes such as protease and phosphatase to hydrolyse high-molecular-weight compounds to simpler compounds (Wright & Westoby Reference WRIGHT and WESTOBY2003), nutritional strategies and genetically constrained flexibility (Mayor et al. Reference MAYOR, WRIGHT and TURNER2014, Treseder & Vitousek Reference TRESEDER and VITOUSEK2001) will be different among tree species in response to soil P availability. A high NRE on P-poor soils implies that tree species hydrolyse N-containing compounds with a cost of N while hydrolysing P-containing compounds. The reason why tree species on P-poor soils need to hydrolyse N-containing compounds, which is an additional cost of N, remains unclear.
We have demonstrated that plant nutritional strategies balance N and P and form a basis of ecosystem N and P stoichiometry. The positive correlations between foliar N and P in concentrations and resorption efficiency along a gradient of soil P availability will influence consequent soil processes and may feed back to plant nutrient uses. Further analyses are needed to elucidate the physiological background of the correlation.
ACKNOWLEDGEMENTS
This research was supported by a grant-in-aid from the Japanese MESSC (18255003 & 22255002) to K.K. and by a grant-in-aid from JSPS for Young Scientists (08J03021) and the Sasakawa Scientific Research Grant from The Japan Science Society (23–510) to A.H.