In order to determine the risk–benefit in clinical research, we often estimate the risk or odds for reaching an outcome associated with the values of the risk factor. When doing such assessments, often the explanatory variable is divided into categories and the association between each of those categories and the outcome is analysed and reported with estimates such as odds ratio or risk ratios. Several such categories of the risk factor are widely used for acute kidney injury; these include for example the AKIN, RIFLE, or KDIGO (Kidney Diseases Improving Global Outcomes) criteria for staging acute kidney injury. Reference Sutherland, Byrnes and Kothari1 These methods group patients into different stages of acute kidney injury, according to the rise in either their estimated glomerular filtration rate or creatinine levels. Each stage of renal impairment is then associated with a specific risk for death in the analysis. Dichotomising or dividing a continuous variable into several categories such as this are widely used in medical research because such a process can simplify the statistical analysis and can also lead to easier interpretation and presentation of results. Reference Altman and Royston2,Reference Royston, Altman and Sauerbrei3
However, such categorisation is not without its problems. Substantial information loss often occurs in the process of categorisation as the continuous biological relationship is sliced and diced. Reference Naggara, Raymond, Guilbert, Roy, Weill and Altman4 When categorising a variable researchers are also making the incorrect assumption that the effect of the variable is consistent within each given level of the categorised variable. Categorisation also causes considerable variability to be subsumed within each category of the variable; this results in the reduction of statistical power to detect important relationships and also produces unreliable estimates. Reference Selvin5 These undesirable effects are magnified in research studies that are already small-to-moderate sized and in non-linear exposure-outcome relationships. Reference Royston, Altman and Sauerbrei3,Reference Greenland6–Reference MacCallum, Zhang, Preacher and Rucker9 Ultimately, the end result of these effects is to produce estimates that are often biased and inefficient.
In this communication, we report the variation in study estimates obtained when using a continuous measure of renal function (peak-percentage creatinine change) and also when using a categorical version of the same variable (categorised according to Kidney Diseases Improving Global Outcomes [KDIGO] criteria) to report its association with in-hospital death. As an example, we present data from neonates who underwent the stage 1 single ventricle reconstruction operation. Surgery for CHD in neonates is associated with acute kidney injury and this has previously been reported. Reference Shaw, Swaminathan and Stafford-Smith10–Reference Morgan, Zappitelli and Robertson13
Materials and methods
In this retrospective project (study duration: 1 January, 2005 until 31 December, 2019), we analysed creatinine values (as a marker of acute kidney injury) in neonates who underwent either a Norwood or Damus-Kaye-Stansel procedure to study its association with death in hospital. Death in hospital was defined as death post-operatively during the initial hospital admission following surgery. Data for this study were obtained from the Royal Children’s Hospital Melbourne cardiac ICU database and hospital records. The protocol was approved by the hospital ethics committee (Ethics reference number: QA/61434/RCHM-2020).
Information on renal injury was obtained from serum creatinine levels measured pre-operatively (baseline), upon arrival to ICU after surgery and early in the morning of each post-operative day up to day 5. The highest creatinine level of each patient in those 5 days was defined as their peak creatinine value. Peak percent creatinine change was calculated as the difference between the baseline level and the peak post-operative level and expressed as a percentage of baseline level.
Statistical analysis
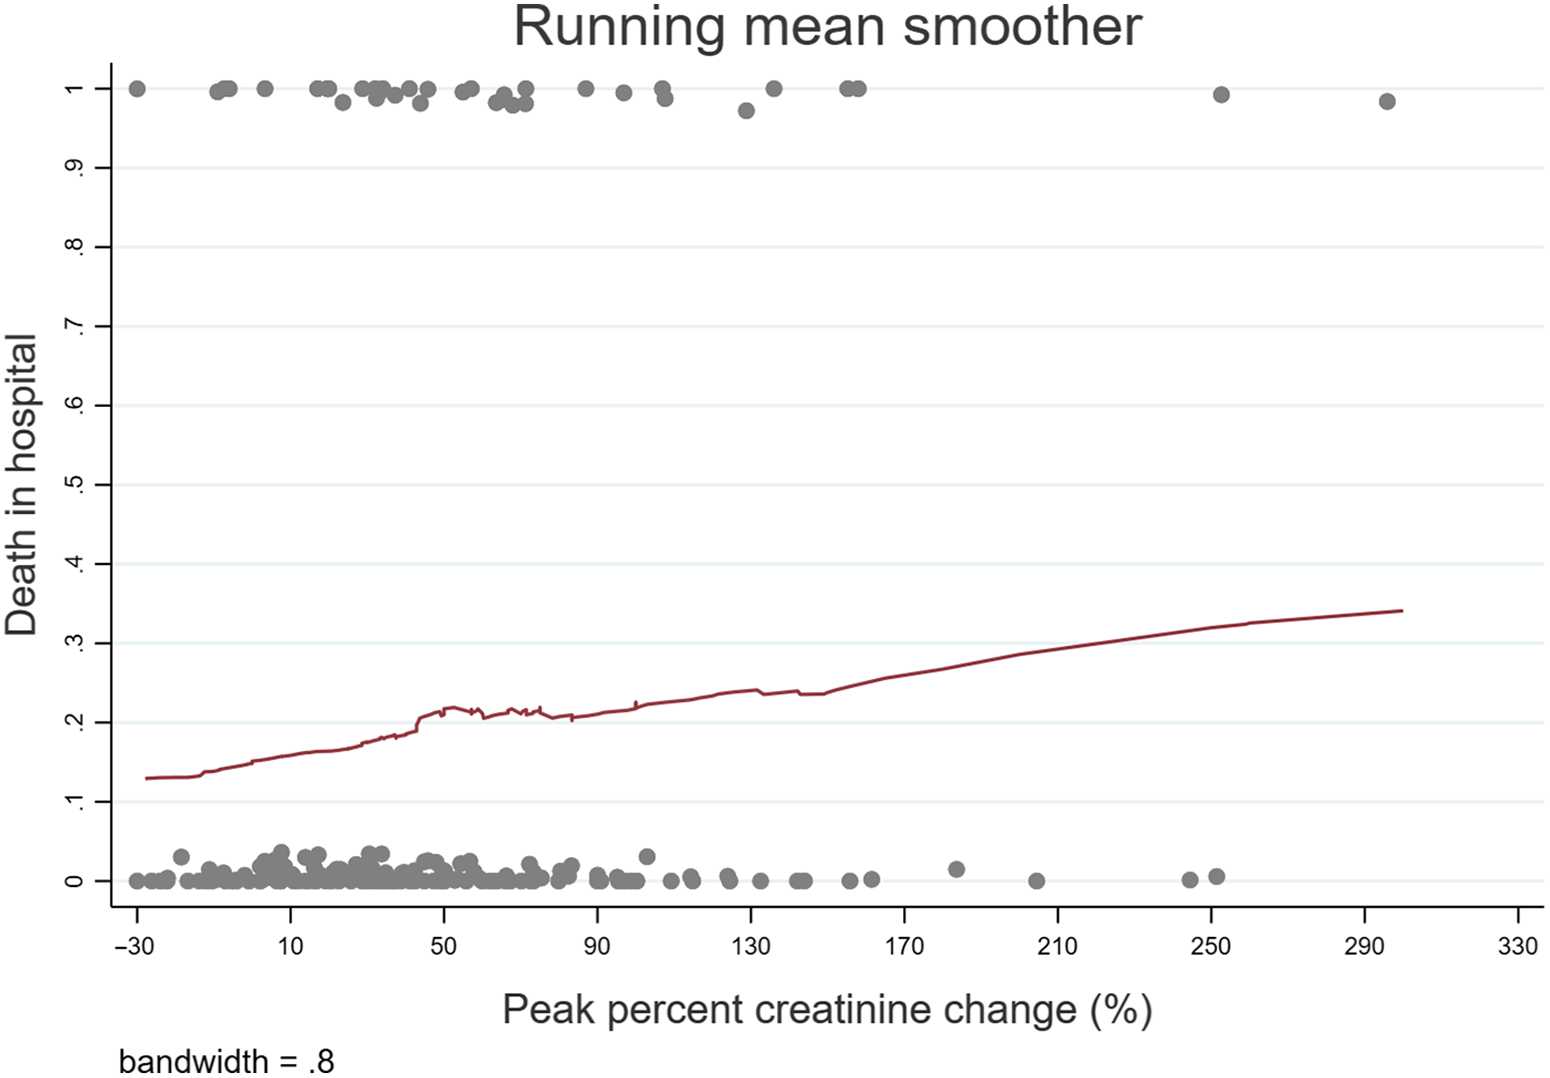
Peak percent creatinine change was initially modelled as a continuous variable. As an initial evaluation of the assumption of linearity between death in hospital and peak percent creatinine change, a scatter plot of locally weighted regression between death in hospital and peak percent creatinine change was created to provide a graphical display of the relationship.
Two separate multi-variable logistic regression analyses were undertaken to study the association between peak percent creatinine change and death in hospital.
-
(1) Model 1 used peak percent creatinine change (%) as a continuous variable and
-
(2) Model 2 used peak percent creatinine change as a categorical variable based on KDIGO acute kidney injury criteria (Normal = < 50% increase in baseline creatinine, Stage 1 = ≥50% increase, Stage 2 = ≥100% increase, Stage 3 = ≥ 200% increase).
The following independent variables along with the primary explanatory variable of interest (peak percent creatinine change) were evaluated for their association with outcome: age (continuous), ascending aorta diameter (mm, continuous) gestational age (weeks and days, continuous), cardiopulmonary bypass duration (minutes, continuous), type of surgery (binary, BT-Shunt versus RV-PA-conduit), post-operative requirement for extracorporeal membrane oxygenation(binary, yes/no), post-operative cardiac arrest (binary, yes/no), and pre-operative creatinine (continuous, μmol/L). In brief, the modeling consisted of an initial univariable analysis of each of these variables with the outcome. If this initial analysis yielded a p-value of less than 0.25, those variables were included in the initial multi-variable model. At this stage variables that do not contribute at traditional levels of significance were removed and the multi-variable model was further assessed for the effect of the removed variables.
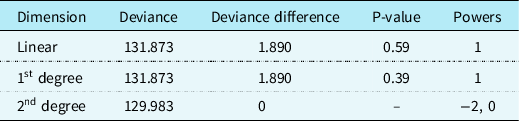
Once a multi-variable main effects model was developed, the assumption of linearity for continuous variable (in this case peak percent creatinine change) was further evaluated by an analytical method which utilises fractional polynomials (developed by Royston and Altman). Reference Royston and Altman14,Reference Royston and Sauerbrei15 While traditional regression models assume a linear relationship between independent and dependent variables, the fractional polynomial approach makes no underlying expectations about the relationship and thereby prevents the potential bias involved in pre-specifying the functional form. This method uses a broad class of powers of peak percent creatinine change (fractional polynomial powers) in the logistic regression model for risk of death. A likelihood ratio (deviance difference) test using a 5% significance level was used to assess whether a second-order (two power) model provided a better fit than first-order, and whether non-linear powers were better than a simple linear fit. The fit of the final model (model 1 and 2) was assessed by using a Hosmer–Lemeshow test with a group size of 10. Finally, a plot of the final fitted model of the log-odds of death for both the linear and categorical forms of the peak percent creatinine change was produced for visual comparison. Analysis was performed using STATA-IC (version 16.1; Stata Corp, College Station, TX).
Results
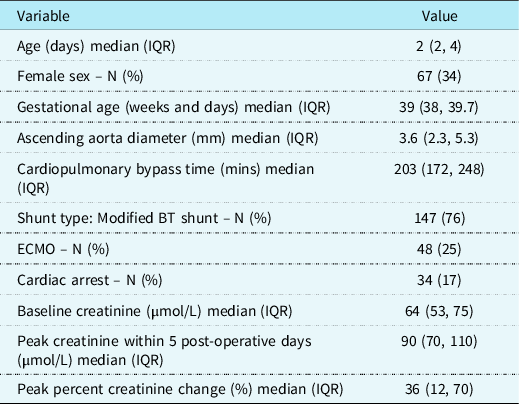
During the 15-year study period, 203 neonates underwent a stage one single ventricle reconstruction operation. Peak percent creatinine change of all 194 neonates who had complete study information was included in the final analysis (Table 1). 38 (19.6%) neonates died post-operatively during the same hospital stay. The visual examination using a locally weighted scatter smoothing graph shown in Figure 1 allows confirmation that the relationship is nearly linear between risk of death in hospital and peak percent creatinine change. In the fractional polynominal analysis, the deviance difference between the linear model and best second order model was small (deviance difference = 1.890, p = 0.59) (Table 2) and so it was concluded that the relationship could be modelled as linear to study the association between peak percent creatinine change and death in hospital.
Patient characteristics (n = 194)

ECMO, extracorporeal membrane oxygenation.
Locally weighted scatter plot smoothing curve to show the relationship between peak percent creatinine change and hospital death.
The above graph provides a visual confirmation of a satisfactory linear relationship between peak percent creatinine change and death in hospital. The smoothed value for the response variable for each subject is a weighted average of the values of the outcome variable over all subjects. The weight of each subject is a continuous decreasing function of the distance of the covariate under consideration from the value of the covariate for all other cases (Reference: Applied Logistic Regression (3rd edition) Hosmer, Lemeshow & Sturdivant). Other than a minor wiggle around peak percent creatinine change value of 50 the plotted line appears relatively linear and there is no reason to suspect that the risk of death is not linear with peak percent creatinine change.

Peak percent creatinine change and mortality in hospital: fractional polynomial comparisons

The deviance difference for the linear model is calculated as the difference in deviance between the linear model and the best second order model and for the first order model as the difference the best first order model and best second order model. The best first degree model in this case also happened to be the linear model (power=1).
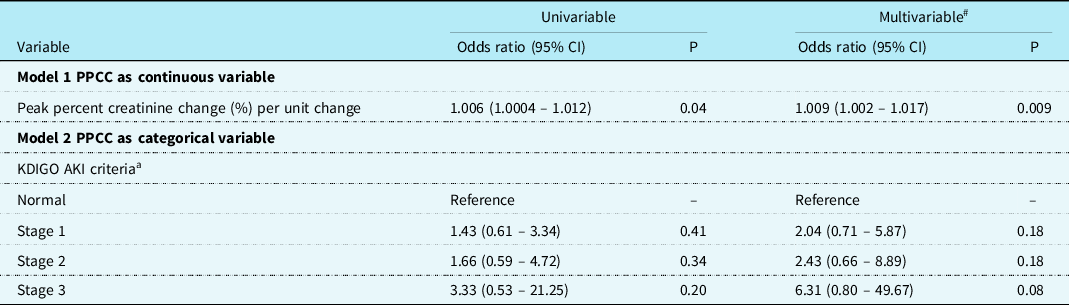
The results of the two multi-variable regression analyses are listed in Table 3. If peak percent creatinine change was used as a continuous variable (Model 1), for each unit increase in peak percent creatinine change the odds ratio (95% CI) for death in hospital was 1.009 (1.002–1.017). This meant that in this model, the odds ratio (95% CI) for death in hospital associated with a 50, 100, and 200% increase in peak percent creatinine change were 1.60 (1.12–2.28), 2.57 (1.27–5.22), and 6.62 (1.60–27.29), respectively. When peak percent creatinine change was modelled as a categorical variable based on the KDIGO criteria (Model 2), we failed to show a statistically significant association at alpha = 0.05 (two-tailed) between peak percent creatinine change and death in hospital [odds ratio (95% CI): Normal: reference; Stage 1: 2.04 (0.71–5.87); Stage 2: 2.43 (0.66–8.89); Stage 3: 6.31 (0.80–49.67)] (see supplemental data for full model). The Hosmer-Lemeshow goodness of fit test results for model 1 was χ2 = 7.49, p = 0.485 and model 2 it was χ2 = 9.18, p = 0.327.
Multivariable logistic regression models studying the association between peak percent creatinine change (as a continuous and categorical variable) and death in hospital following stage 1 operation

AKI = Acute kidney injury; CI = confidence interval; PPCC = peak percent creatinine change.
Note: The odds ratio (95% CI) using PPCC as a continuous variable (model 1) represents per unit change in PPCC. Given the risk of death increased log-linearly with PPCC, the results can be extended to estimate the odds ratio (95% CI) associated with a 50%, 100%, or 200 % increase in PPCC. For example, the odds ratio associated with a 50% increase in PPCC is obtained by (odds ratio per unit increase)50 = 1.00949750 = 1.60. The upper and lower 95% confidence intervals for odds ratios associated with a 50% increase can similarly be obtained by using the relevant upper and lower 95% confidence intervals of the odds ratio per unit increase. In this case it will be 1.00237350 = 1.12 and 1.01667150 = 2.28, respectively.
a AKI as classified by the KDIGO criteria: Normal = < 50% increase in baseline creatinine; Stage 1 = ≥ 50% increase in baseline creatinine, Stage 2 = ≥ 100% increase in baseline creatinine, stage 3 = ≥ 200% increase in baseline creatinine.
# The final multivariable model was adjusted for cardiopulmonary bypass duration (minutes), pre-operative (baseline) creatinine (µmol/L), requirement for post-operative ECMO, and post-operative cardiac arrest.
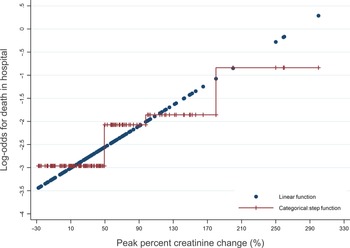
Figure 2 shows the changes in log-odds for death in the final fitted model comparing the continuous (blue dots) and categorical (red line) functional form of peak percent creatinine change. Each step in the categorical form represents a stage of acute kidney injury. It can be clearly seen that there is considerable variability in the log-odds estimated by the linear form of peak percentage creatinine change within each step (stage) of acute kidney injury. Participants close to each other but on opposite sides of a cut-point of a category are characterised as having very different rather than similar outcomes. In short, categorization failed to detect the continuous increase in risk associated with an increase in peak percent creatinine change.
Relationship between peak percent creatinine change and log-odds for death in hospital estimated using a categorical (red spike) and linear (blue dots) functional form for peak percent creatinine change.
(a) Categorical relationship is represented as a step function with each step representing a category. It is clear from the figure that the relationship is constant within each category and the corresponding linear relationship within each category shows substantial variability in the log-odds for death in hospital. (b) The plotted log-odds are adjusted for other covariates.

Discussion
This study shows the contradicting results that are obtained depending on the functional form chosen for the main explanatory variable in analysis. An association between peak percent creatinine change and risk of death would not have been detected in this data set, if acute kidney injury were defined according to categories (for example using KDIGO criteria). Our results confirm several past statements in the literature about the negative consequences when a continuous variable is either binarised or forced into quantiles for simplicity. Reference Altman and Royston2–Reference Naggara, Raymond, Guilbert, Roy, Weill and Altman4,Reference MacCallum, Zhang, Preacher and Rucker9,Reference Bennette and Vickers16 The presumed simplicity of dichotomisation or categorisation of variables is often gained at the cost of substantial loss of power in the analysis Reference Cohen17 and also at the risk of leaving residual confounding Reference Royston, Altman and Sauerbrei3 and producing inaccurate results.
Using appropriate statistical procedures, we confirmed the linear relationship between peak percent creatinine change and risk of death and subsequently reported the association between the variables. When comparing two adjacent groups of the KDIGO criteria, there is a sudden change in the estimates for the outcome variable when creatinine crosses the chosen cut-off point for a category. This approach is biologically not feasible and produces inaccurate estimates. Categories might be easy to remember in daily clinical practice, but this comes with a high cost; considerable variability of the assessed risk factor often exists within a category and the patient is expected to have the same outcome regardless of whether they are in the middle or at the very end of the defined range. Additionally, categorisation assumes that there is a discontinuity in the response to the predictor variable between groups.
Even when using pre-defined cut-points such as KDIGO criteria, the odds ratio produced will depend on the distribution of peak percent creatinine change in a given study sample. When using peak percent creatinine change as a continuous variable, it is still possible to calculate the odds ratio associated with a 50, 100 or 200 % increase (or any other desired value of the predictor variable) if those cut-offs are needed as shown in our example. In our example, the relationship was shown to be linear between the exposure and outcome; but if the linearity assumption is not satisfied, non-linear relationships could be suitably modelled using spline models or fractional polynomials and reported accordingly. Reference Royston and Sauerbrei15,Reference Greenland18 These modelling approaches offer the flexibility to describe relatively simple or more complex exposure response patterns of association. For researchers with a good background knowledge of statistics (along with an understanding of the limitations of different approaches) and experience in using statistical software, we would expect it to be reasonably straightforward to implement this in practice. Major statistical softwares have programmes that use either fractional polynomial approach or spline models to assess and fit non-linear continuous variables. For researchers with limited statistical training, we recommend working with a statistician or quantitative methodologist whenever possible. Such a strategy will enhance the quality of clinical research, its reporting and ultimately benefit the patients.
Categorising a continuous explanatory variable may not only miss an important clinical or research message but it can also get it wrong. Reference van Walraven and Hart19 Researchers are often not aware of these implications Reference MacCallum, Zhang, Preacher and Rucker9 and this important aspect of study planning and analysis is often not considered and this includes our experience as well. Every effort must be made by researchers to analyse the explanatory variable in its true functional form. This is particularly relevant in small datasets which account for the majority of medical studies published. Categorisation introduces an extreme form of rounding of the explanatory variable resulting in substantial loss of information and power (up to 50% in some cases). Reference Royston and Sauerbrei20 Calculations based on the continuous “raw” data delivers more accurate results and also facilitates an easier comparison between multiple studies that describe the same exposure–outcome relationship.
We are not advocating a complete rejection of categories and they often play an important role in the initial assessment of an exposure–outcome relationship. But researchers should go further and identify the true nature of this relationship, decide whether it is linear or non-linear and use appropriate statistical techniques to model them. Determining the true relationship between the exposure of interest and outcome is vital in health research. Continuous variables play an important role in all areas of medical research; researchers should strive to identify and use the most appropriate functional form of the explanatory variable.
Supplementary material
To view supplementary material for this article, please visit https://doi.org/10.1017/S1047951122002384
Acknowledgements
Dr Namachivayam is supported by a health professional research scholarship (award no: 101003) from the National Heart Foundation of Australia.
Financial support
This research did not receive any specific grant from funding agencies in the public, commercial, or not-for-profit sectors.
Conflicts of interest
None.
Ethical standards
Not applicable.